| Param | Original file | Final file |
|---|---|---|
| Filename | modeM0/AS1A11_075T01_9000005244_36860cztM0_level2.evt | modeM0/AS1A11_075T01_9000005244_36860cztM0_level2_quad_clean.evt |
| Size (bytes) | 868,443,840 | 141,226,560 |
| Size | 828.2 MB | 134.7 MB |
| Events in quadrant A | 7,102,965 | 1,077,922 |
| Events in quadrant B | 2,275,455 | 18,222 |
| Events in quadrant C | 7,364,675 | 1,104,635 |
| Events in quadrant D | 8,525,854 | 1,036,013 |
| Mode SS | |||
|---|---|---|---|
| Quadrant | BADHDUFLAG | Total packets | Discarded packets |
| A | 0 | 308 | 0 |
| B | 0 | 308 | 0 |
| C | 0 | 308 | 0 |
| D | 0 | 308 | 0 |
| Mode M0 | |||
|---|---|---|---|
| Quadrant | BADHDUFLAG | Total packets | Discarded packets |
| A | 0 | 30778 | 4 |
| B | 0 | 15186 | 3 |
| C | 0 | 31279 | 3 |
| D | 0 | 35926 | 3 |
| Mode M9 | |||
|---|---|---|---|
| Quadrant | BADHDUFLAG | Total packets | Discarded packets |
| A | 0 | 43 | 0 |
| B | 0 | 43 | 0 |
| C | 0 | 43 | 0 |
| D | 0 | 43 | 0 |
| Quadrant | Total seconds | Saturated seconds | Saturation percentage |
|---|---|---|---|
| A | 14998 | 26 | 0.173356% |
| B | 14998 | 14998 | 100.000000% |
| C | 14998 | 51 | 0.340045% |
| D | 14998 | 317 | 2.113615% |
Noise dominated data is calculated using 1-second bins in cleaned event files. If a bin has >2000 counts, and if more than 50% of those come from <1% of pixels, then it is considered to be noise-dominated and hence unusable.
| Quadrant | # 1 sec bins | Bins with >0 counts | Bins with >2000 counts | High rate bins dominated by noise | Noise dominated (total time) | Noise dominated (detector-on time) | Marked lightcurve |
|---|---|---|---|---|---|---|---|
| A | 19387 | 15001 | 8 | 8 | 0.04% | 0.05% | 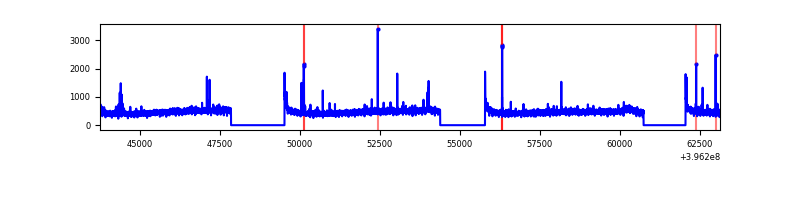 |
| B | 19386 | 14997 | 0 | 0 | 0.00% | 0.00% | 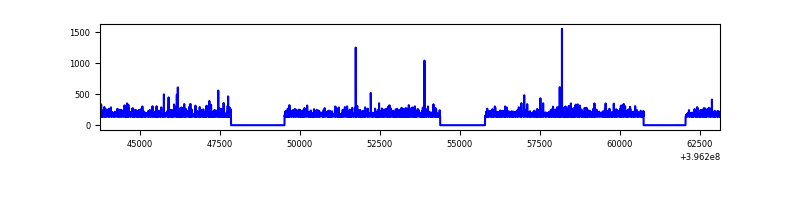 |
| C | 19387 | 15001 | 39 | 39 | 0.20% | 0.26% | 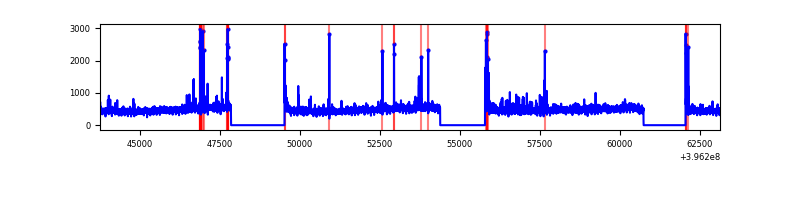 |
| D | 19387 | 15001 | 298 | 298 | 1.54% | 1.99% | 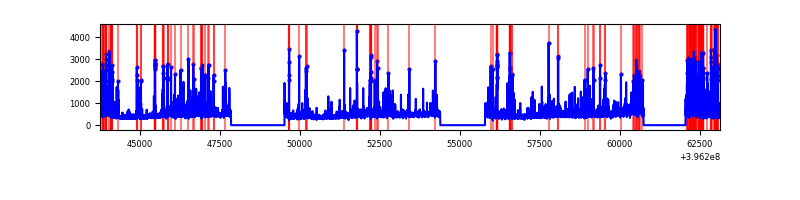 |
Top three noisy pixels from each quadrant. If the there are fewer than three noisy pixels in the level2.evt file, extra rows are filled as -1
| Pixel properties | Quadrant properties | ||||||
|---|---|---|---|---|---|---|---|
| Quadrant | DetID | PixID | Counts | Sigma | Mean | Median | Sigma |
| A | 10 | 83 | 508042 | 1509.88 | 1664 | 1631 | 335.4 |
| A | 9 | 143 | 93203 | 273.03 | 1664 | 1631 | 335.4 |
| A | 13 | 6 | 41989 | 120.33 | 1664 | 1631 | 335.4 |
| B | 12 | 243 | 2081231 | 241191.06 | 33 | 32 | 8.6 |
| B | 12 | 144 | 39295 | 4550.21 | 33 | 32 | 8.6 |
| B | 0 | 213 | 5640 | 649.91 | 33 | 32 | 8.6 |
| C | 15 | 214 | 636128 | 1696.43 | 1618 | 1630 | 374.0 |
| C | 0 | 10 | 208217 | 552.34 | 1618 | 1630 | 374.0 |
| C | 3 | 233 | 104729 | 275.65 | 1618 | 1630 | 374.0 |
| D | 13 | 249 | 451497 | 1147.45 | 1613 | 1569 | 392.1 |
| D | 2 | 153 | 445232 | 1131.47 | 1613 | 1569 | 392.1 |
| D | 2 | 249 | 441258 | 1121.34 | 1613 | 1569 | 392.1 |
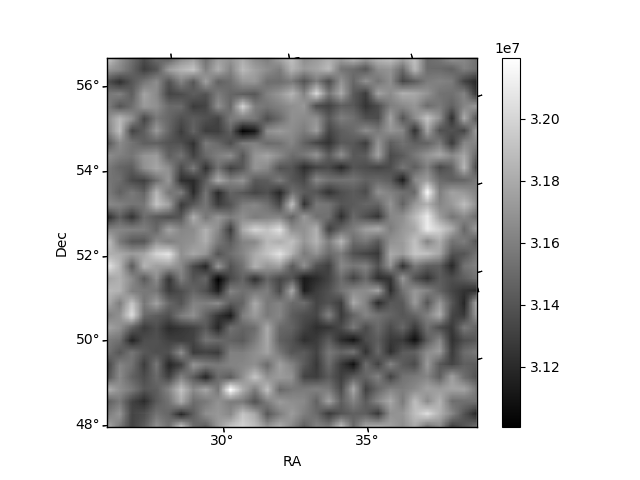
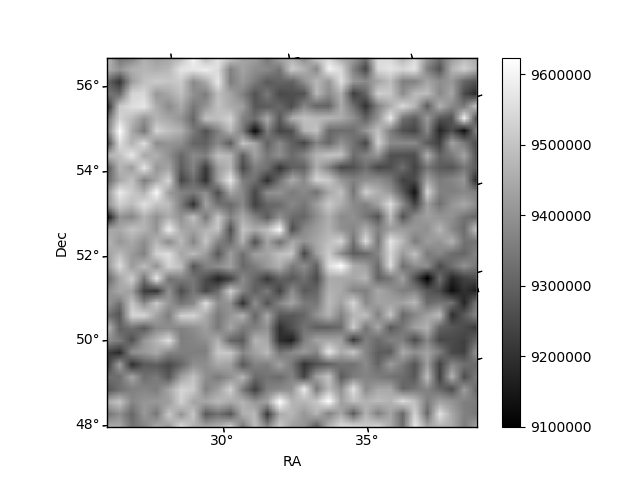
Histogram calculated using DETX and DETY for each event in the final _common_clean file
| Quadrant A | 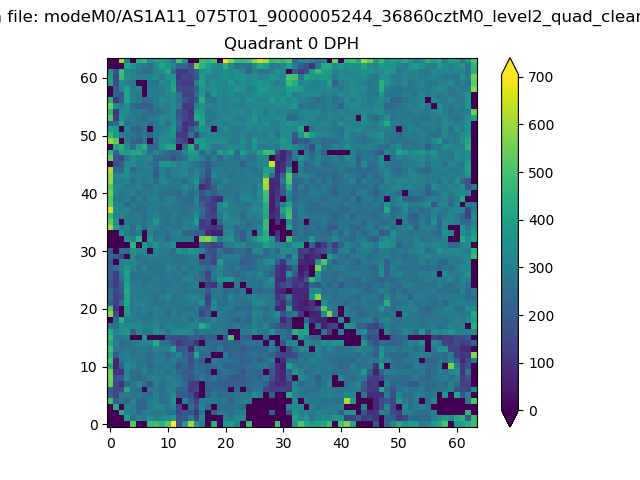 |
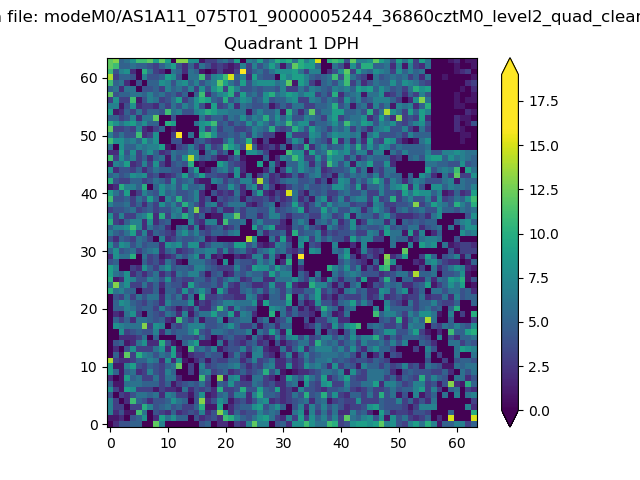 |
Quadrant B |
|---|---|---|---|
| Quadrant D | 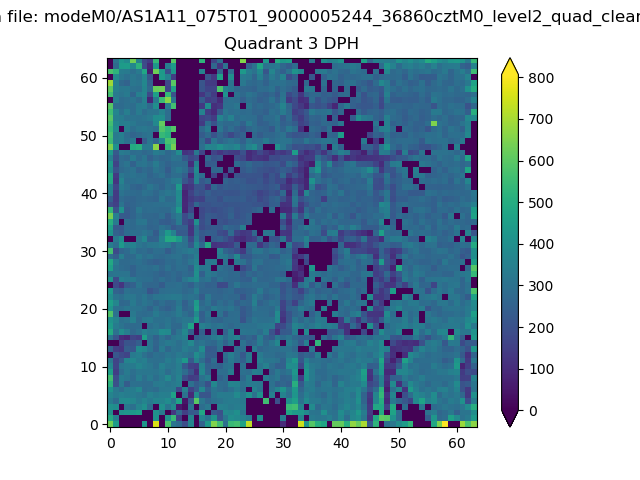 |
 |
Quadrant C |
| Plot type | Count rate plots | Images |
|---|---|---|
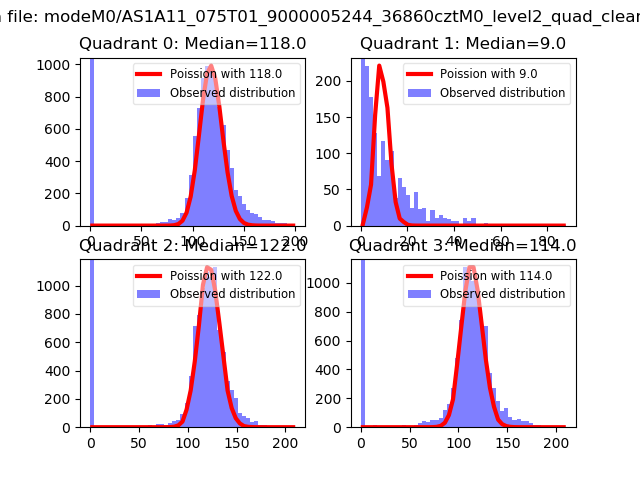
| Comparison with Poisson distribution Blue bars denote a histogram of data divided into 1 sec bins. Red curve is a Poisson curve with rate = median count rate of data. |
 |
 |
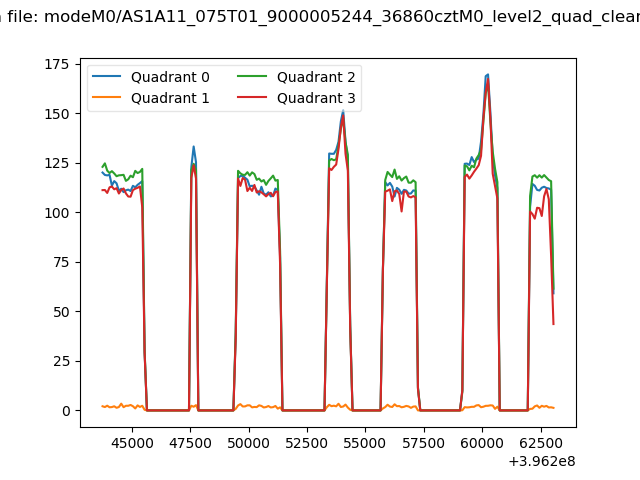
| Quadrant-wise count rates Data is divided into 100 sec bins |
 |
|
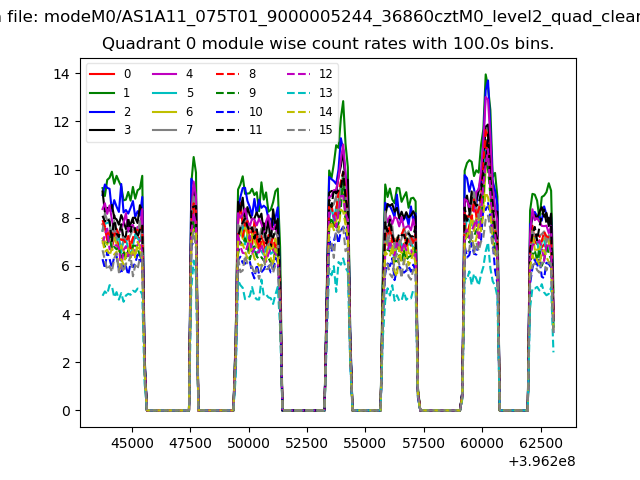
| Module-wise count rates for Quadrant A Data is divided into 100 sec bins |
 |
 |
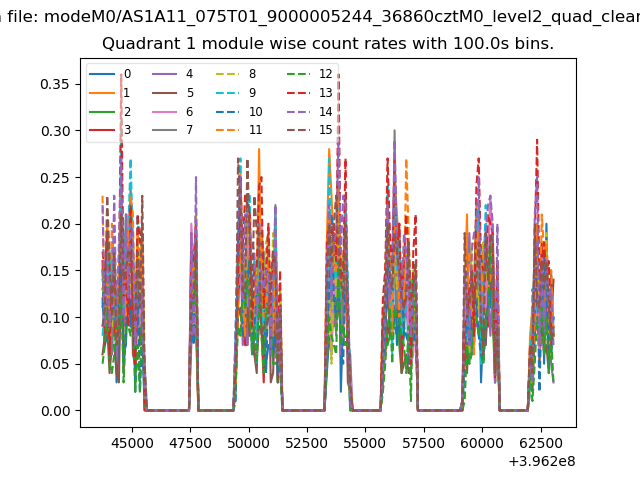
| Module-wise count rates for Quadrant B Data is divided into 100 sec bins |
 |
 |
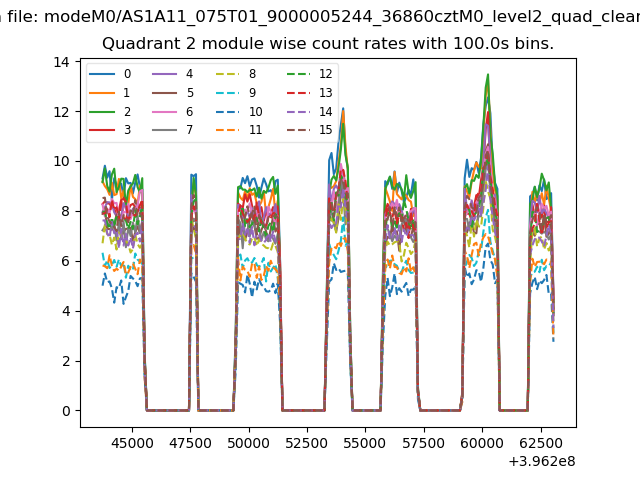
| Module-wise count rates for Quadrant C Data is divided into 100 sec bins |
 |
 |
| Module-wise count rates for Quadrant D Data is divided into 100 sec bins |
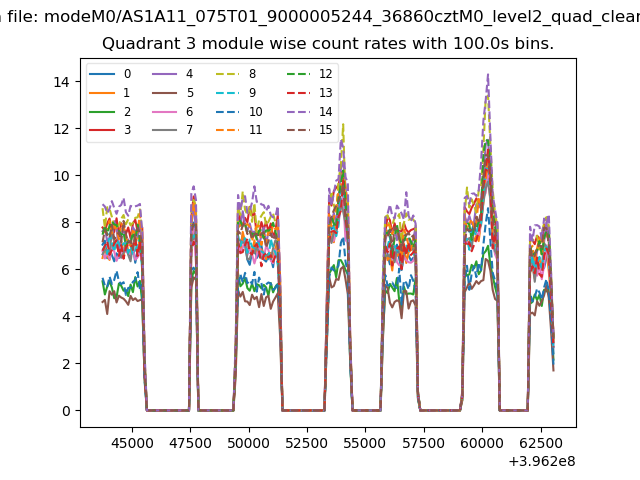 |
 |
| Parameter | Plot |
|---|---|
| CZT HV Monitor | 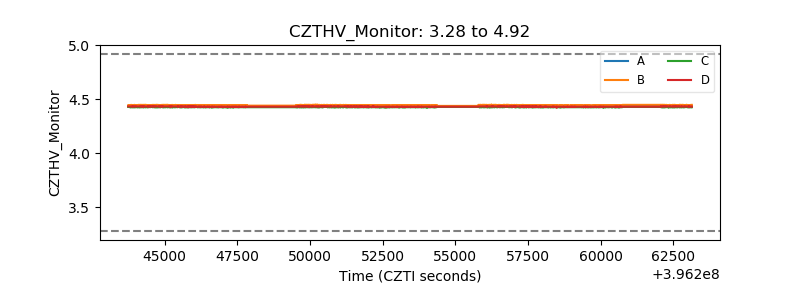 |
| D_VDD | 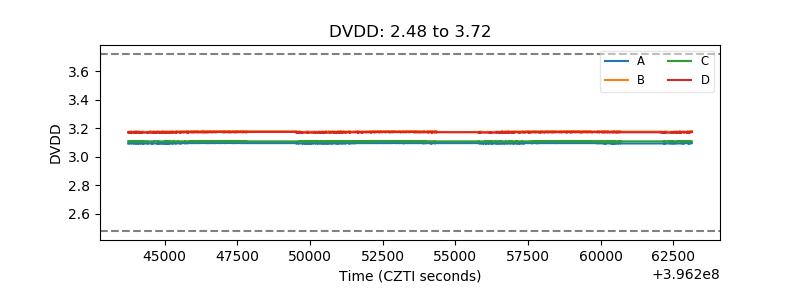 |
| Temperature 1 | 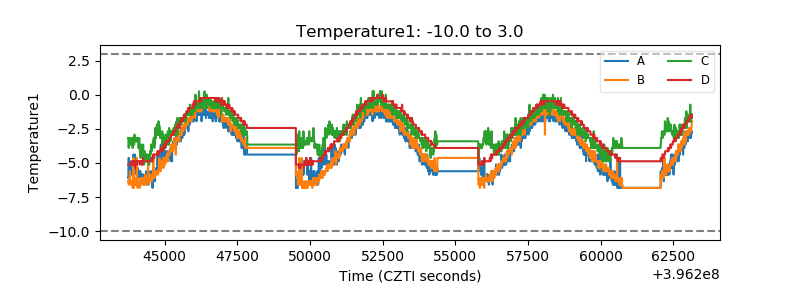 |
| Veto HV Monitor | 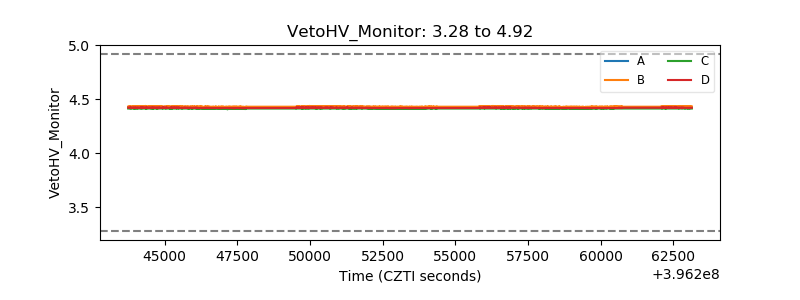 |
| Veto LLD | 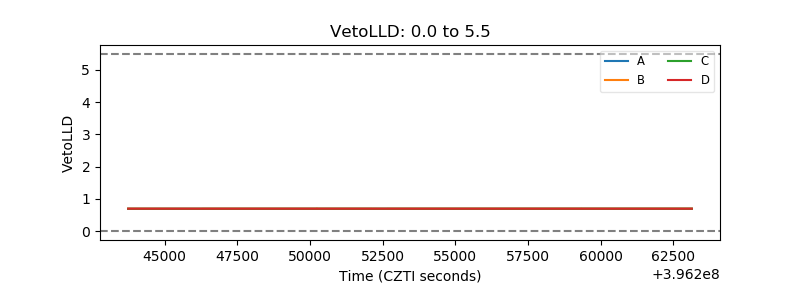 |
| Alpha Counter | 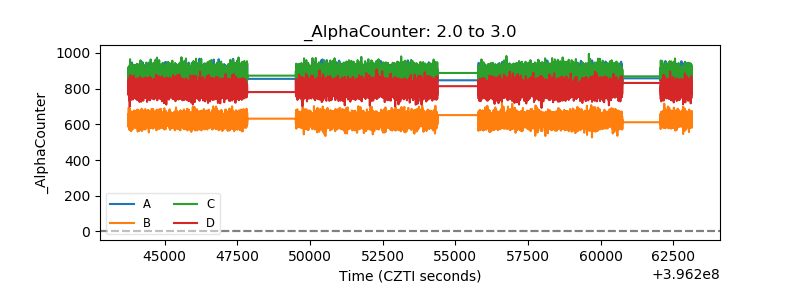 |
| _CPM_Rate | 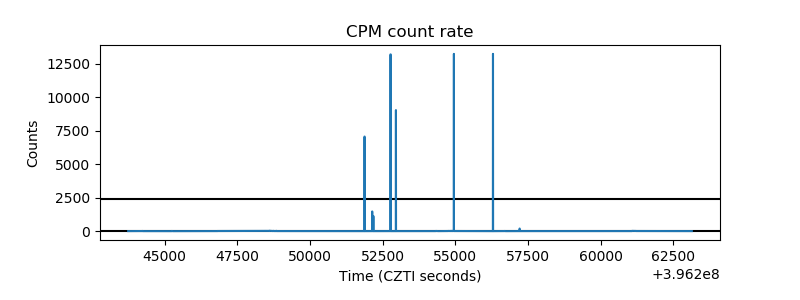 |
| CZT Counter | 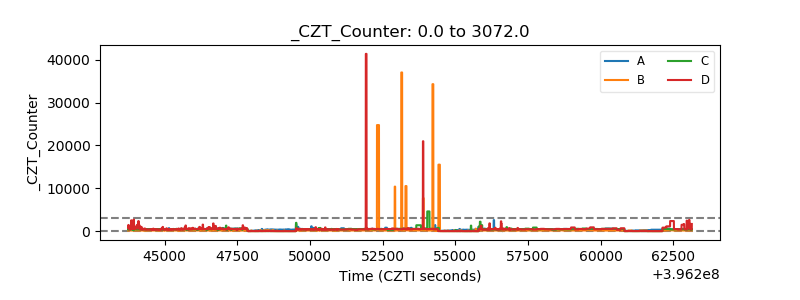 |
| +2.5 Volts monitor | 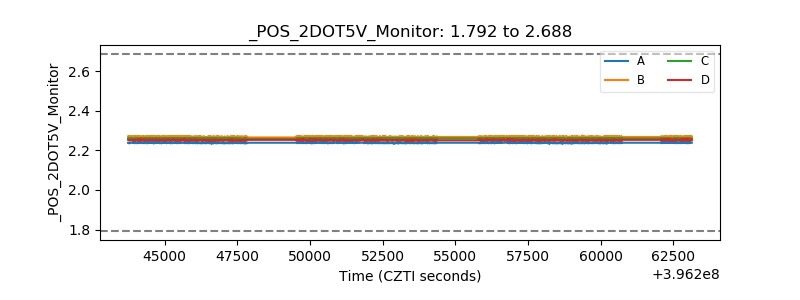 |
| +5 Volts monitor | 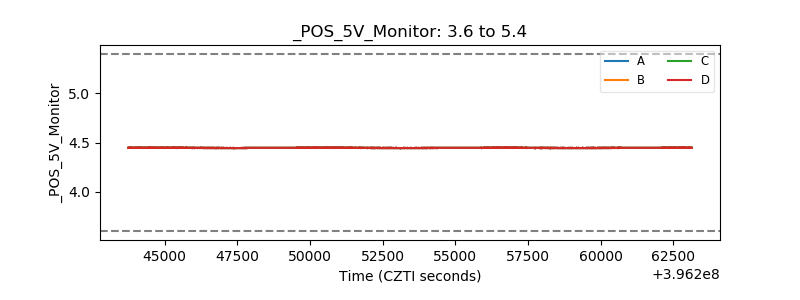 |
| _ROLL_ROT | 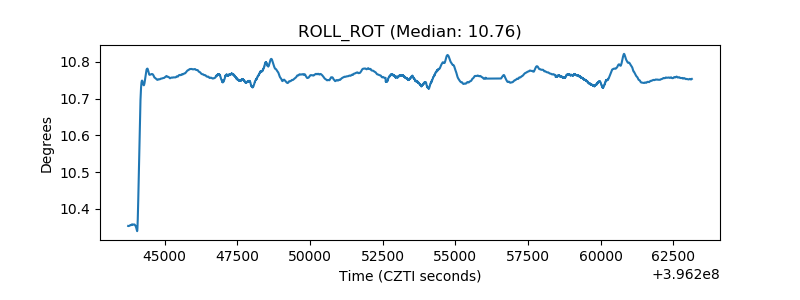 |
| _Roll_DEC | 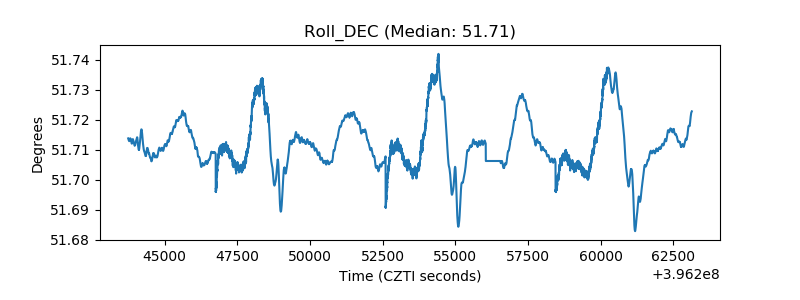 |
| _Roll_RA | 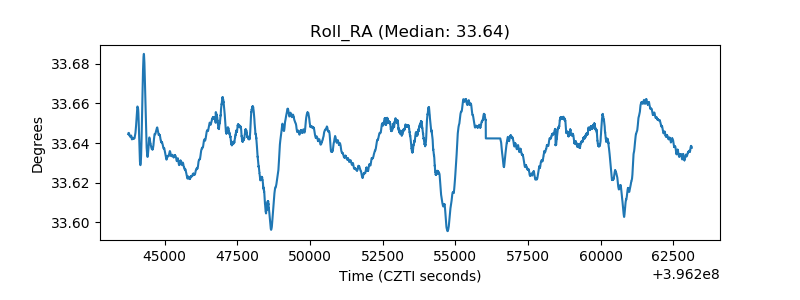 |
| Veto Counter | 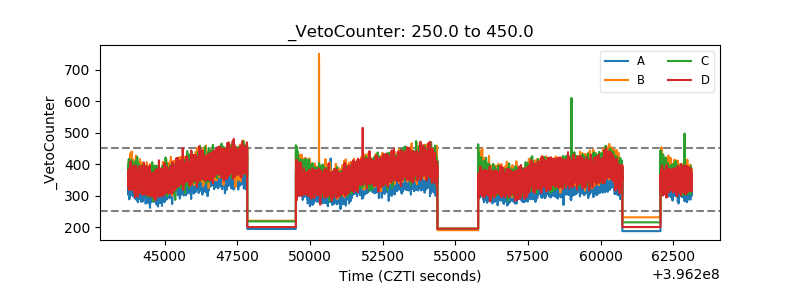 |