| Param | Original file | Final file |
|---|---|---|
| Filename | modeM0/AS1A11_075T01_9000005244_36863cztM0_level2.evt | modeM0/AS1A11_075T01_9000005244_36863cztM0_level2_quad_clean.evt |
| Size (bytes) | 1,066,717,440 | 137,361,600 |
| Size | 1017.3 MB | 131.0 MB |
| Events in quadrant A | 7,631,693 | 1,078,366 |
| Events in quadrant B | 2,377,663 | 18,366 |
| Events in quadrant C | 8,057,774 | 1,069,130 |
| Events in quadrant D | 13,170,581 | 915,142 |
| Mode SS | |||
|---|---|---|---|
| Quadrant | BADHDUFLAG | Total packets | Discarded packets |
| A | 0 | 316 | 0 |
| B | 0 | 316 | 0 |
| C | 0 | 316 | 0 |
| D | 0 | 316 | 0 |
| Mode M0 | |||
|---|---|---|---|
| Quadrant | BADHDUFLAG | Total packets | Discarded packets |
| A | 0 | 32627 | 5 |
| B | 0 | 15816 | 4 |
| C | 0 | 33336 | 4 |
| D | 0 | 49588 | 4 |
| Mode M9 | |||
|---|---|---|---|
| Quadrant | BADHDUFLAG | Total packets | Discarded packets |
| A | 0 | 43 | 0 |
| B | 0 | 43 | 0 |
| C | 0 | 43 | 0 |
| D | 0 | 44 | 0 |
| Quadrant | Total seconds | Saturated seconds | Saturation percentage |
|---|---|---|---|
| A | 15566 | 49 | 0.314789% |
| B | 15566 | 15566 | 100.000000% |
| C | 15566 | 66 | 0.424001% |
| D | 15566 | 1821 | 11.698574% |
Noise dominated data is calculated using 1-second bins in cleaned event files. If a bin has >2000 counts, and if more than 50% of those come from <1% of pixels, then it is considered to be noise-dominated and hence unusable.
| Quadrant | # 1 sec bins | Bins with >0 counts | Bins with >2000 counts | High rate bins dominated by noise | Noise dominated (total time) | Noise dominated (detector-on time) | Marked lightcurve |
|---|---|---|---|---|---|---|---|
| A | 19806 | 15569 | 24 | 24 | 0.12% | 0.15% | 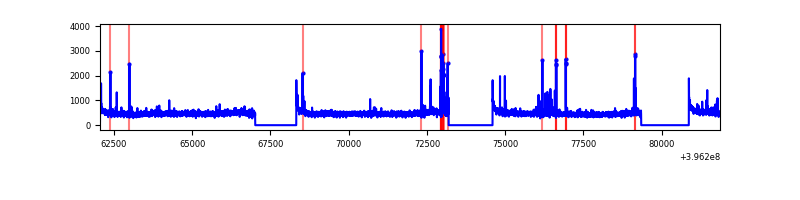 |
| B | 19805 | 15565 | 1 | 1 | 0.01% | 0.01% | 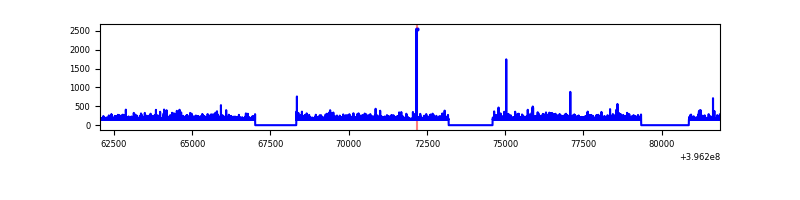 |
| C | 19806 | 15569 | 56 | 56 | 0.28% | 0.36% | 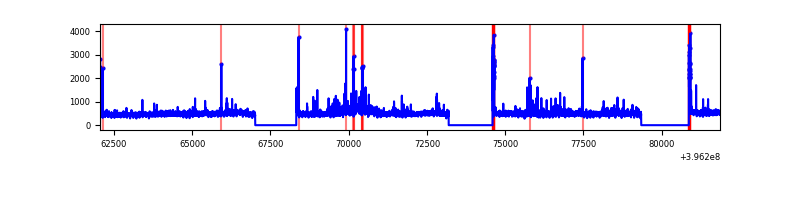 |
| D | 19806 | 15568 | 1730 | 1730 | 8.73% | 11.11% | 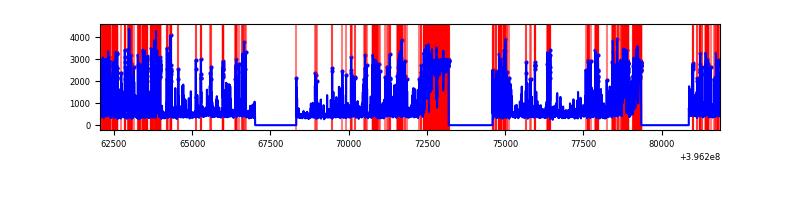 |
Top three noisy pixels from each quadrant. If the there are fewer than three noisy pixels in the level2.evt file, extra rows are filled as -1
| Pixel properties | Quadrant properties | ||||||
|---|---|---|---|---|---|---|---|
| Quadrant | DetID | PixID | Counts | Sigma | Mean | Median | Sigma |
| A | 10 | 83 | 594242 | 1684.17 | 1739 | 1705 | 351.8 |
| A | 9 | 143 | 146172 | 410.62 | 1739 | 1705 | 351.8 |
| A | 7 | 16 | 106506 | 297.88 | 1739 | 1705 | 351.8 |
| B | 12 | 243 | 2157126 | 231821.41 | 37 | 36 | 9.3 |
| B | 12 | 144 | 40918 | 4393.57 | 37 | 36 | 9.3 |
| B | 0 | 213 | 5748 | 613.87 | 37 | 36 | 9.3 |
| C | 15 | 214 | 667592 | 1702.81 | 1690 | 1707 | 391.1 |
| C | 0 | 239 | 405077 | 1031.5 | 1690 | 1707 | 391.1 |
| C | 0 | 10 | 247072 | 627.45 | 1690 | 1707 | 391.1 |
| D | 12 | 17 | 3164249 | 8053.0 | 1594 | 1552 | 392.7 |
| D | 13 | 249 | 1426385 | 3627.97 | 1594 | 1552 | 392.7 |
| D | 2 | 249 | 818991 | 2081.4 | 1594 | 1552 | 392.7 |
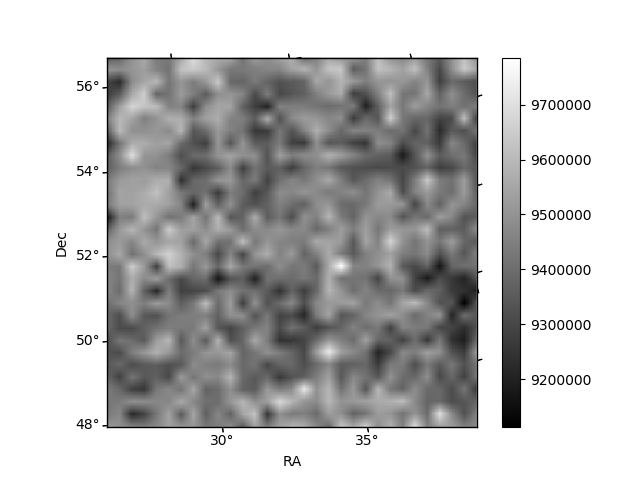
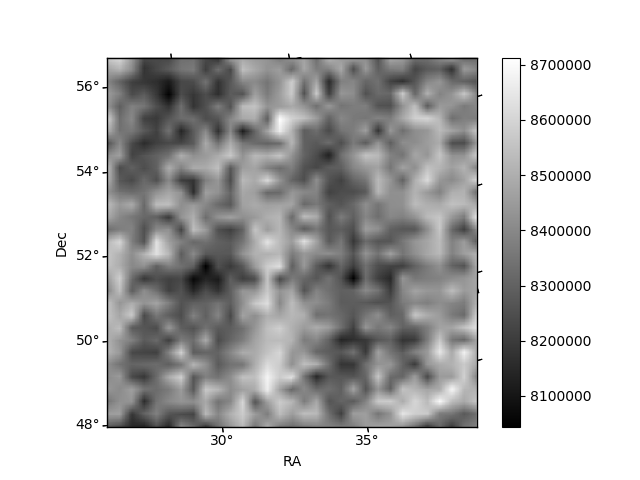
Histogram calculated using DETX and DETY for each event in the final _common_clean file
| Quadrant A | 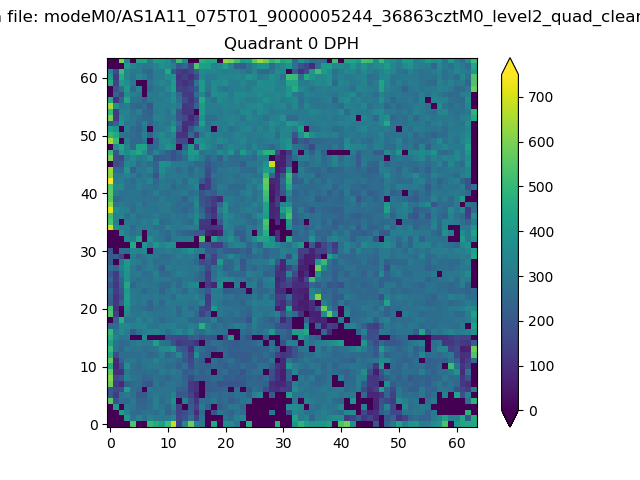 |
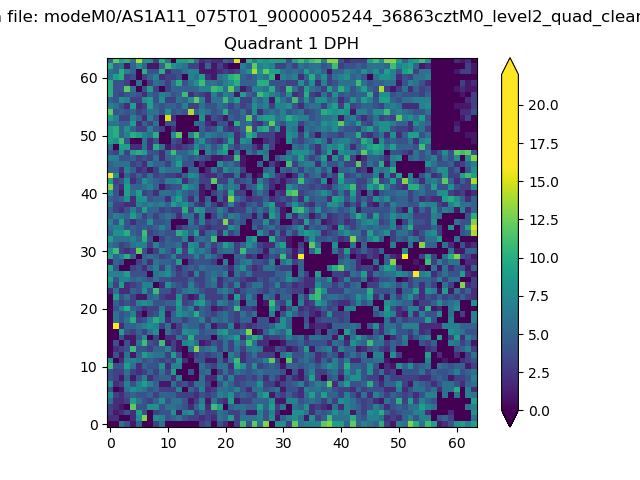 |
Quadrant B |
|---|---|---|---|
| Quadrant D | 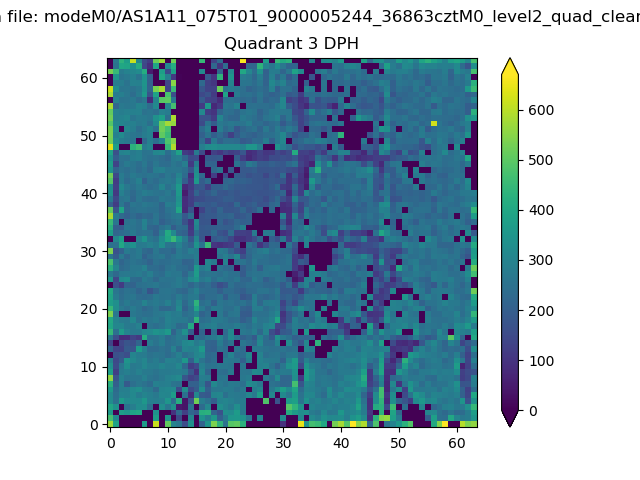 |
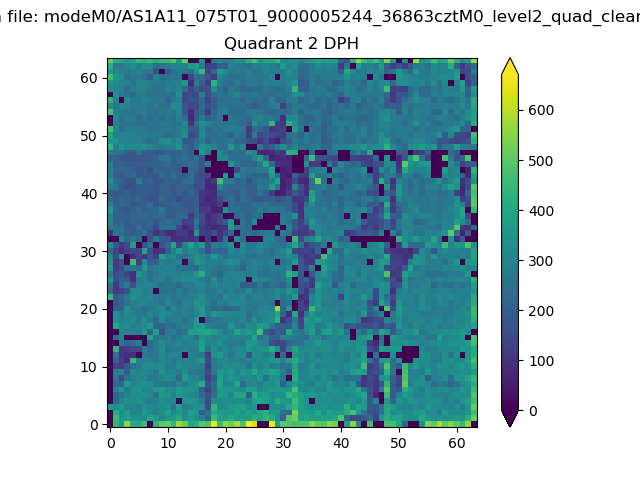 |
Quadrant C |
| Plot type | Count rate plots | Images |
|---|---|---|
| Comparison with Poisson distribution Blue bars denote a histogram of data divided into 1 sec bins. Red curve is a Poisson curve with rate = median count rate of data. |
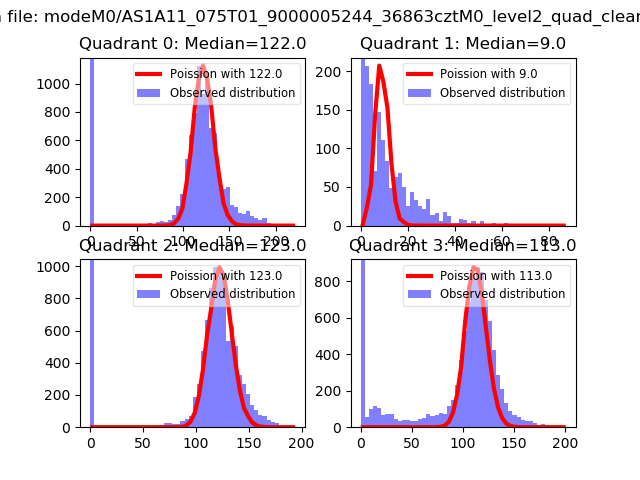 |
 |
| Quadrant-wise count rates Data is divided into 100 sec bins |
 |
|
| Module-wise count rates for Quadrant A Data is divided into 100 sec bins |
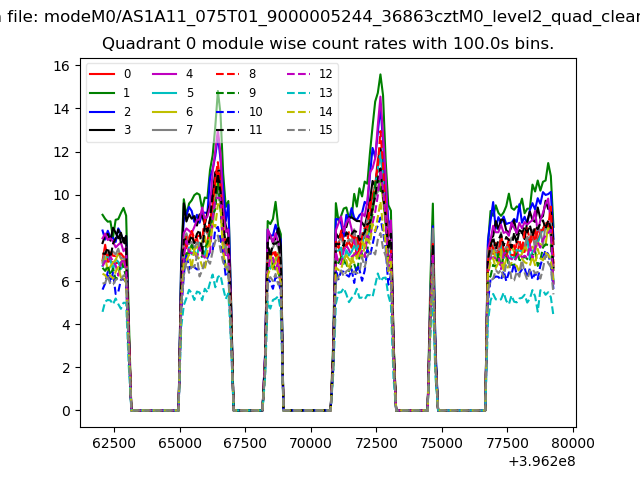 |
 |
| Module-wise count rates for Quadrant B Data is divided into 100 sec bins |
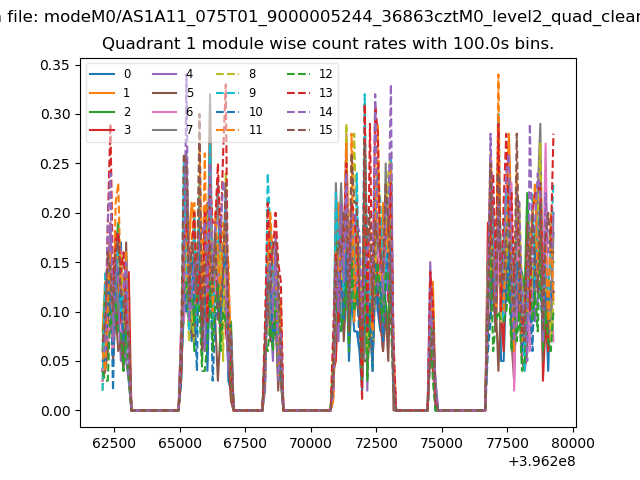 |
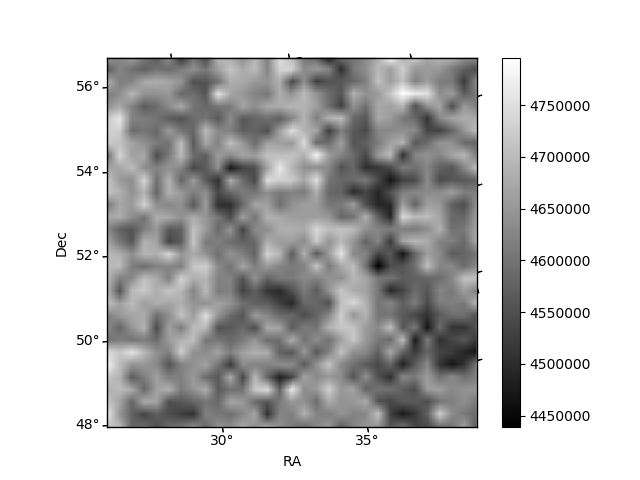 |
| Module-wise count rates for Quadrant C Data is divided into 100 sec bins |
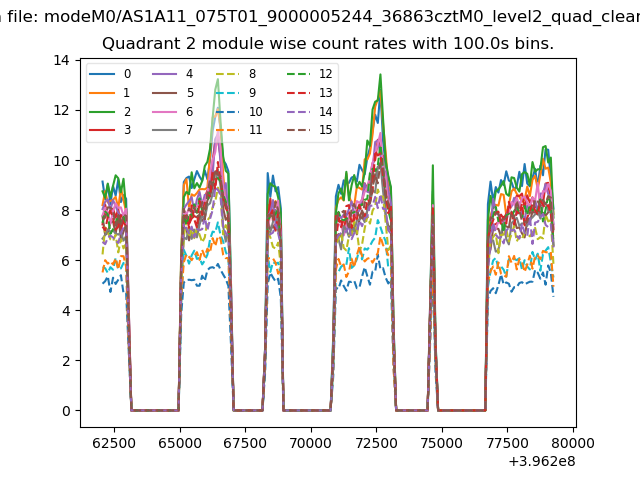 |
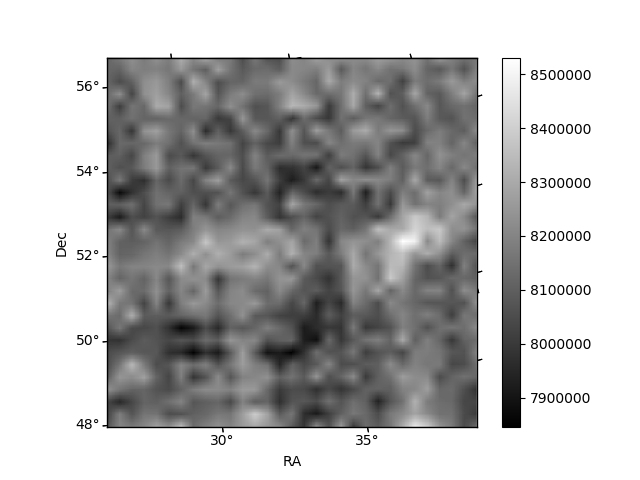 |
| Module-wise count rates for Quadrant D Data is divided into 100 sec bins |
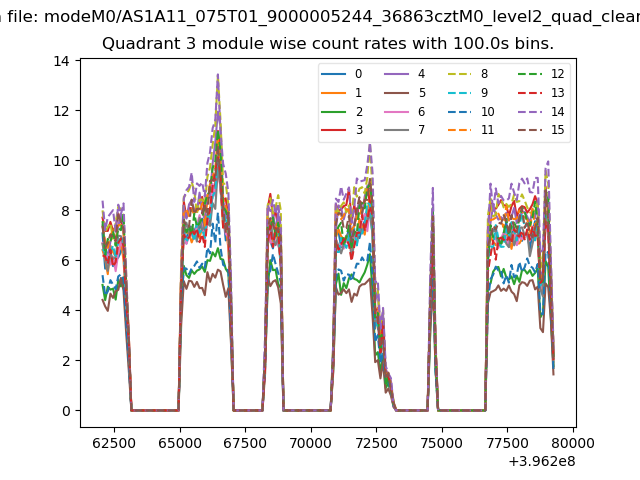 |
 |
| Parameter | Plot |
|---|---|
| CZT HV Monitor | 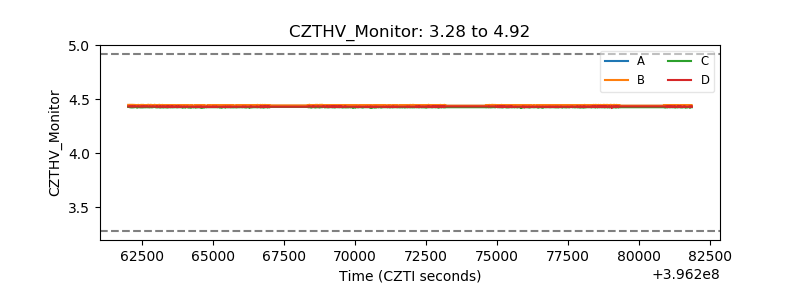 |
| D_VDD | 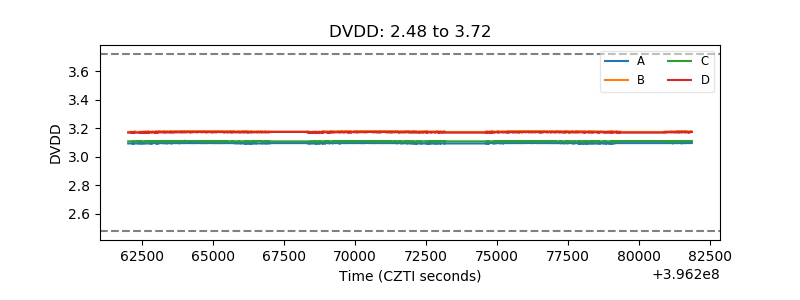 |
| Temperature 1 |  |
| Veto HV Monitor | 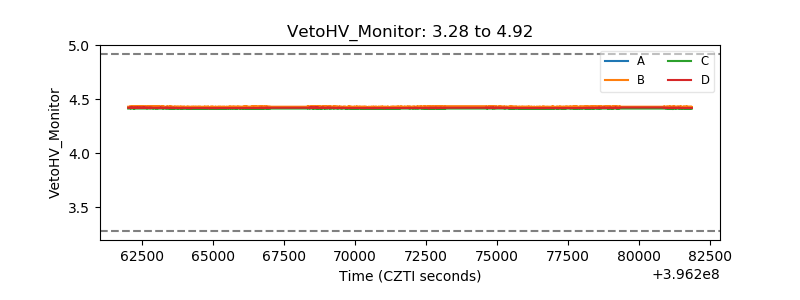 |
| Veto LLD | 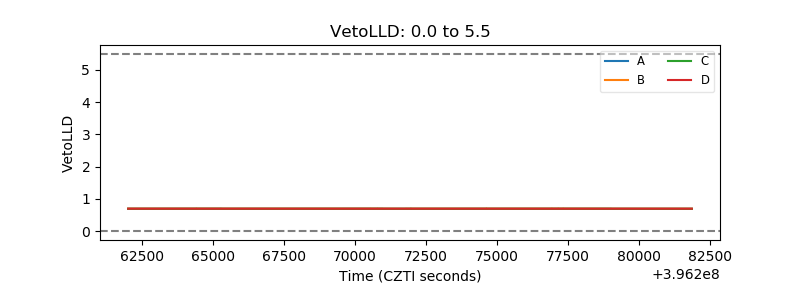 |
| Alpha Counter | 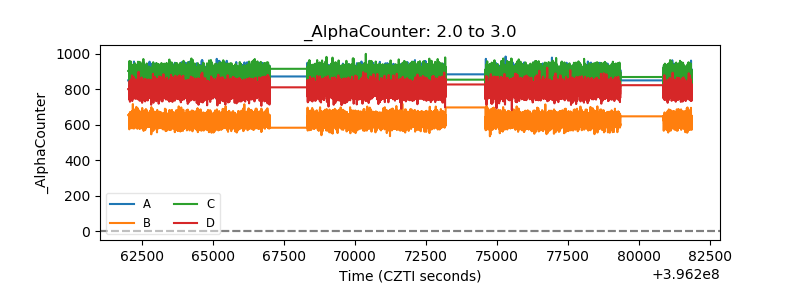 |
| _CPM_Rate | 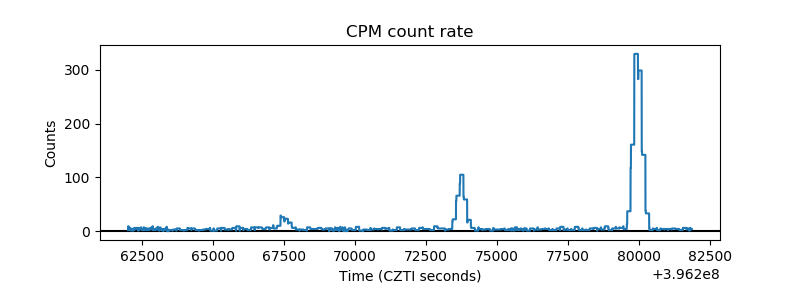 |
| CZT Counter |  |
| +2.5 Volts monitor |  |
| +5 Volts monitor |  |
| _ROLL_ROT | 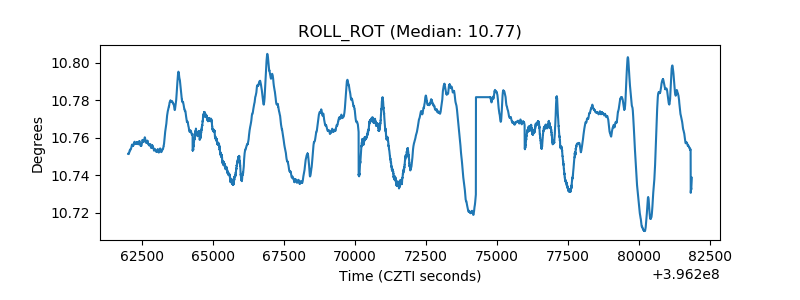 |
| _Roll_DEC | 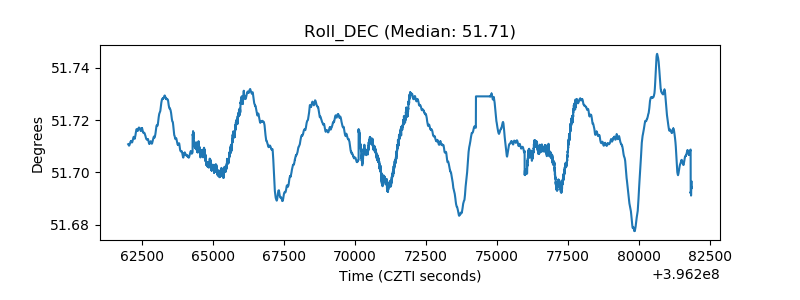 |
| _Roll_RA | 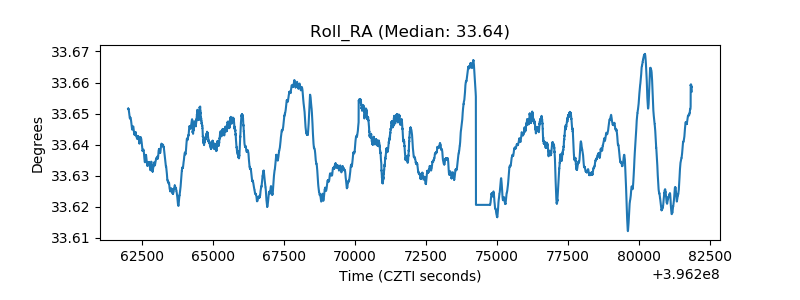 |
| Veto Counter | 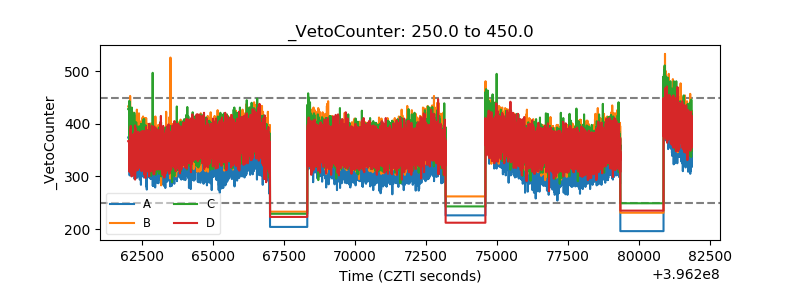 |