| Param | Original file | Final file |
|---|---|---|
| Filename | modeM0/AS1A11_075T01_9000005244_36864cztM0_level2.evt | modeM0/AS1A11_075T01_9000005244_36864cztM0_level2_quad_clean.evt |
| Size (bytes) | 365,146,560 | 46,687,680 |
| Size | 348.2 MB | 44.5 MB |
| Events in quadrant A | 2,724,203 | 348,195 |
| Events in quadrant B | 841,653 | 5,911 |
| Events in quadrant C | 2,969,340 | 348,528 |
| Events in quadrant D | 4,144,839 | 325,766 |
| Mode SS | |||
|---|---|---|---|
| Quadrant | BADHDUFLAG | Total packets | Discarded packets |
| A | 0 | 110 | 0 |
| B | 0 | 110 | 0 |
| C | 0 | 110 | 0 |
| D | 0 | 110 | 0 |
| Mode M0 | |||
|---|---|---|---|
| Quadrant | BADHDUFLAG | Total packets | Discarded packets |
| A | 0 | 11723 | 3 |
| B | 0 | 5581 | 2 |
| C | 0 | 12143 | 2 |
| D | 0 | 16071 | 2 |
| Mode M9 | |||
|---|---|---|---|
| Quadrant | BADHDUFLAG | Total packets | Discarded packets |
| A | 0 | 20 | 0 |
| B | 0 | 20 | 0 |
| C | 0 | 20 | 0 |
| D | 0 | 21 | 0 |
| Quadrant | Total seconds | Saturated seconds | Saturation percentage |
|---|---|---|---|
| A | 5485 | 17 | 0.309936% |
| B | 5485 | 5485 | 100.000000% |
| C | 5485 | 79 | 1.440292% |
| D | 5485 | 324 | 5.907019% |
Noise dominated data is calculated using 1-second bins in cleaned event files. If a bin has >2000 counts, and if more than 50% of those come from <1% of pixels, then it is considered to be noise-dominated and hence unusable.
| Quadrant | # 1 sec bins | Bins with >0 counts | Bins with >2000 counts | High rate bins dominated by noise | Noise dominated (total time) | Noise dominated (detector-on time) | Marked lightcurve |
|---|---|---|---|---|---|---|---|
| A | 7128 | 5486 | 2 | 2 | 0.03% | 0.04% | 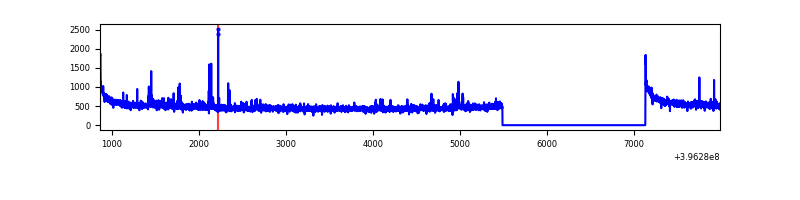 |
| B | 7127 | 5484 | 0 | 0 | 0.00% | 0.00% | 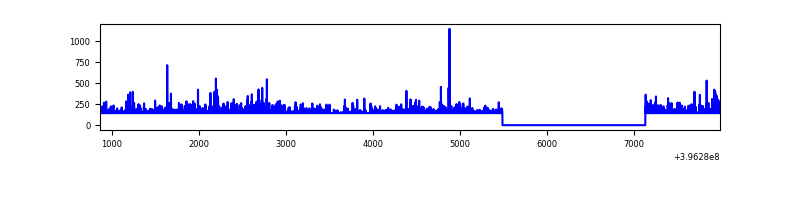 |
| C | 7128 | 5486 | 68 | 68 | 0.95% | 1.24% | 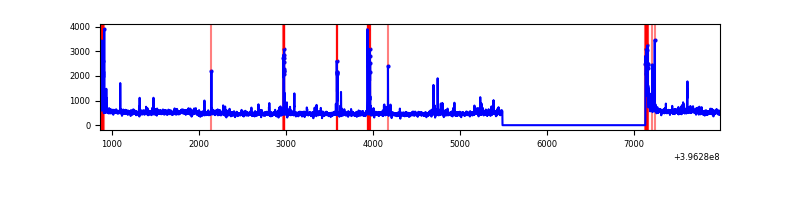 |
| D | 7128 | 5486 | 306 | 306 | 4.29% | 5.58% | 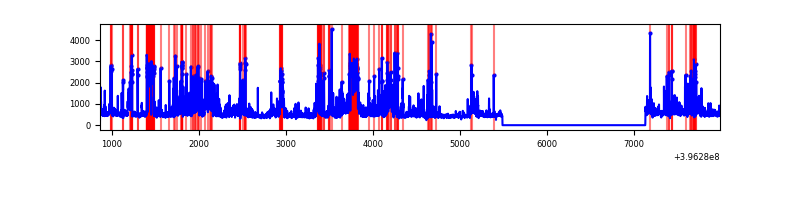 |
Top three noisy pixels from each quadrant. If the there are fewer than three noisy pixels in the level2.evt file, extra rows are filled as -1
| Pixel properties | Quadrant properties | ||||||
|---|---|---|---|---|---|---|---|
| Quadrant | DetID | PixID | Counts | Sigma | Mean | Median | Sigma |
| A | 10 | 83 | 249745 | 1959.03 | 621 | 608 | 127.2 |
| A | 9 | 143 | 31346 | 241.7 | 621 | 608 | 127.2 |
| A | 13 | 248 | 20158 | 153.73 | 621 | 608 | 127.2 |
| B | 12 | 243 | 759586 | 174773.77 | 13 | 13 | 4.3 |
| B | 12 | 144 | 14386 | 3307.15 | 13 | 13 | 4.3 |
| B | 5 | 255 | 2844 | 651.4 | 13 | 13 | 4.3 |
| C | 15 | 214 | 233589 | 1656.99 | 600 | 605 | 140.6 |
| C | 0 | 10 | 181944 | 1289.69 | 600 | 605 | 140.6 |
| C | 0 | 207 | 137886 | 976.35 | 600 | 605 | 140.6 |
| D | 12 | 17 | 496694 | 3434.58 | 589 | 574 | 144.4 |
| D | 12 | 227 | 468090 | 3236.56 | 589 | 574 | 144.4 |
| D | 13 | 249 | 416517 | 2879.53 | 589 | 574 | 144.4 |
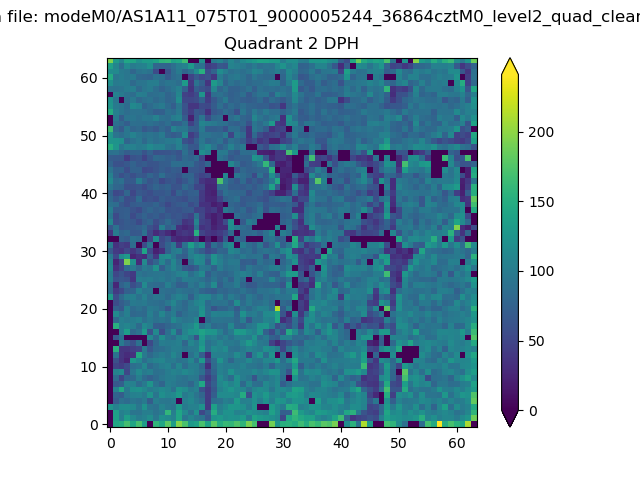
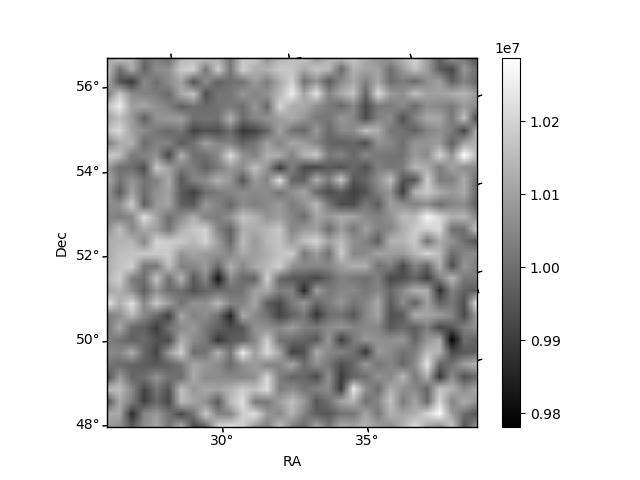
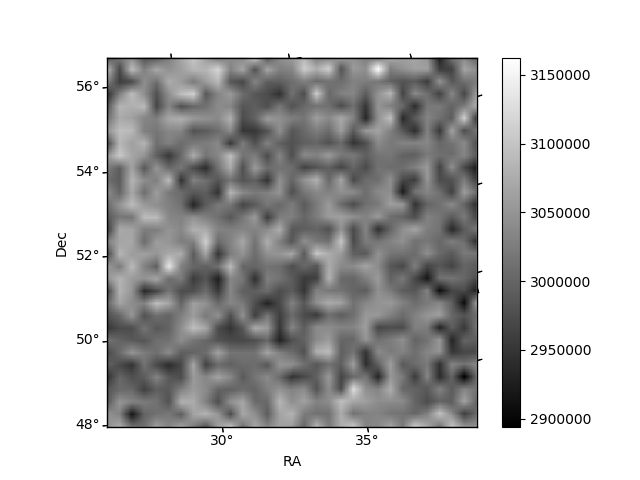
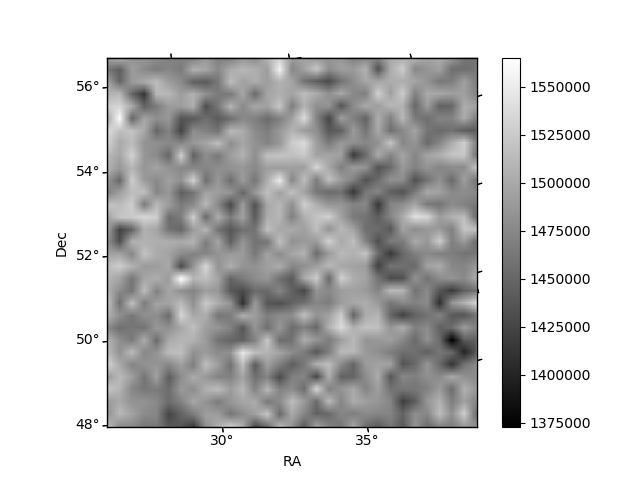
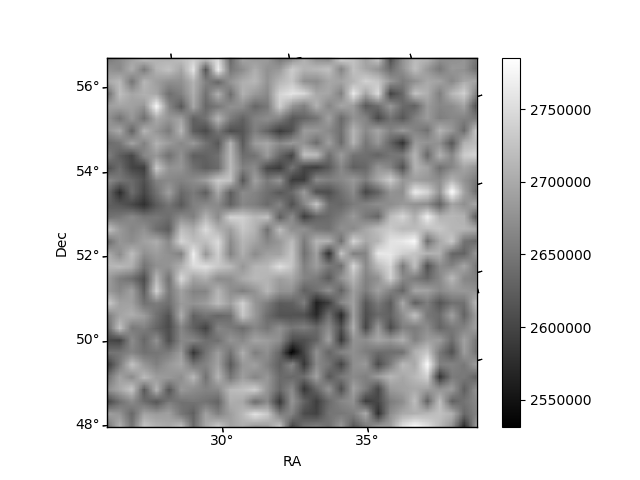
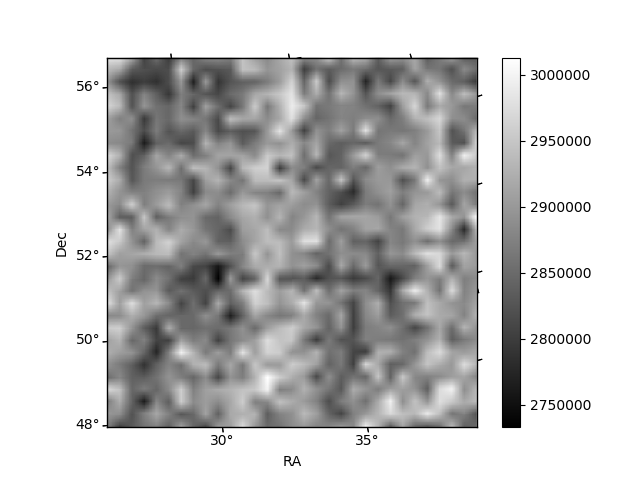
Histogram calculated using DETX and DETY for each event in the final _common_clean file
| Quadrant A | 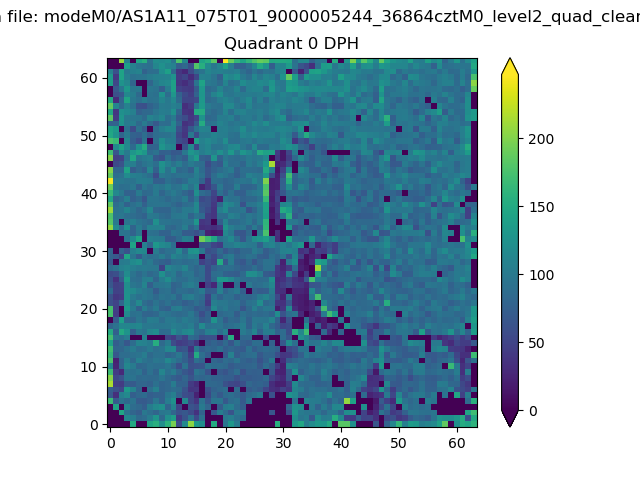 |
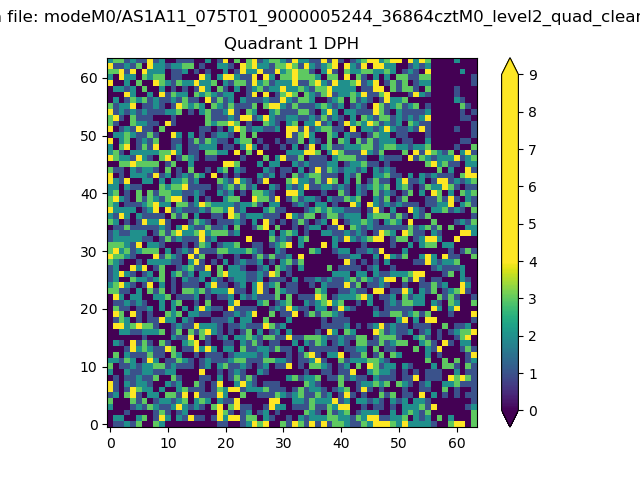 |
Quadrant B |
|---|---|---|---|
| Quadrant D | 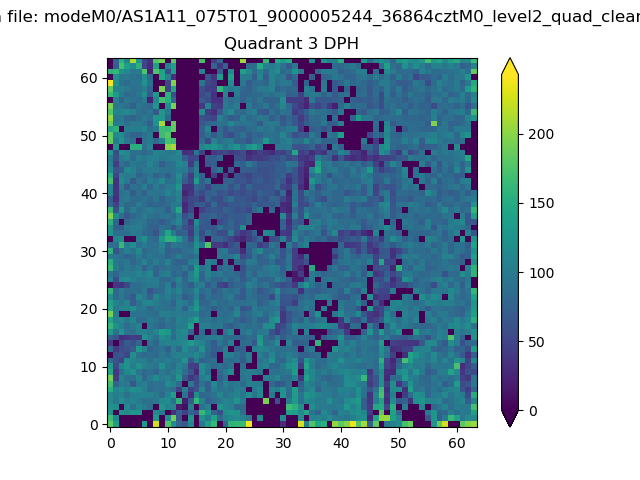 |
 |
Quadrant C |
| Plot type | Count rate plots | Images |
|---|---|---|
| Comparison with Poisson distribution Blue bars denote a histogram of data divided into 1 sec bins. Red curve is a Poisson curve with rate = median count rate of data. |
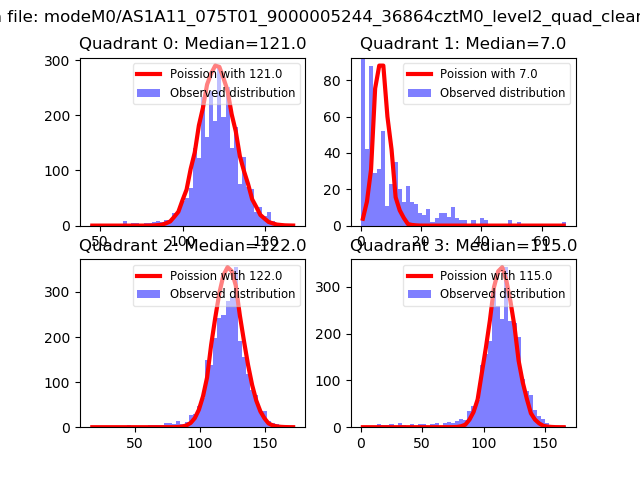 |
 |
| Quadrant-wise count rates Data is divided into 100 sec bins |
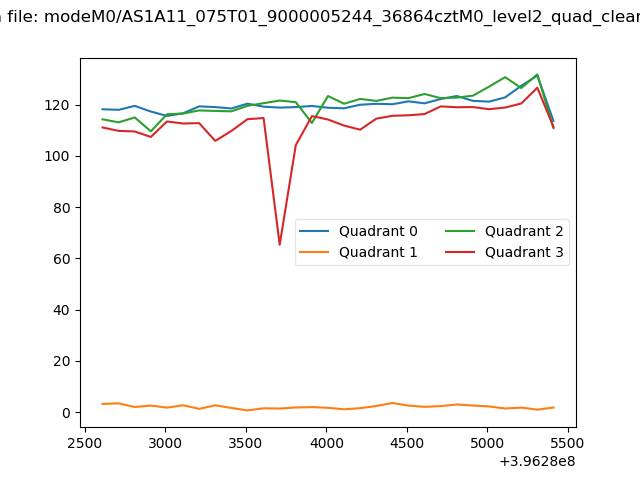 |
|
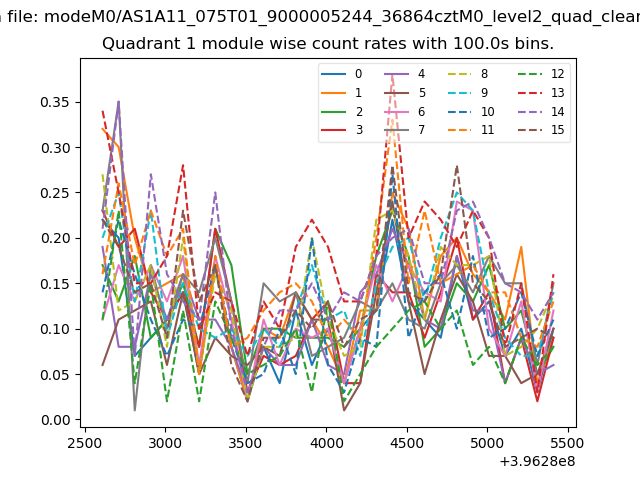
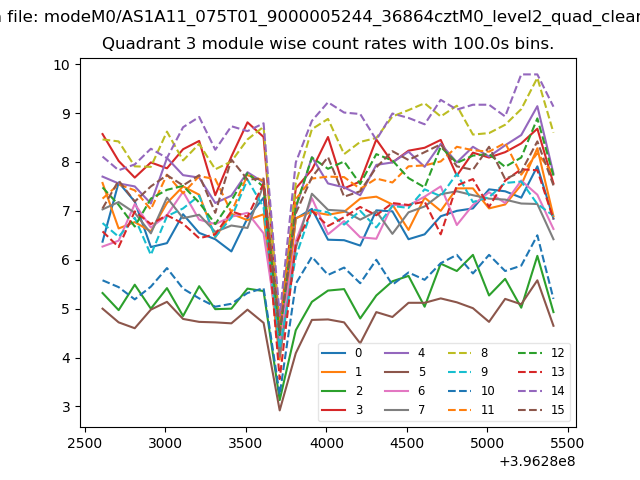
| Module-wise count rates for Quadrant A Data is divided into 100 sec bins |
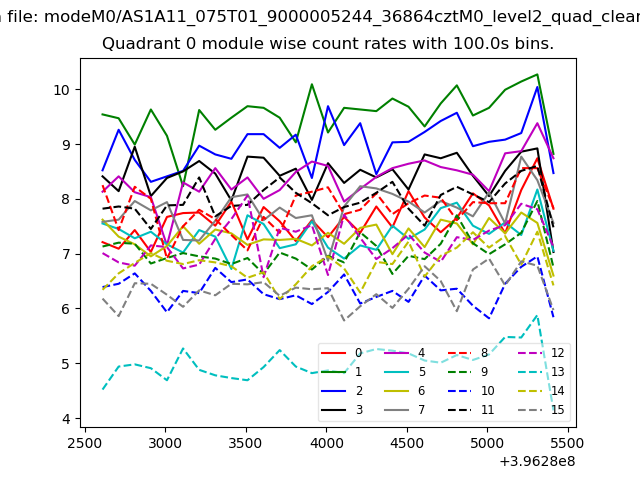 |
 |
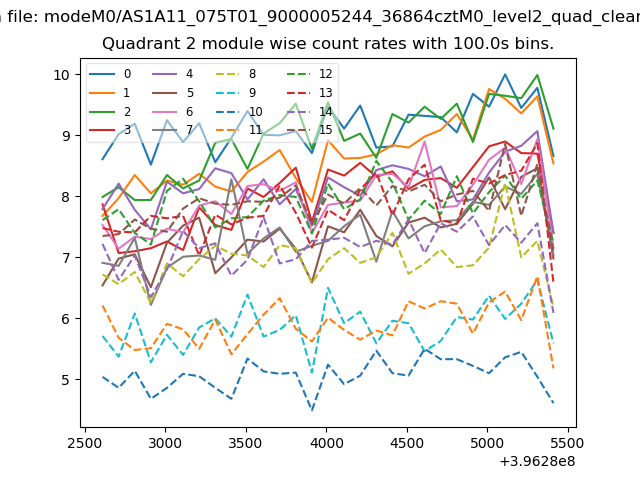
| Module-wise count rates for Quadrant B Data is divided into 100 sec bins |
 |
 |
| Module-wise count rates for Quadrant C Data is divided into 100 sec bins |
 |
 |
| Module-wise count rates for Quadrant D Data is divided into 100 sec bins |
 |
 |
| Parameter | Plot |
|---|---|
| CZT HV Monitor | 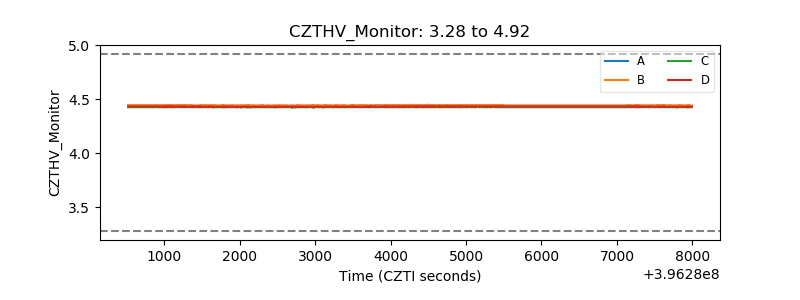 |
| D_VDD | 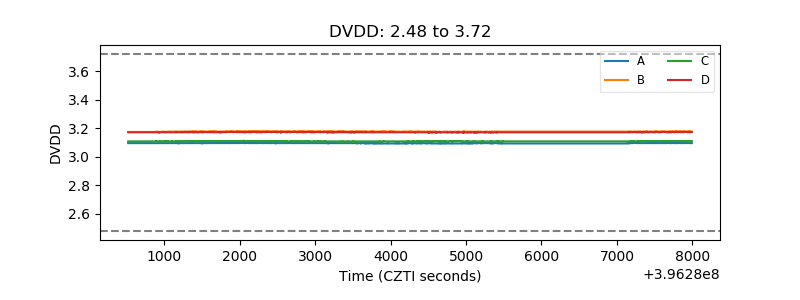 |
| Temperature 1 | 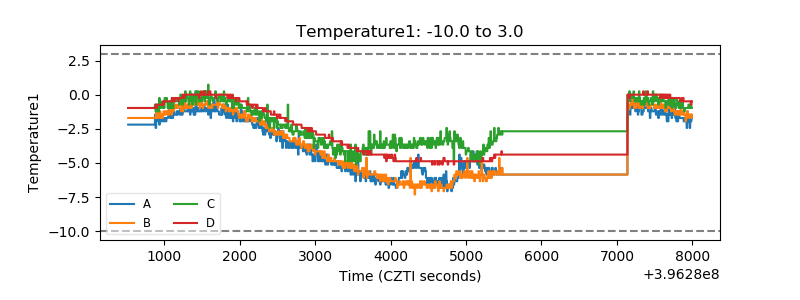 |
| Veto HV Monitor | 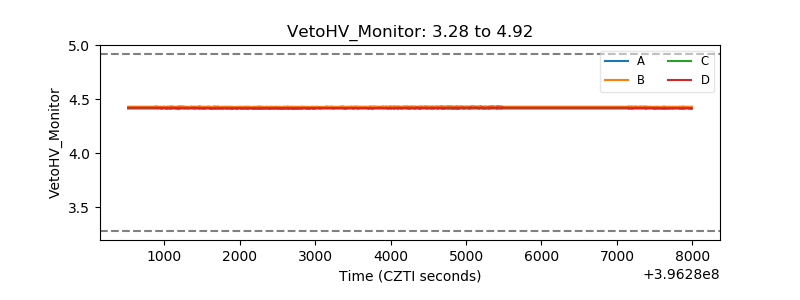 |
| Veto LLD | 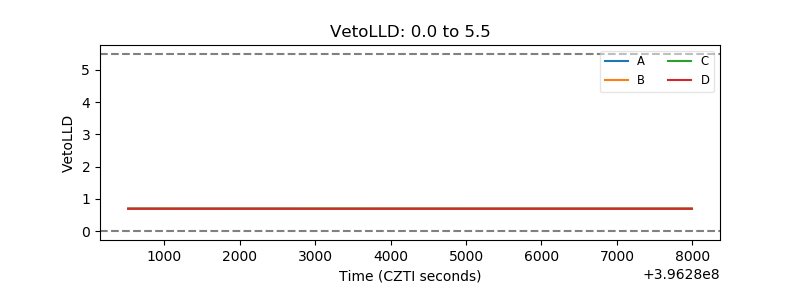 |
| Alpha Counter | 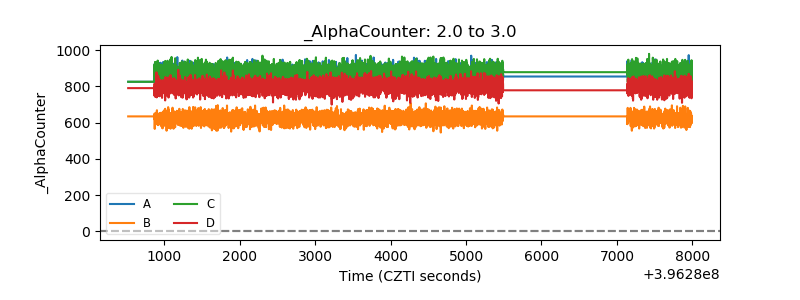 |
| _CPM_Rate | 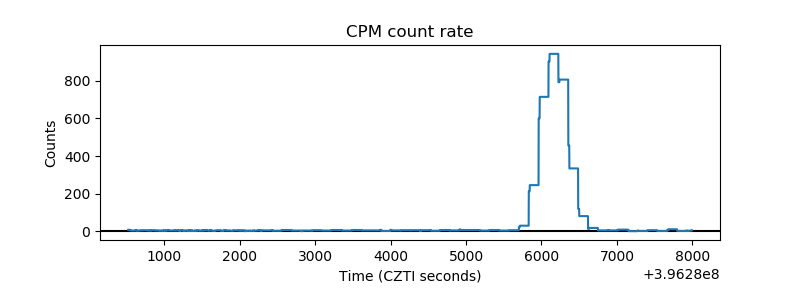 |
| CZT Counter | 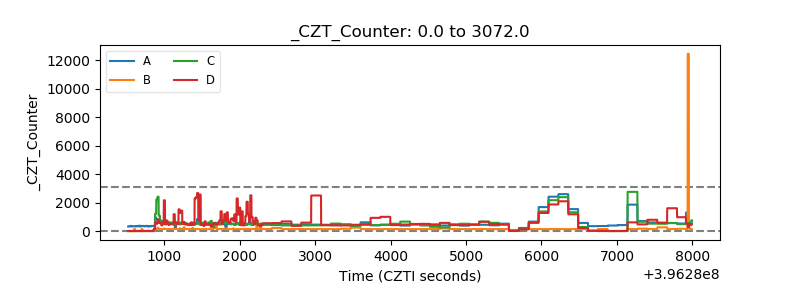 |
| +2.5 Volts monitor |  |
| +5 Volts monitor |  |
| _ROLL_ROT | 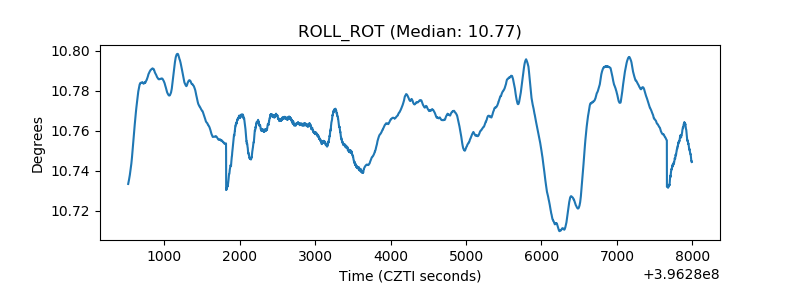 |
| _Roll_DEC | 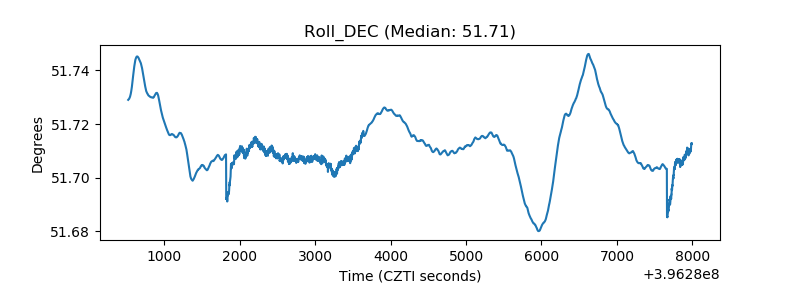 |
| _Roll_RA | 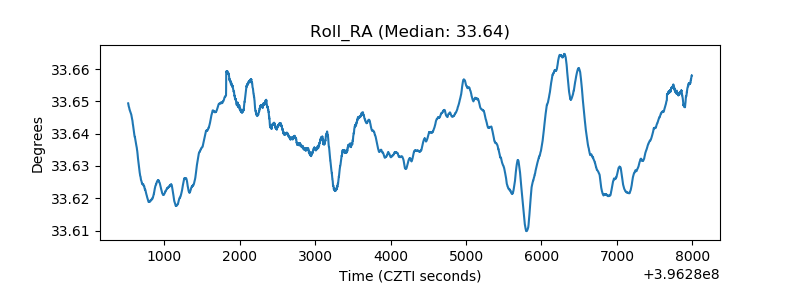 |
| Veto Counter | 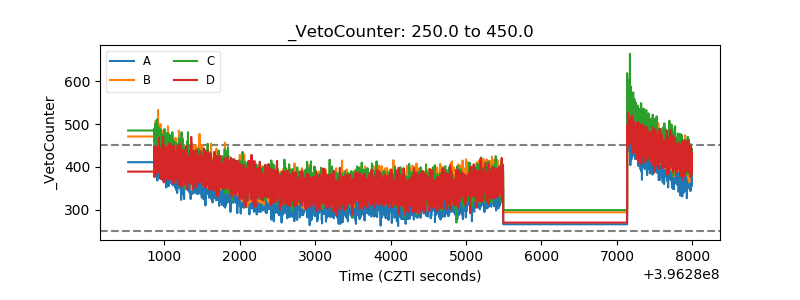 |