| Param | Original file | Final file |
|---|---|---|
| Filename | modeM0/AS1A11_075T01_9000005244_36866cztM0_level2.evt | modeM0/AS1A11_075T01_9000005244_36866cztM0_level2_quad_clean.evt |
| Size (bytes) | 348,580,800 | 50,319,360 |
| Size | 332.4 MB | 48.0 MB |
| Events in quadrant A | 2,725,844 | 387,876 |
| Events in quadrant B | 812,533 | 7,196 |
| Events in quadrant C | 3,317,219 | 383,873 |
| Events in quadrant D | 3,335,971 | 372,709 |
| Mode SS | |||
|---|---|---|---|
| Quadrant | BADHDUFLAG | Total packets | Discarded packets |
| A | 0 | 108 | 0 |
| B | 0 | 108 | 0 |
| C | 0 | 108 | 0 |
| D | 0 | 108 | 0 |
| Mode M0 | |||
|---|---|---|---|
| Quadrant | BADHDUFLAG | Total packets | Discarded packets |
| A | 0 | 11606 | 3 |
| B | 0 | 5380 | 2 |
| C | 0 | 13121 | 2 |
| D | 0 | 13566 | 2 |
| Mode M9 | |||
|---|---|---|---|
| Quadrant | BADHDUFLAG | Total packets | Discarded packets |
| A | 0 | 26 | 0 |
| B | 0 | 26 | 0 |
| C | 0 | 26 | 0 |
| D | 0 | 27 | 0 |
| Quadrant | Total seconds | Saturated seconds | Saturation percentage |
|---|---|---|---|
| A | 5283 | 26 | 0.492145% |
| B | 5283 | 5283 | 100.000000% |
| C | 5283 | 182 | 3.445012% |
| D | 5283 | 150 | 2.839296% |
Noise dominated data is calculated using 1-second bins in cleaned event files. If a bin has >2000 counts, and if more than 50% of those come from <1% of pixels, then it is considered to be noise-dominated and hence unusable.
| Quadrant | # 1 sec bins | Bins with >0 counts | Bins with >2000 counts | High rate bins dominated by noise | Noise dominated (total time) | Noise dominated (detector-on time) | Marked lightcurve |
|---|---|---|---|---|---|---|---|
| A | 7046 | 5284 | 14 | 14 | 0.20% | 0.26% | 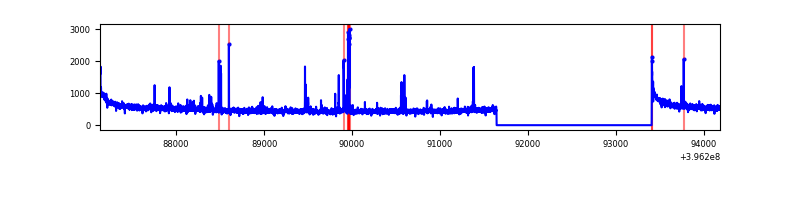 |
| B | 7045 | 5282 | 0 | 0 | 0.00% | 0.00% | 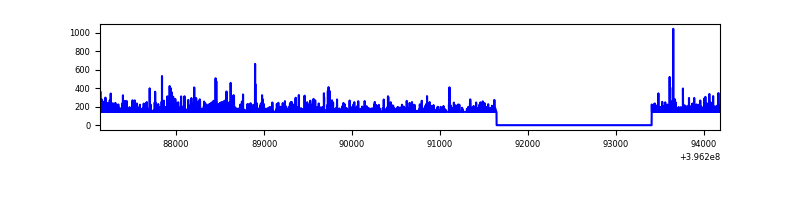 |
| C | 7046 | 5284 | 157 | 157 | 2.23% | 2.97% | 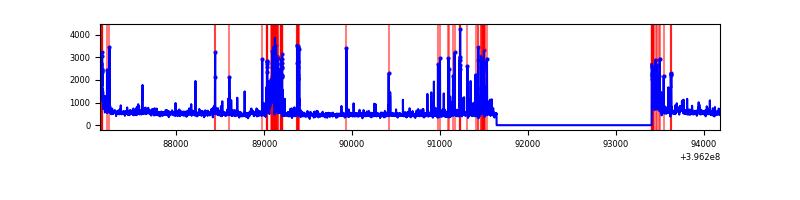 |
| D | 7046 | 5284 | 115 | 115 | 1.63% | 2.18% | 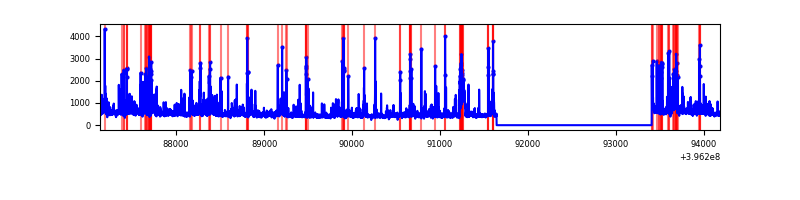 |
Top three noisy pixels from each quadrant. If the there are fewer than three noisy pixels in the level2.evt file, extra rows are filled as -1
| Pixel properties | Quadrant properties | ||||||
|---|---|---|---|---|---|---|---|
| Quadrant | DetID | PixID | Counts | Sigma | Mean | Median | Sigma |
| A | 10 | 83 | 244951 | 1986.94 | 607 | 594 | 123.0 |
| A | 9 | 143 | 70329 | 567.04 | 607 | 594 | 123.0 |
| A | 13 | 248 | 21712 | 171.72 | 607 | 594 | 123.0 |
| B | 12 | 243 | 731931 | 166997.89 | 13 | 12 | 4.4 |
| B | 12 | 144 | 13768 | 3138.63 | 13 | 12 | 4.4 |
| B | 0 | 213 | 2602 | 590.95 | 13 | 12 | 4.4 |
| C | 0 | 10 | 355051 | 2612.25 | 587 | 592 | 135.7 |
| C | 0 | 207 | 317874 | 2338.26 | 587 | 592 | 135.7 |
| C | 15 | 214 | 223626 | 1643.69 | 587 | 592 | 135.7 |
| D | 13 | 249 | 410985 | 2863.79 | 589 | 573 | 143.3 |
| D | 2 | 249 | 198759 | 1382.91 | 589 | 573 | 143.3 |
| D | 12 | 218 | 74392 | 515.1 | 589 | 573 | 143.3 |
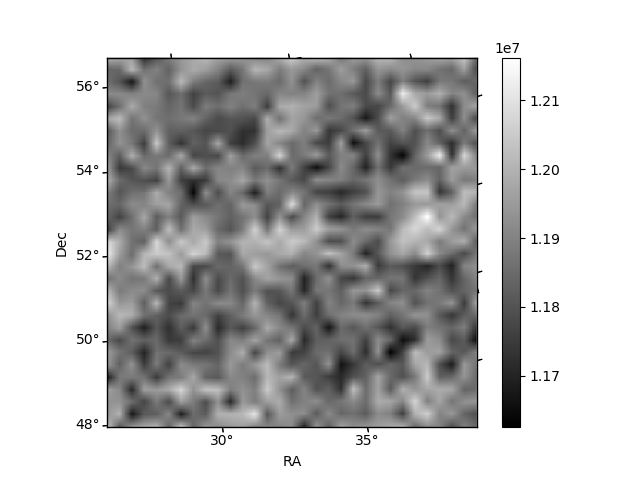
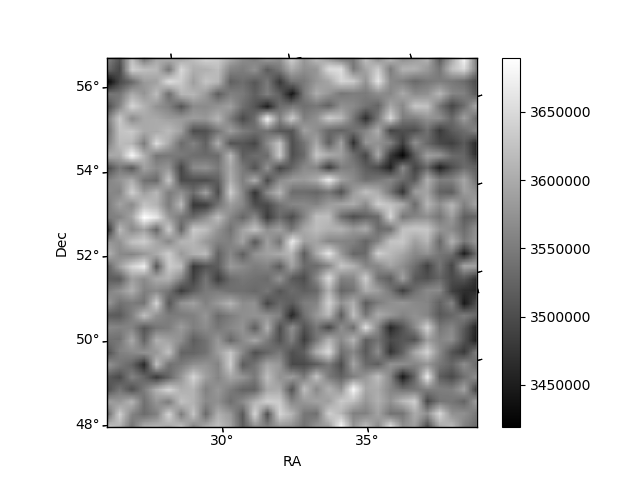
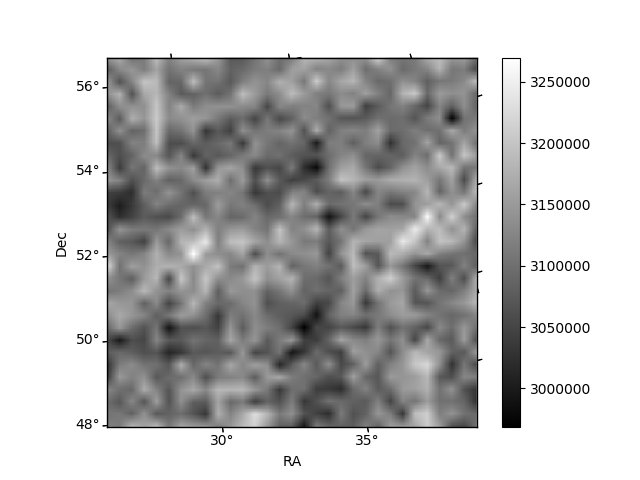
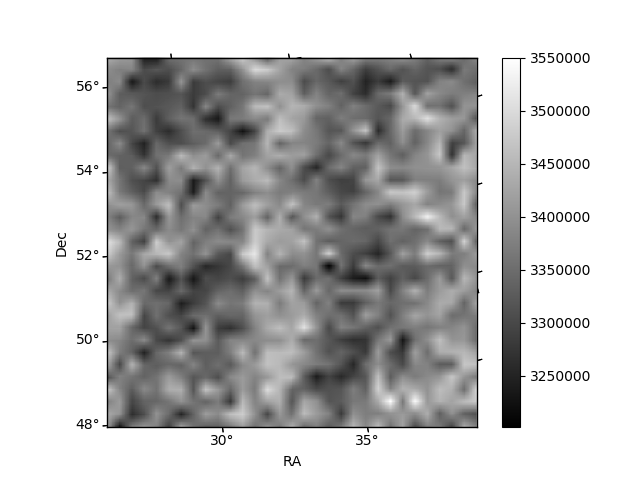
Histogram calculated using DETX and DETY for each event in the final _common_clean file
| Quadrant A | 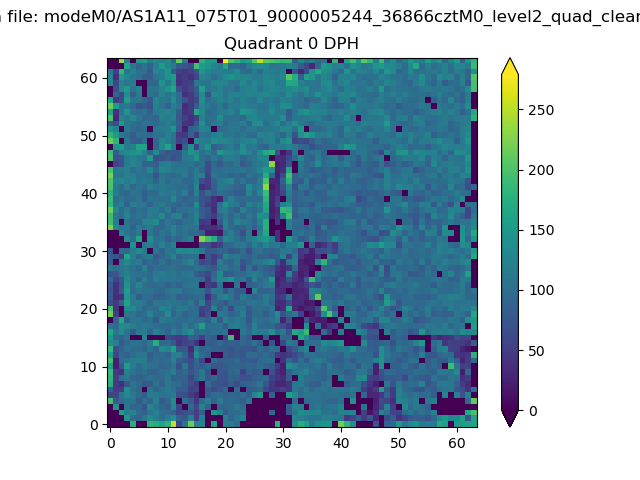 |
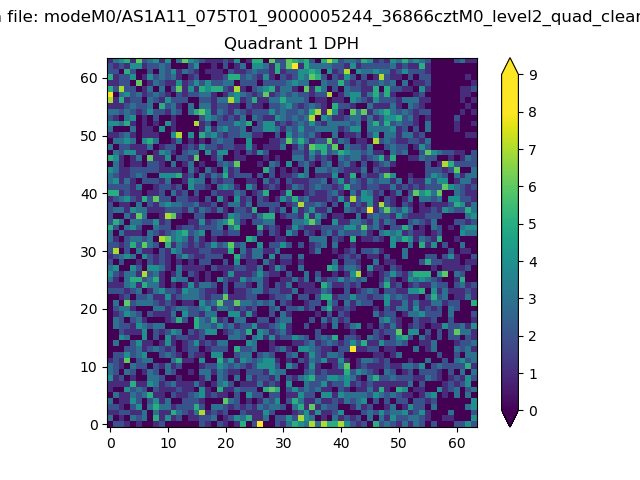 |
Quadrant B |
|---|---|---|---|
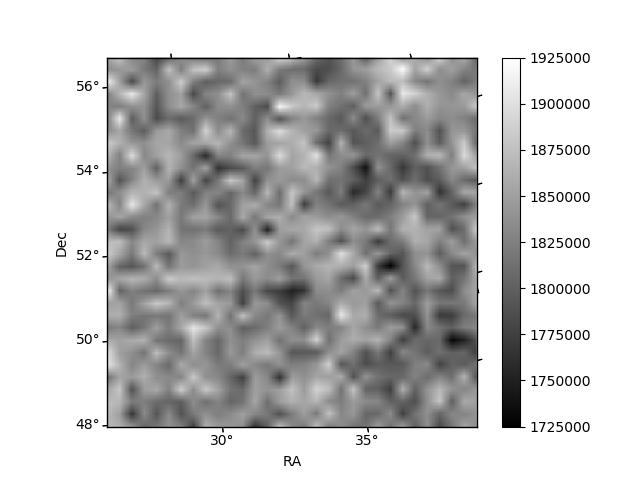
| Quadrant D | 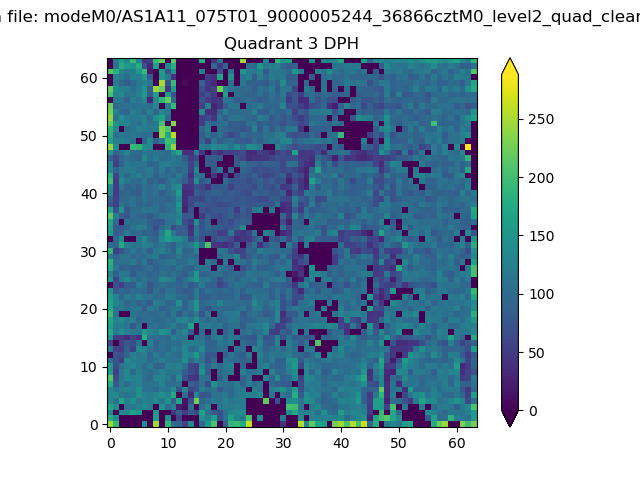 |
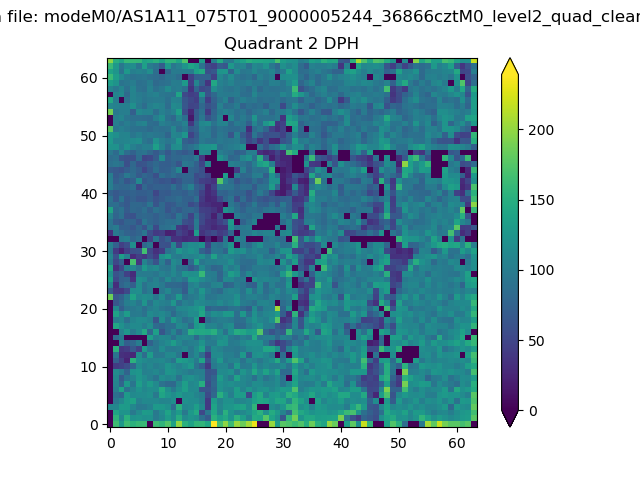 |
Quadrant C |
| Plot type | Count rate plots | Images |
|---|---|---|
| Comparison with Poisson distribution Blue bars denote a histogram of data divided into 1 sec bins. Red curve is a Poisson curve with rate = median count rate of data. |
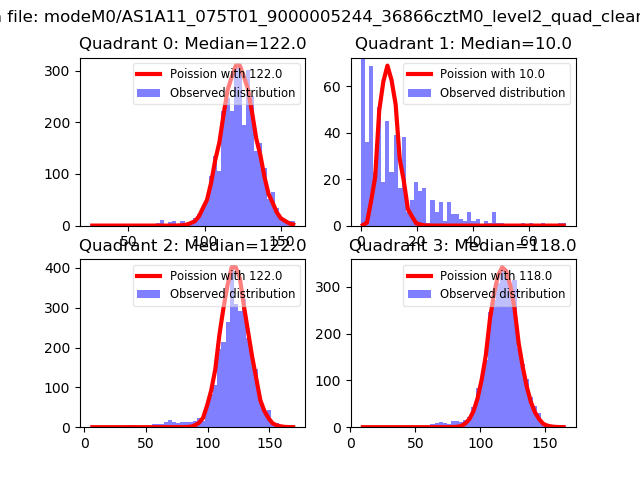 |
 |
| Quadrant-wise count rates Data is divided into 100 sec bins |
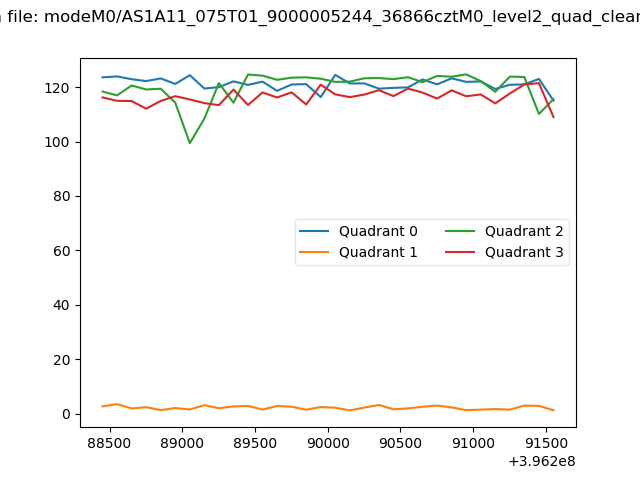 |
|
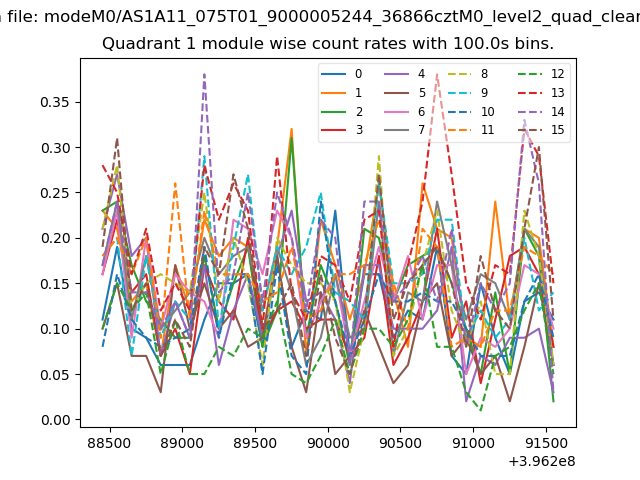
| Module-wise count rates for Quadrant A Data is divided into 100 sec bins |
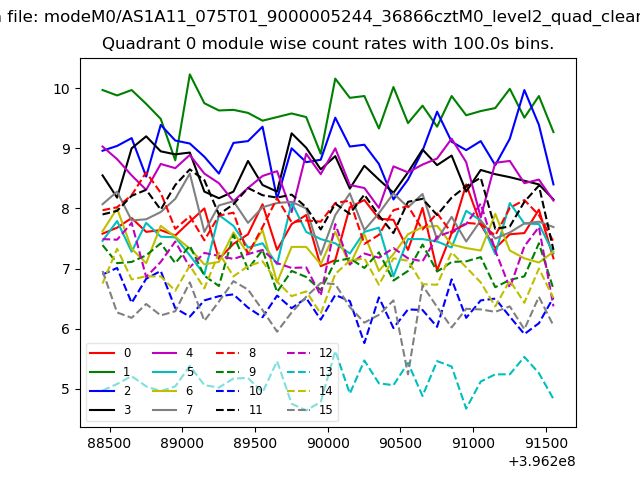 |
 |
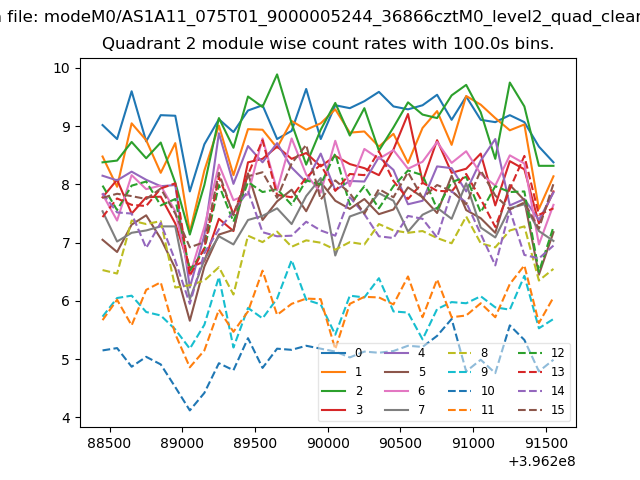
| Module-wise count rates for Quadrant B Data is divided into 100 sec bins |
 |
 |
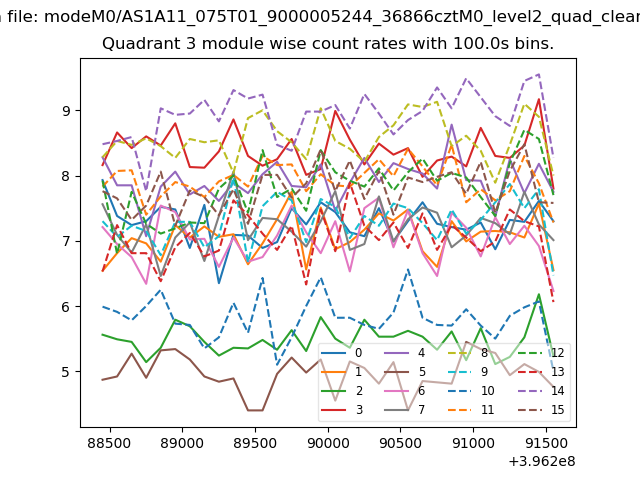
| Module-wise count rates for Quadrant C Data is divided into 100 sec bins |
 |
 |
| Module-wise count rates for Quadrant D Data is divided into 100 sec bins |
 |
 |
| Parameter | Plot |
|---|---|
| CZT HV Monitor | 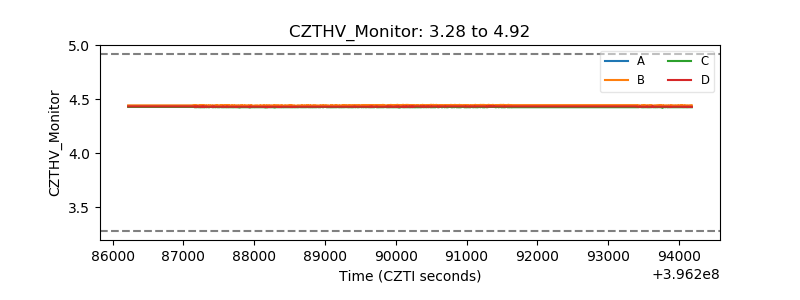 |
| D_VDD | 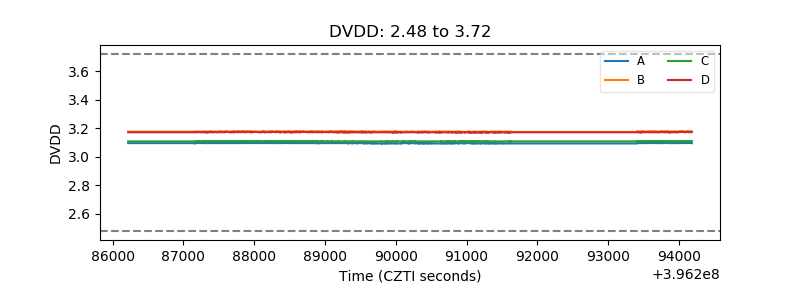 |
| Temperature 1 | 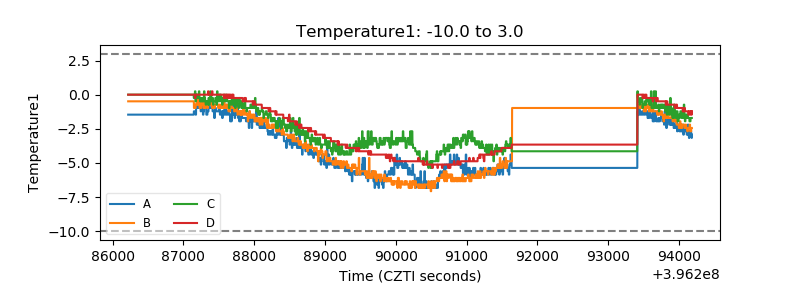 |
| Veto HV Monitor | 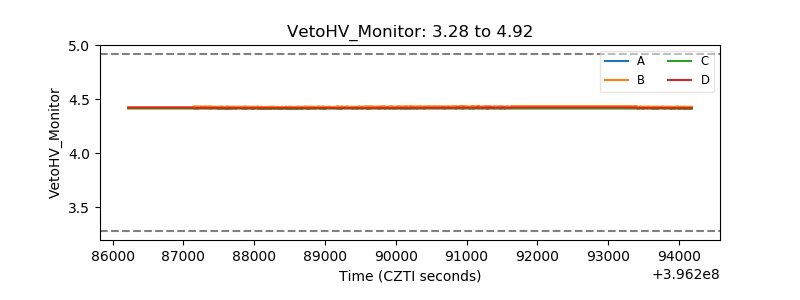 |
| Veto LLD | 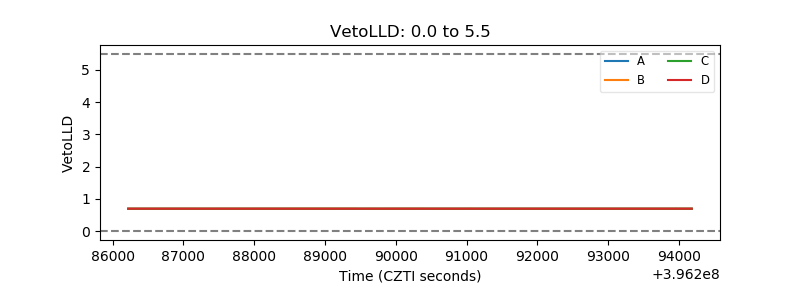 |
| Alpha Counter | 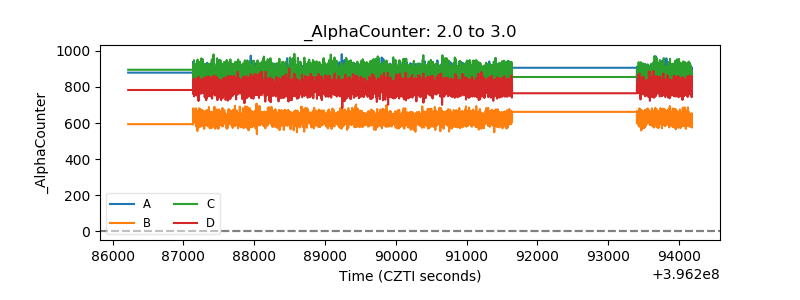 |
| _CPM_Rate | 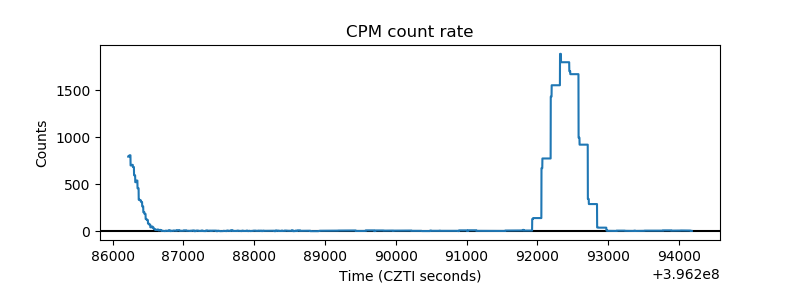 |
| CZT Counter | 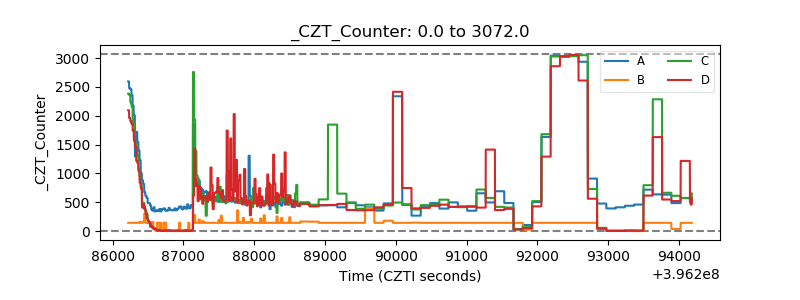 |
| +2.5 Volts monitor |  |
| +5 Volts monitor | 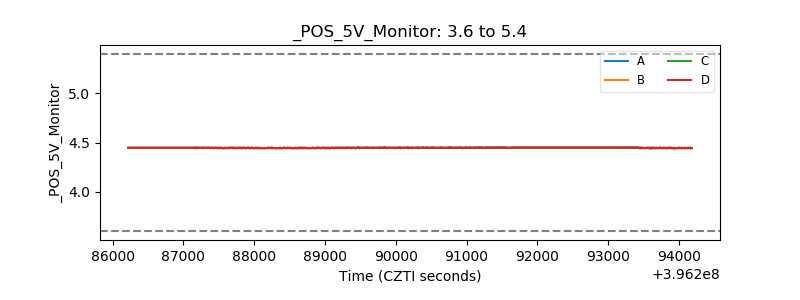 |
| _ROLL_ROT | 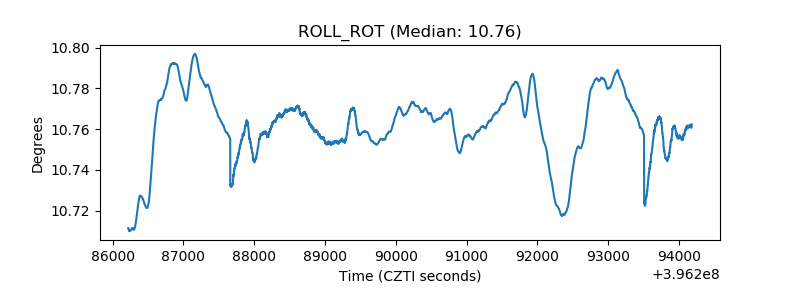 |
| _Roll_DEC | 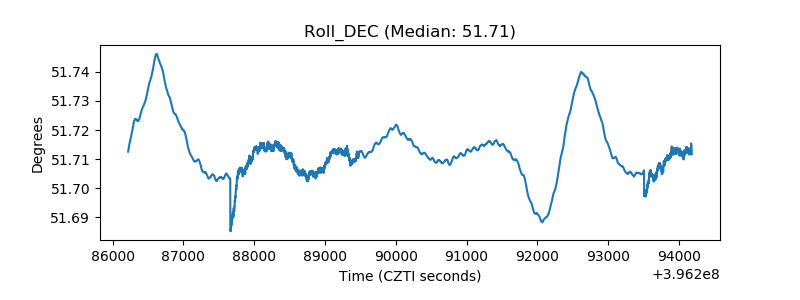 |
| _Roll_RA | 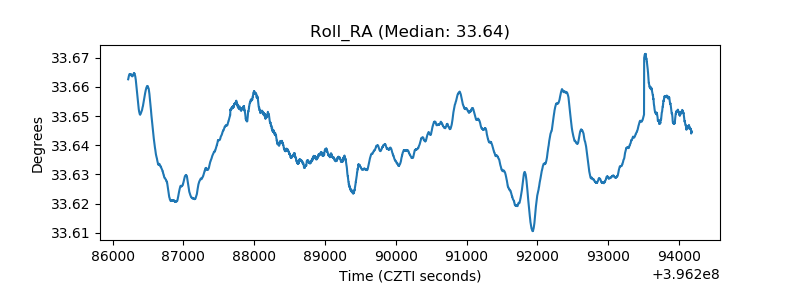 |
| Veto Counter | 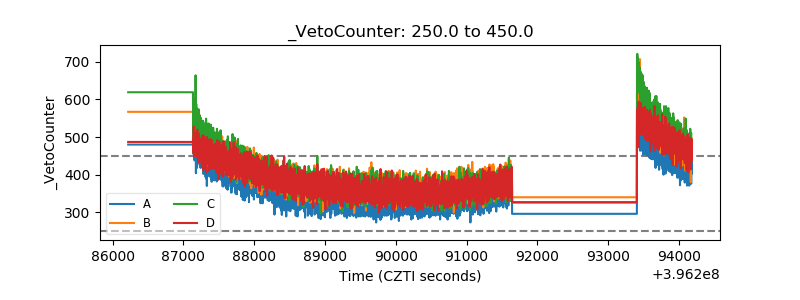 |