| Param | Original file | Final file |
|---|---|---|
| Filename | modeM0/AS1A11_075T01_9000005244_36867cztM0_level2.evt | modeM0/AS1A11_075T01_9000005244_36867cztM0_level2_quad_clean.evt |
| Size (bytes) | 350,616,960 | 59,129,280 |
| Size | 334.4 MB | 56.4 MB |
| Events in quadrant A | 2,608,452 | 483,497 |
| Events in quadrant B | 774,402 | 7,423 |
| Events in quadrant C | 3,162,762 | 489,656 |
| Events in quadrant D | 3,721,556 | 451,061 |
| Mode SS | |||
|---|---|---|---|
| Quadrant | BADHDUFLAG | Total packets | Discarded packets |
| A | 0 | 104 | 0 |
| B | 0 | 104 | 0 |
| C | 0 | 104 | 0 |
| D | 0 | 104 | 0 |
| Mode M0 | |||
|---|---|---|---|
| Quadrant | BADHDUFLAG | Total packets | Discarded packets |
| A | 0 | 11141 | 3 |
| B | 0 | 5169 | 2 |
| C | 0 | 12655 | 2 |
| D | 0 | 14511 | 2 |
| Mode M9 | |||
|---|---|---|---|
| Quadrant | BADHDUFLAG | Total packets | Discarded packets |
| A | 0 | 33 | 0 |
| B | 0 | 33 | 0 |
| C | 0 | 33 | 0 |
| D | 0 | 34 | 0 |
| Quadrant | Total seconds | Saturated seconds | Saturation percentage |
|---|---|---|---|
| A | 5087 | 18 | 0.353843% |
| B | 5087 | 5087 | 100.000000% |
| C | 5087 | 129 | 2.535876% |
| D | 5087 | 276 | 5.425595% |
Noise dominated data is calculated using 1-second bins in cleaned event files. If a bin has >2000 counts, and if more than 50% of those come from <1% of pixels, then it is considered to be noise-dominated and hence unusable.
| Quadrant | # 1 sec bins | Bins with >0 counts | Bins with >2000 counts | High rate bins dominated by noise | Noise dominated (total time) | Noise dominated (detector-on time) | Marked lightcurve |
|---|---|---|---|---|---|---|---|
| A | 6999 | 5088 | 9 | 9 | 0.13% | 0.18% | 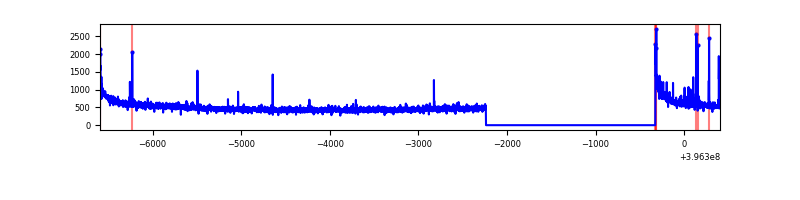 |
| B | 6998 | 5086 | 0 | 0 | 0.00% | 0.00% | 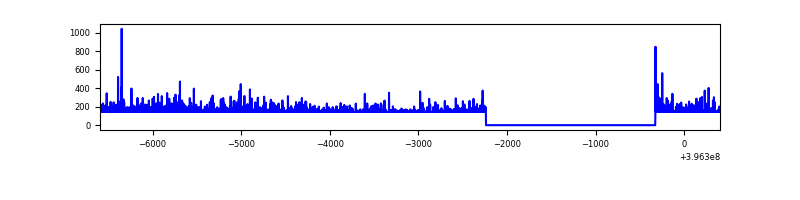 |
| C | 6999 | 5088 | 104 | 104 | 1.49% | 2.04% | 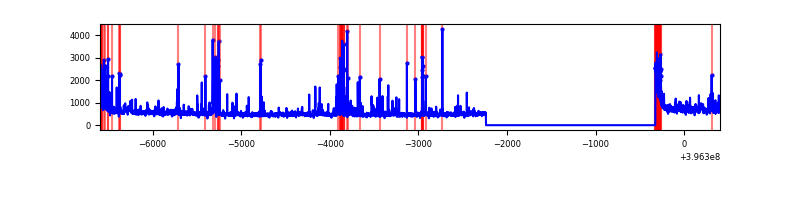 |
| D | 6999 | 5088 | 265 | 265 | 3.79% | 5.21% | 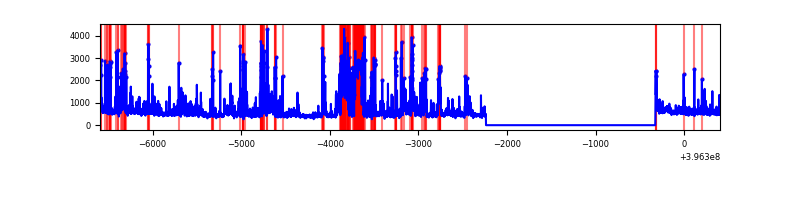 |
Top three noisy pixels from each quadrant. If the there are fewer than three noisy pixels in the level2.evt file, extra rows are filled as -1
| Pixel properties | Quadrant properties | ||||||
|---|---|---|---|---|---|---|---|
| Quadrant | DetID | PixID | Counts | Sigma | Mean | Median | Sigma |
| A | 10 | 83 | 235894 | 1939.67 | 597 | 587 | 121.3 |
| A | 9 | 143 | 29276 | 236.49 | 597 | 587 | 121.3 |
| A | 13 | 248 | 22270 | 178.74 | 597 | 587 | 121.3 |
| B | 12 | 243 | 705872 | 180569.3 | 11 | 11 | 3.9 |
| B | 12 | 144 | 13241 | 3384.42 | 11 | 11 | 3.9 |
| B | 5 | 255 | 1922 | 488.86 | 11 | 11 | 3.9 |
| C | 0 | 10 | 221916 | 1635.61 | 588 | 594 | 135.3 |
| C | 15 | 214 | 217564 | 1603.44 | 588 | 594 | 135.3 |
| C | 0 | 207 | 215144 | 1585.56 | 588 | 594 | 135.3 |
| D | 13 | 249 | 716118 | 5116.85 | 576 | 562 | 139.8 |
| D | 12 | 17 | 224749 | 1603.13 | 576 | 562 | 139.8 |
| D | 2 | 249 | 178918 | 1275.4 | 576 | 562 | 139.8 |
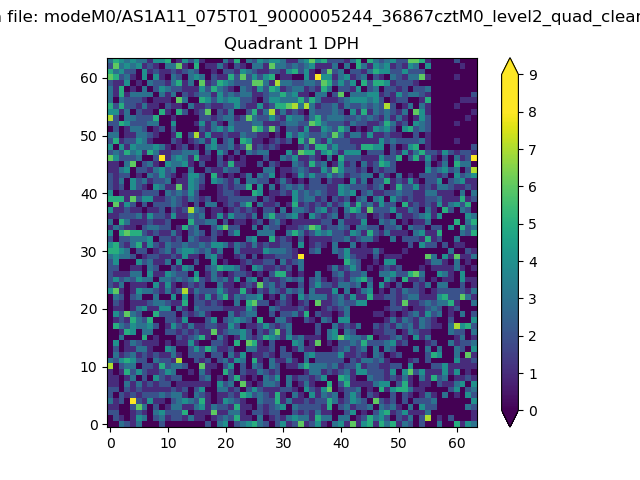
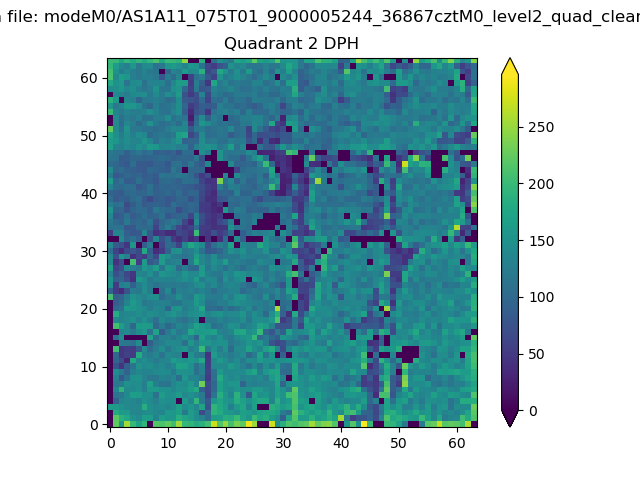
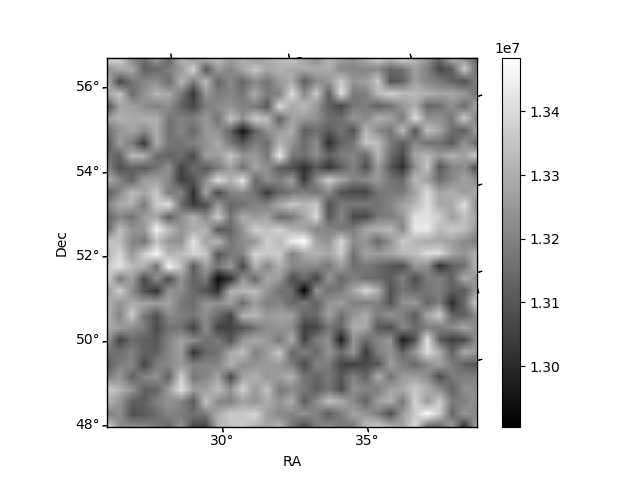
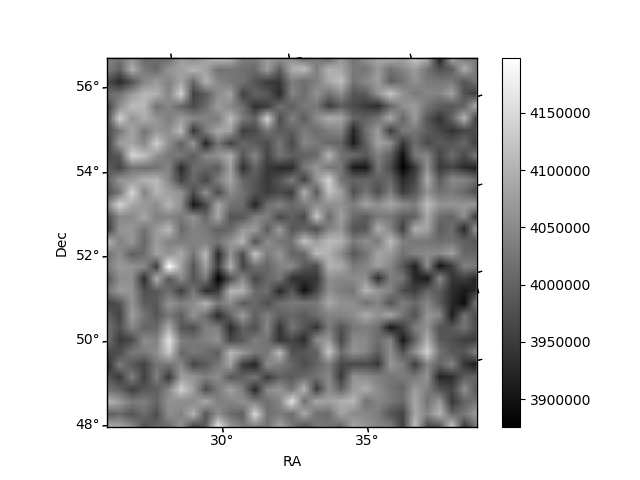
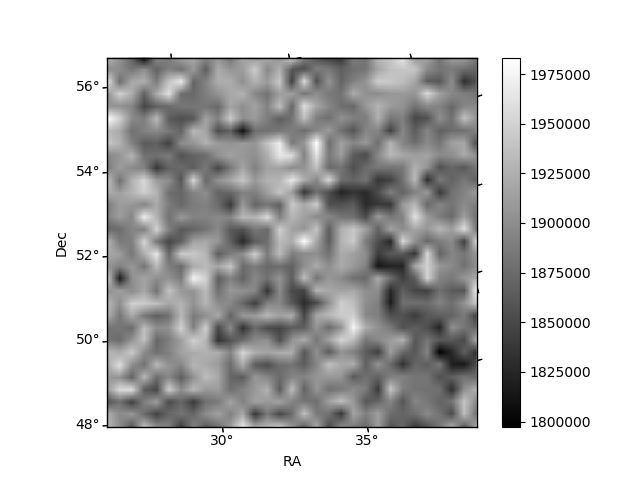
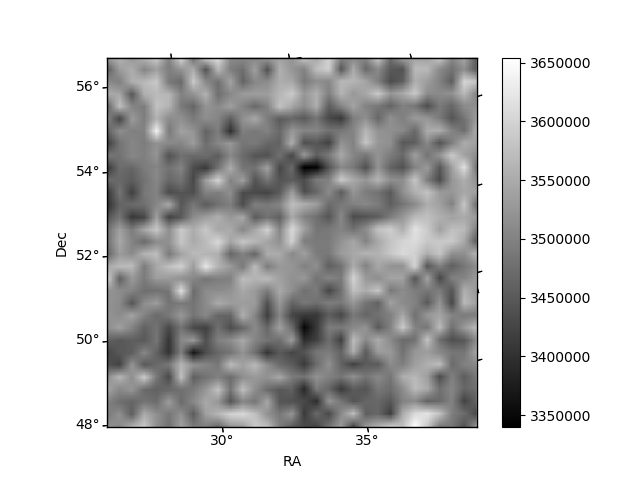
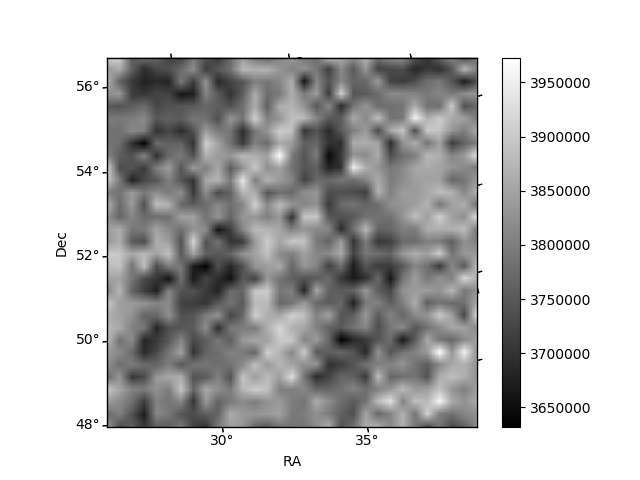
Histogram calculated using DETX and DETY for each event in the final _common_clean file
| Quadrant A |  |
 |
Quadrant B |
|---|---|---|---|
| Quadrant D | 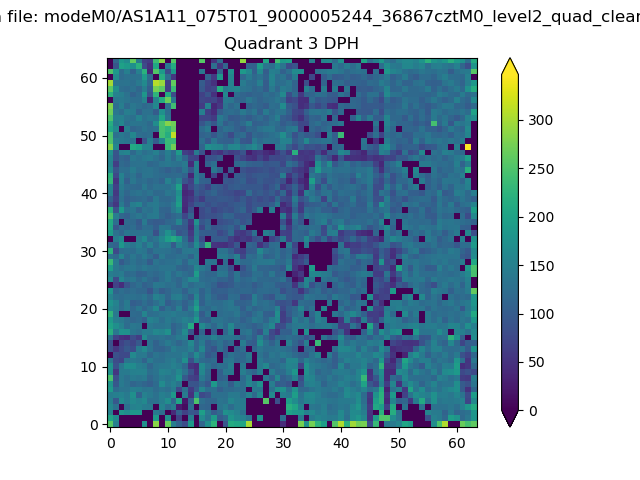 |
 |
Quadrant C |
| Plot type | Count rate plots | Images |
|---|---|---|
| Comparison with Poisson distribution Blue bars denote a histogram of data divided into 1 sec bins. Red curve is a Poisson curve with rate = median count rate of data. |
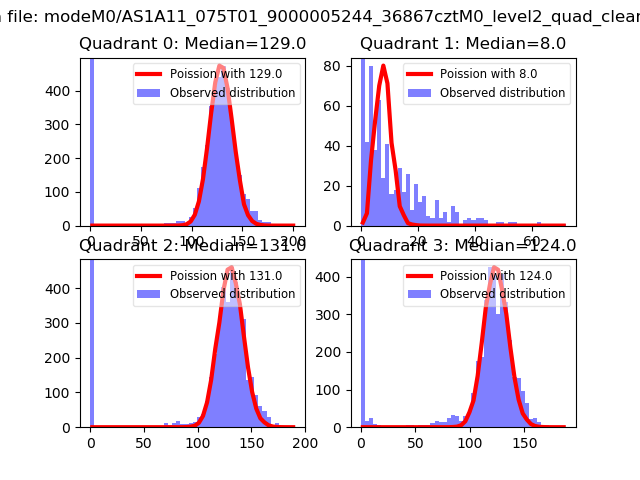 |
 |
| Quadrant-wise count rates Data is divided into 100 sec bins |
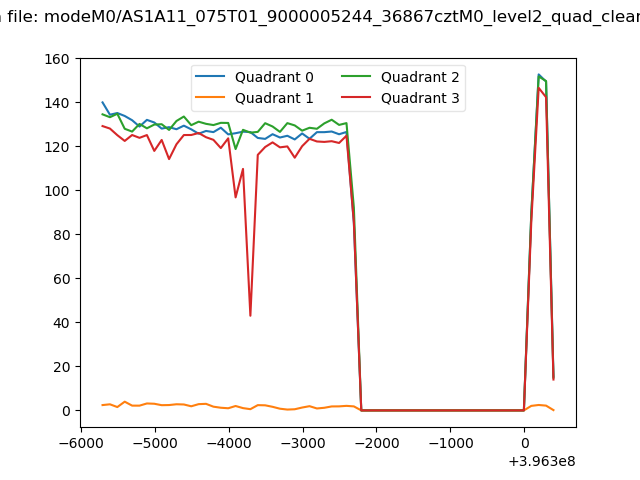 |
|
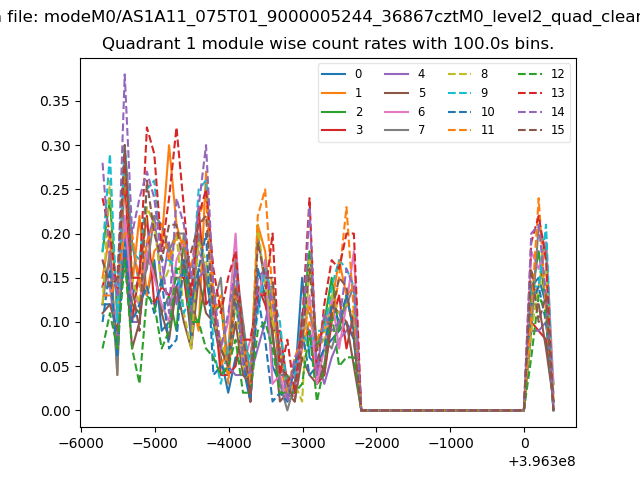
| Module-wise count rates for Quadrant A Data is divided into 100 sec bins |
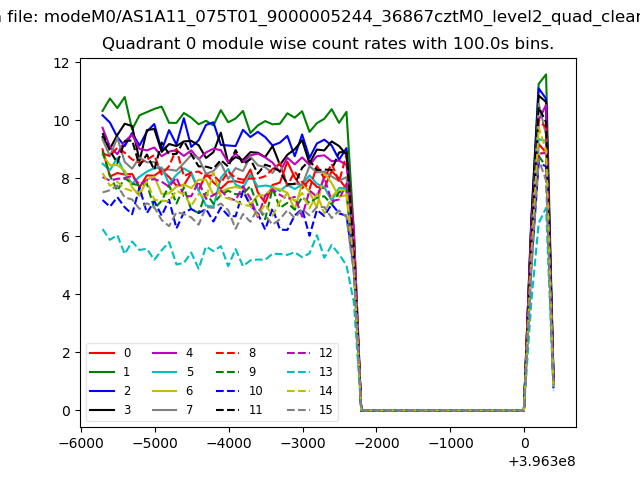 |
 |
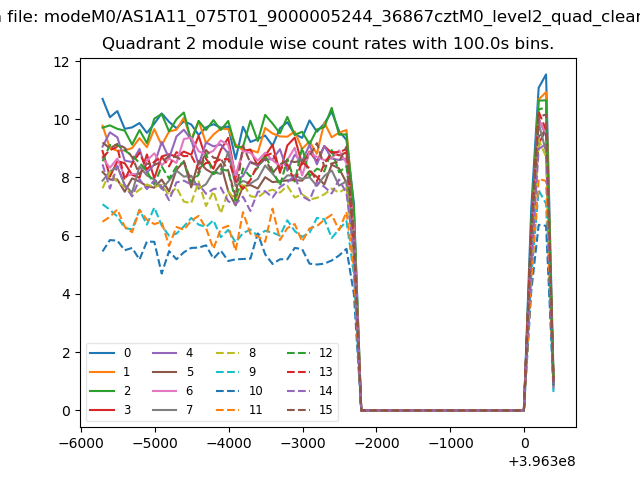
| Module-wise count rates for Quadrant B Data is divided into 100 sec bins |
 |
 |
| Module-wise count rates for Quadrant C Data is divided into 100 sec bins |
 |
 |
| Module-wise count rates for Quadrant D Data is divided into 100 sec bins |
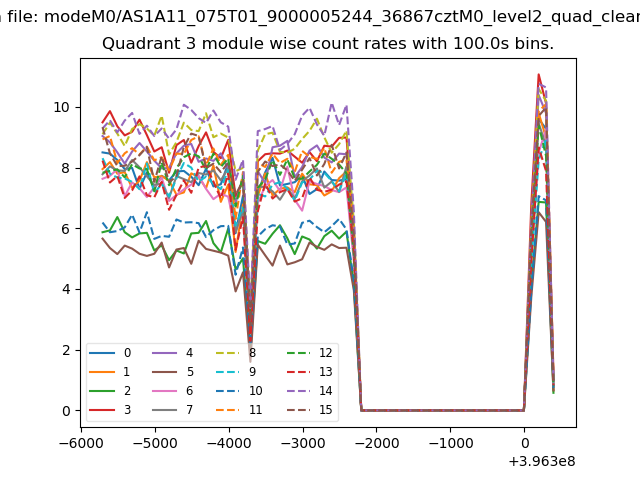 |
 |
| Parameter | Plot |
|---|---|
| CZT HV Monitor | 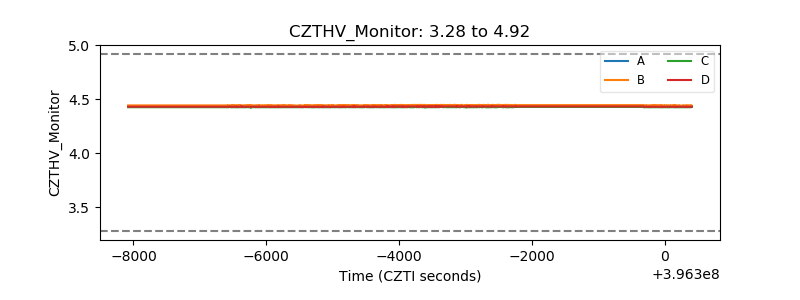 |
| D_VDD | 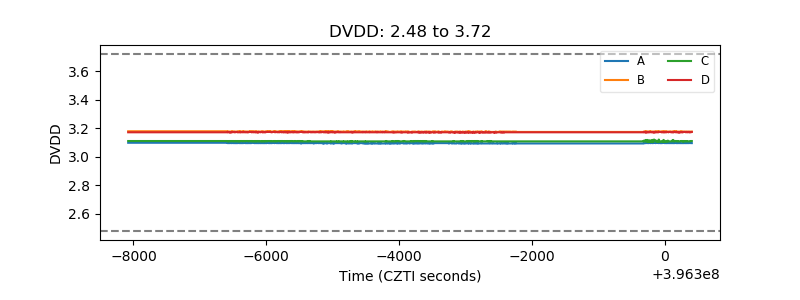 |
| Temperature 1 | 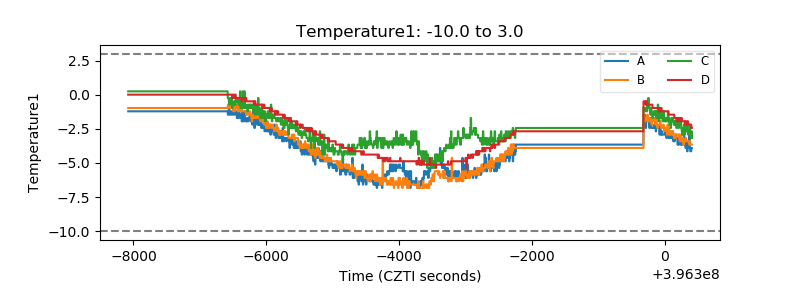 |
| Veto HV Monitor | 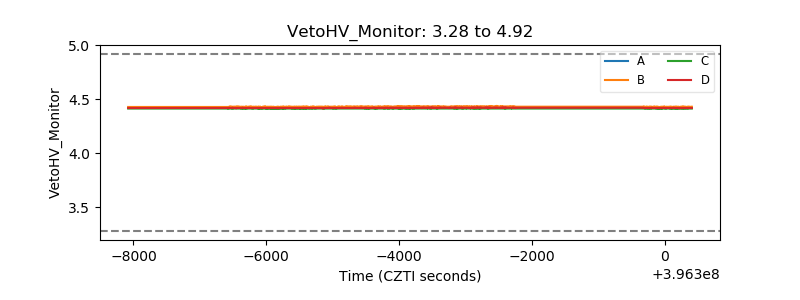 |
| Veto LLD | 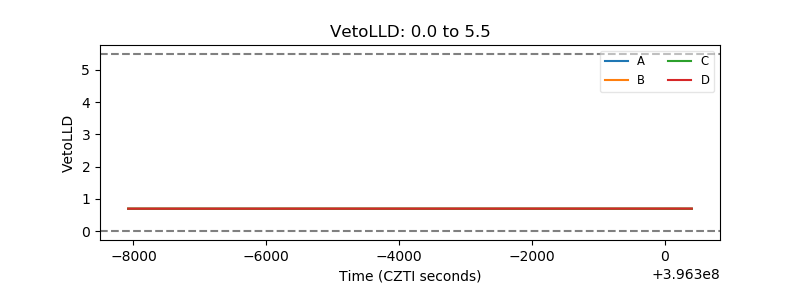 |
| Alpha Counter | 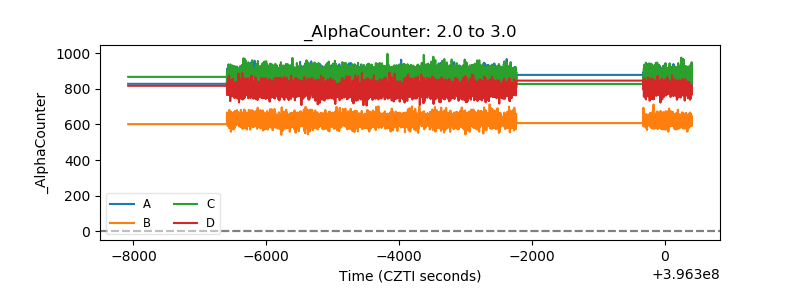 |
| _CPM_Rate |  |
| CZT Counter | 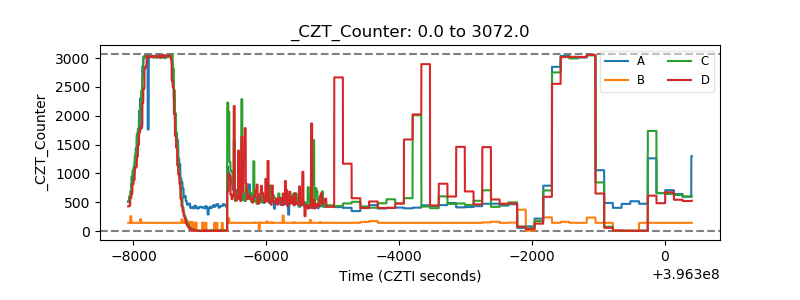 |
| +2.5 Volts monitor |  |
| +5 Volts monitor | 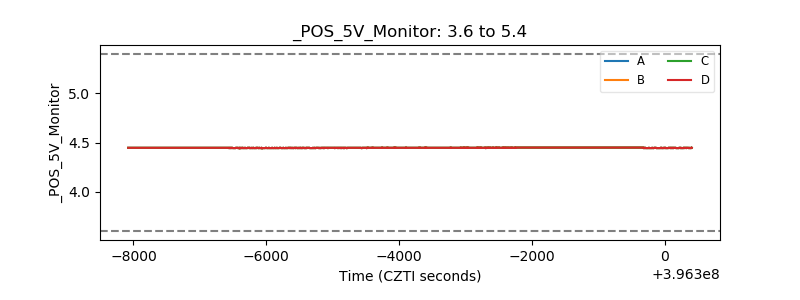 |
| _ROLL_ROT | 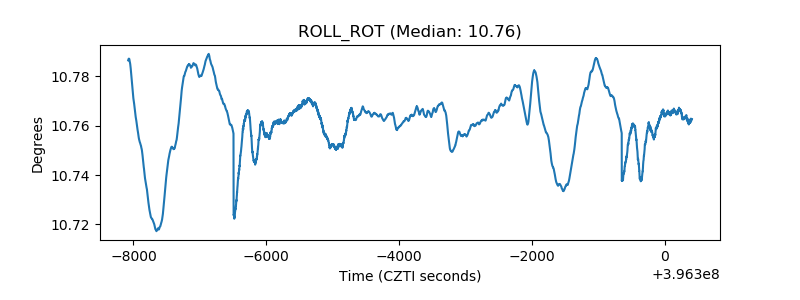 |
| _Roll_DEC |  |
| _Roll_RA |  |
| Veto Counter | 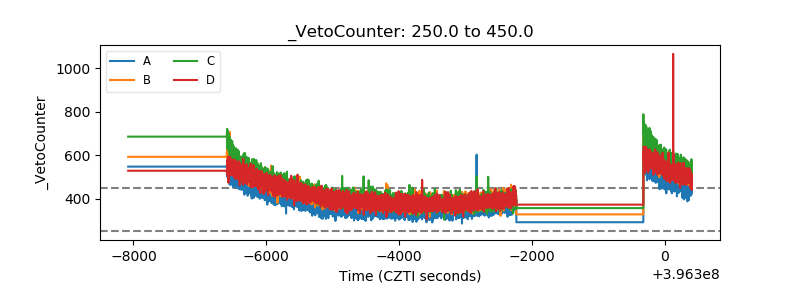 |