| Param | Original file | Final file |
|---|---|---|
| Filename | modeM0/AS1A11_075T01_9000005244_36868cztM0_level2.evt | modeM0/AS1A11_075T01_9000005244_36868cztM0_level2_quad_clean.evt |
| Size (bytes) | 337,176,000 | 73,889,280 |
| Size | 321.6 MB | 70.5 MB |
| Events in quadrant A | 2,715,603 | 624,952 |
| Events in quadrant B | 783,617 | 10,179 |
| Events in quadrant C | 3,052,026 | 640,882 |
| Events in quadrant D | 3,308,609 | 602,822 |
| Mode SS | |||
|---|---|---|---|
| Quadrant | BADHDUFLAG | Total packets | Discarded packets |
| A | 0 | 106 | 0 |
| B | 0 | 106 | 0 |
| C | 0 | 106 | 0 |
| D | 0 | 106 | 0 |
| Mode M0 | |||
|---|---|---|---|
| Quadrant | BADHDUFLAG | Total packets | Discarded packets |
| A | 0 | 11343 | 3 |
| B | 0 | 5188 | 2 |
| C | 0 | 12274 | 2 |
| D | 0 | 13239 | 2 |
| Mode M9 | |||
|---|---|---|---|
| Quadrant | BADHDUFLAG | Total packets | Discarded packets |
| A | 0 | 40 | 0 |
| B | 0 | 40 | 0 |
| C | 0 | 40 | 0 |
| D | 0 | 40 | 0 |
| Quadrant | Total seconds | Saturated seconds | Saturation percentage |
|---|---|---|---|
| A | 5084 | 33 | 0.649095% |
| B | 5084 | 5084 | 100.000000% |
| C | 5084 | 127 | 2.498033% |
| D | 5084 | 131 | 2.576711% |
Noise dominated data is calculated using 1-second bins in cleaned event files. If a bin has >2000 counts, and if more than 50% of those come from <1% of pixels, then it is considered to be noise-dominated and hence unusable.
| Quadrant | # 1 sec bins | Bins with >0 counts | Bins with >2000 counts | High rate bins dominated by noise | Noise dominated (total time) | Noise dominated (detector-on time) | Marked lightcurve |
|---|---|---|---|---|---|---|---|
| A | 9029 | 5086 | 23 | 23 | 0.25% | 0.45% | 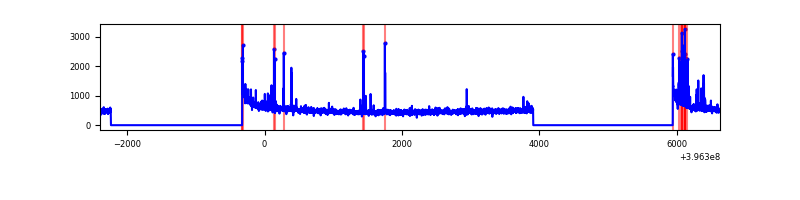 |
| B | 9028 | 5083 | 0 | 0 | 0.00% | 0.00% | 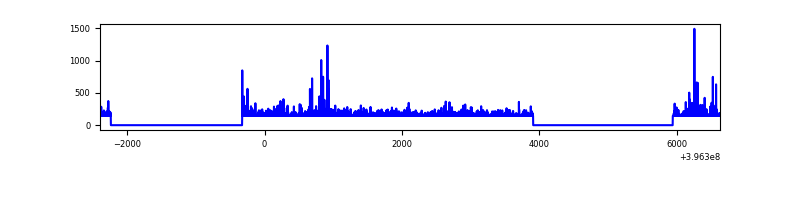 |
| C | 9029 | 5086 | 96 | 96 | 1.06% | 1.89% | 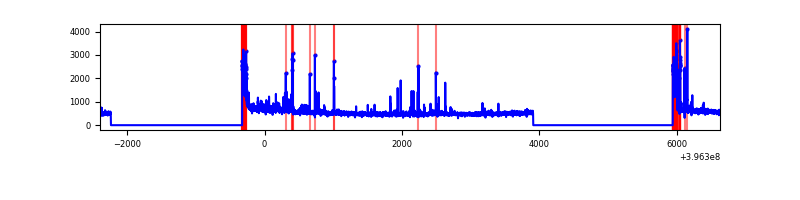 |
| D | 9029 | 5086 | 113 | 113 | 1.25% | 2.22% | 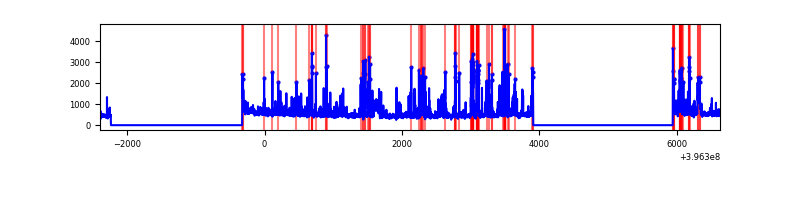 |
Top three noisy pixels from each quadrant. If the there are fewer than three noisy pixels in the level2.evt file, extra rows are filled as -1
| Pixel properties | Quadrant properties | ||||||
|---|---|---|---|---|---|---|---|
| Quadrant | DetID | PixID | Counts | Sigma | Mean | Median | Sigma |
| A | 10 | 83 | 229179 | 1895.22 | 603 | 593 | 120.6 |
| A | 13 | 248 | 79911 | 657.63 | 603 | 593 | 120.6 |
| A | 9 | 143 | 59515 | 488.53 | 603 | 593 | 120.6 |
| B | 12 | 243 | 703952 | 176663.63 | 11 | 11 | 4.0 |
| B | 12 | 144 | 13155 | 3298.67 | 11 | 11 | 4.0 |
| B | 0 | 213 | 8318 | 2084.76 | 11 | 11 | 4.0 |
| C | 0 | 10 | 280206 | 2033.15 | 596 | 602 | 137.5 |
| C | 15 | 214 | 215216 | 1560.57 | 596 | 602 | 137.5 |
| C | 0 | 239 | 106621 | 770.92 | 596 | 602 | 137.5 |
| D | 13 | 249 | 311876 | 2187.7 | 591 | 577 | 142.3 |
| D | 2 | 249 | 184012 | 1289.12 | 591 | 577 | 142.3 |
| D | 13 | 171 | 133363 | 933.17 | 591 | 577 | 142.3 |
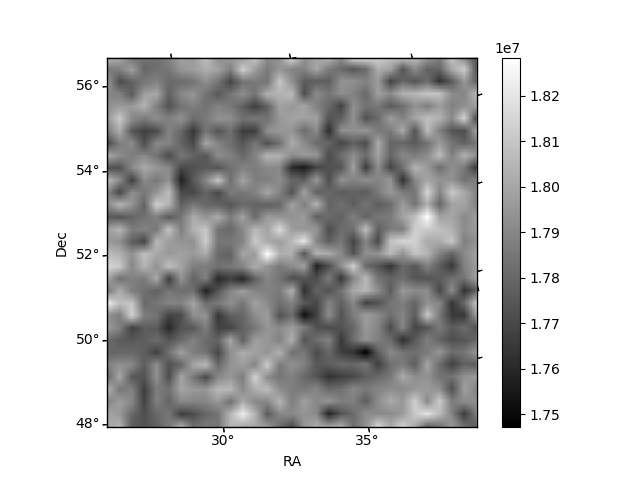
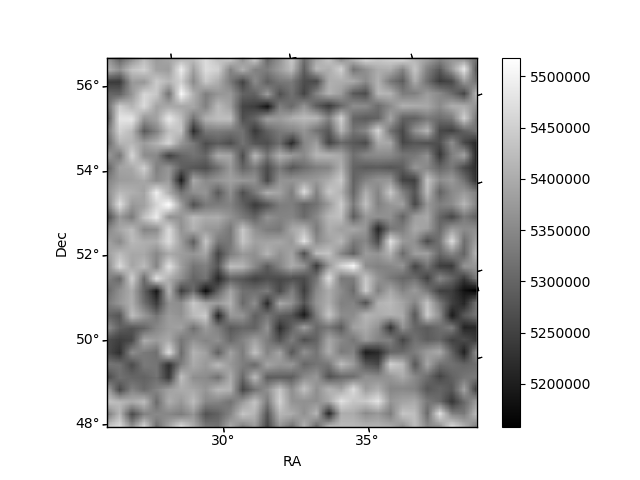
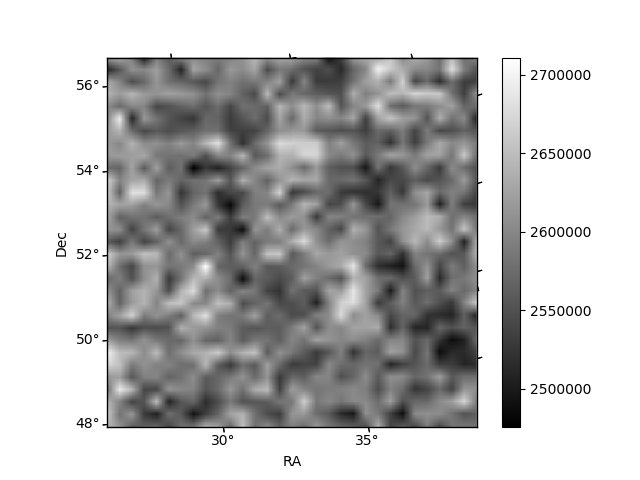
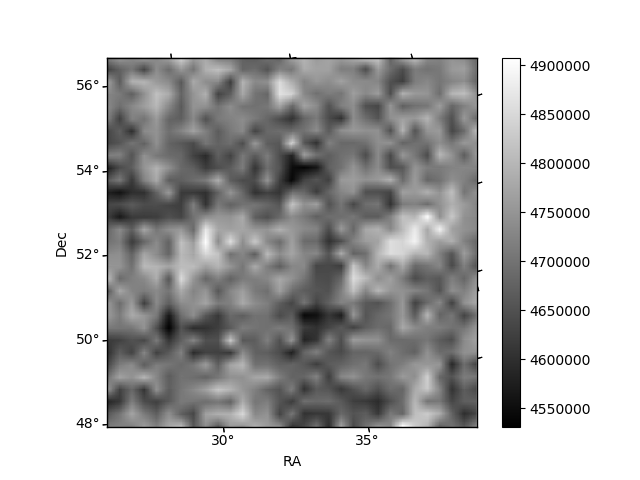
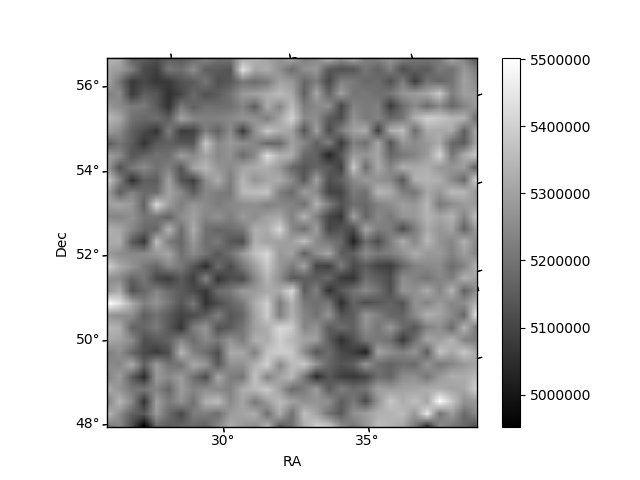
Histogram calculated using DETX and DETY for each event in the final _common_clean file
| Quadrant A | 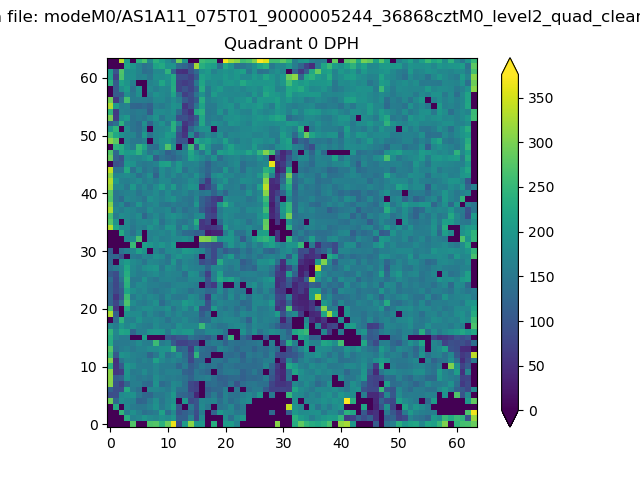 |
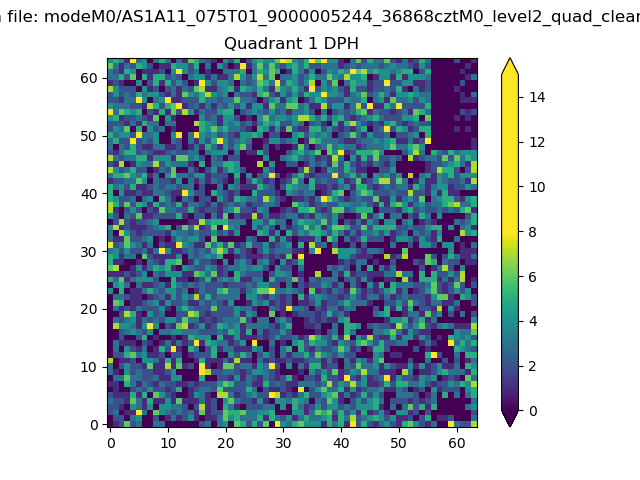 |
Quadrant B |
|---|---|---|---|
| Quadrant D | 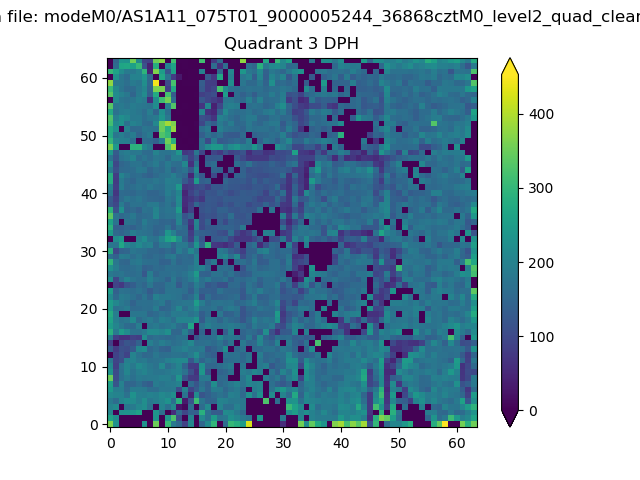 |
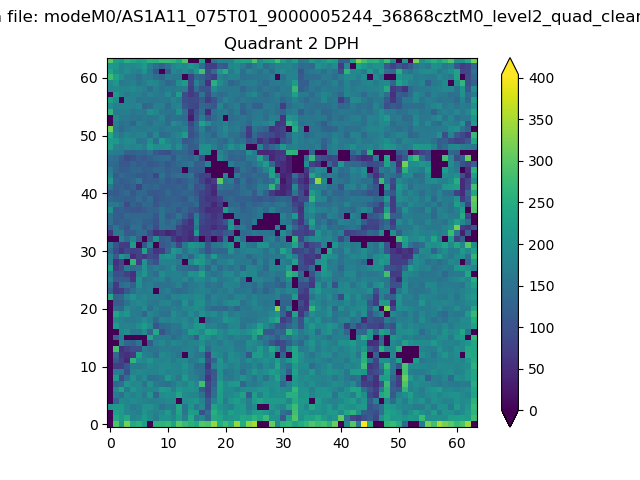 |
Quadrant C |
| Plot type | Count rate plots | Images |
|---|---|---|
| Comparison with Poisson distribution Blue bars denote a histogram of data divided into 1 sec bins. Red curve is a Poisson curve with rate = median count rate of data. |
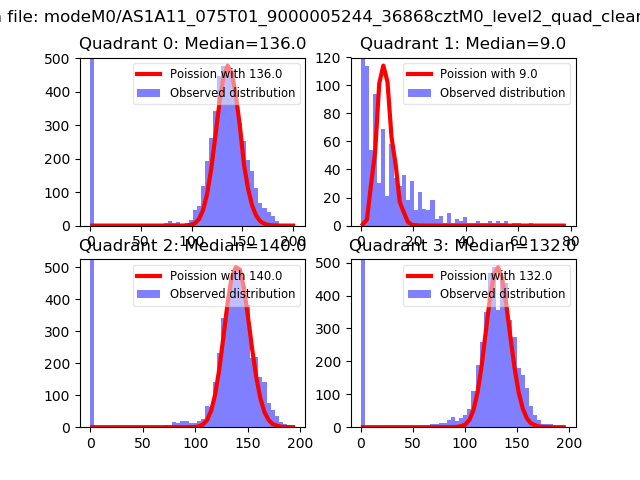 |
 |
| Quadrant-wise count rates Data is divided into 100 sec bins |
 |
|
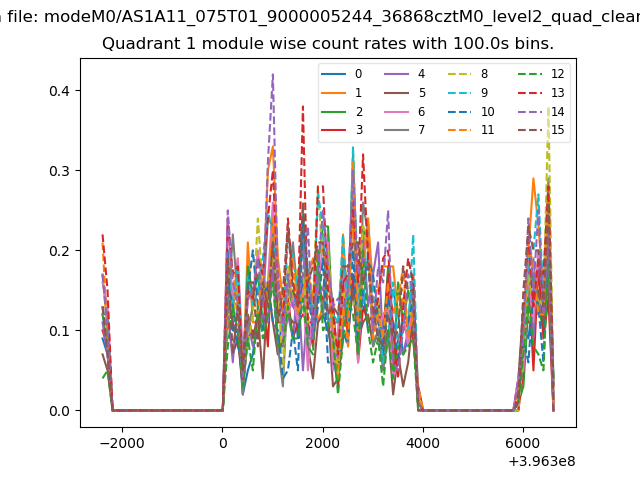
| Module-wise count rates for Quadrant A Data is divided into 100 sec bins |
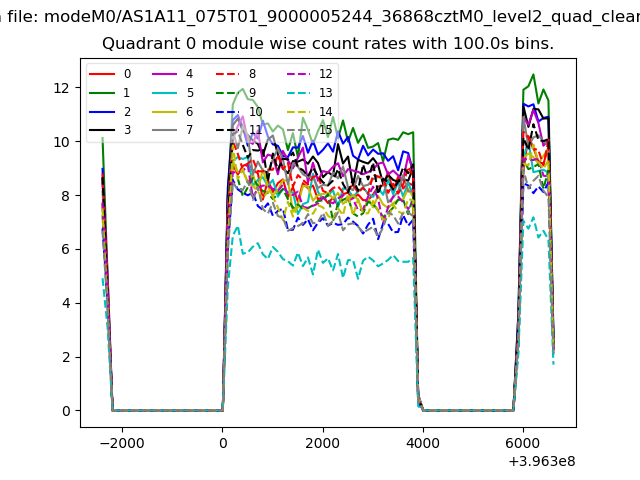 |
 |
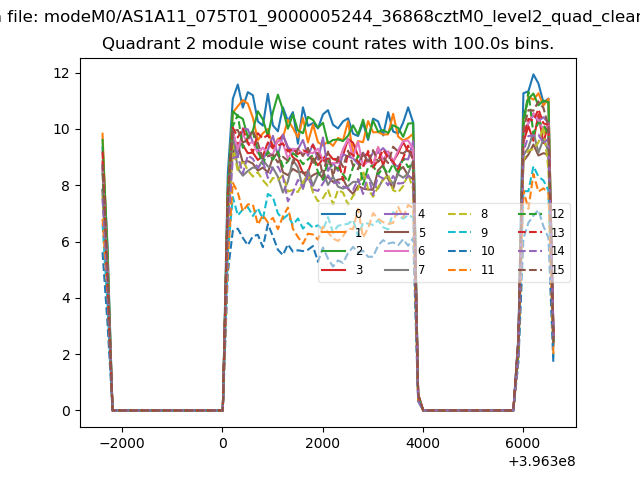
| Module-wise count rates for Quadrant B Data is divided into 100 sec bins |
 |
 |
| Module-wise count rates for Quadrant C Data is divided into 100 sec bins |
 |
 |
| Module-wise count rates for Quadrant D Data is divided into 100 sec bins |
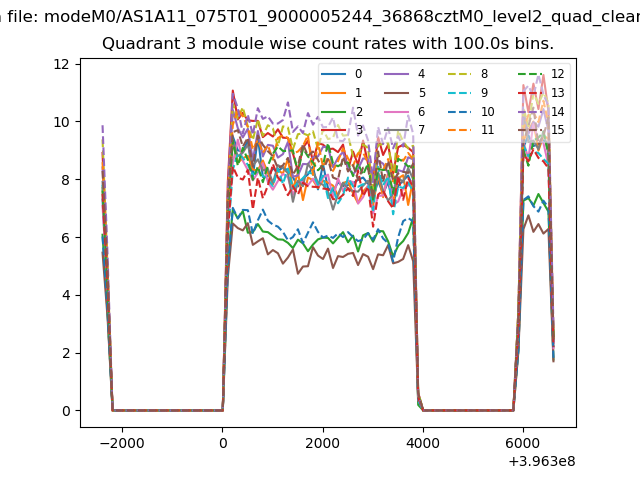 |
 |
| Parameter | Plot |
|---|---|
| CZT HV Monitor | 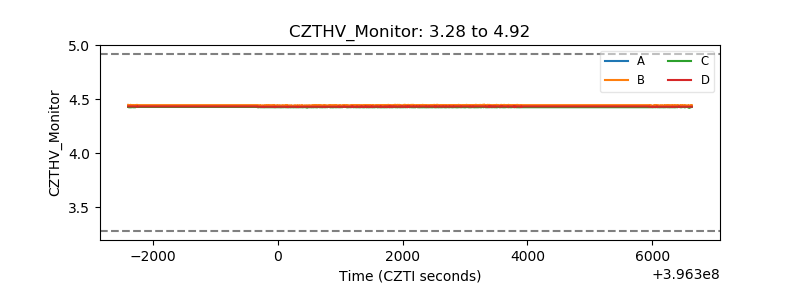 |
| D_VDD | 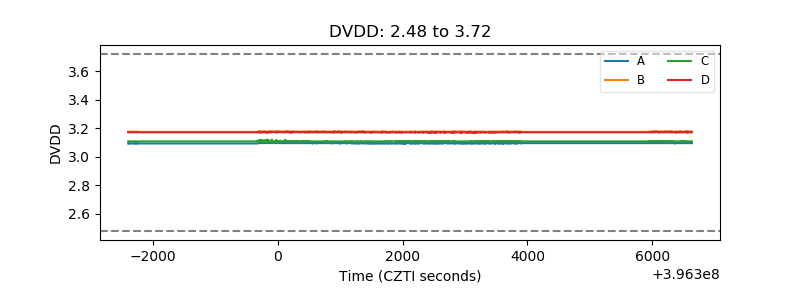 |
| Temperature 1 | 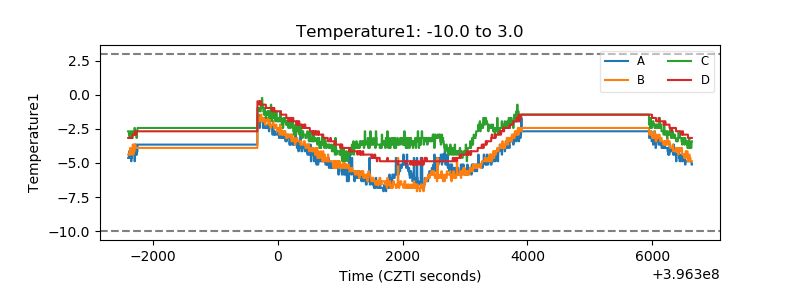 |
| Veto HV Monitor | 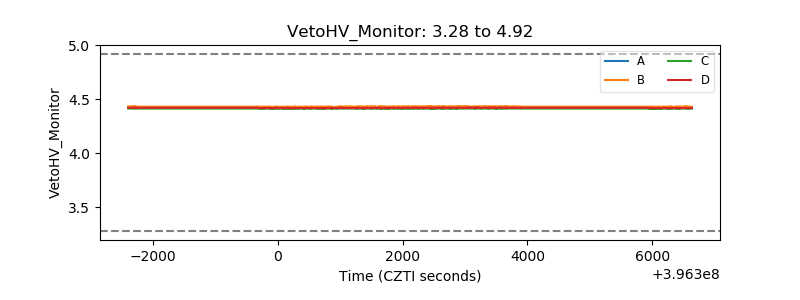 |
| Veto LLD | 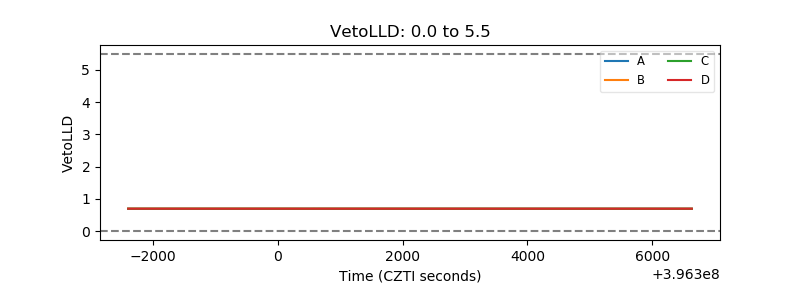 |
| Alpha Counter | 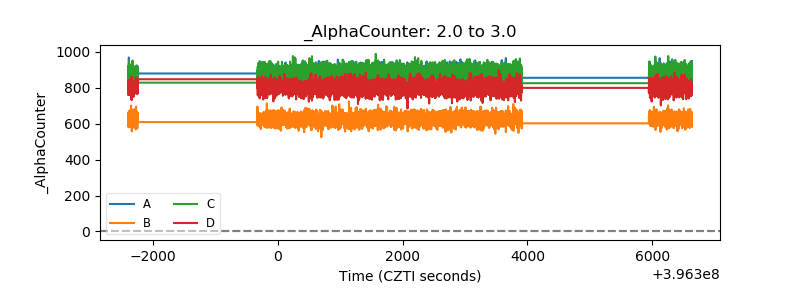 |
| _CPM_Rate | 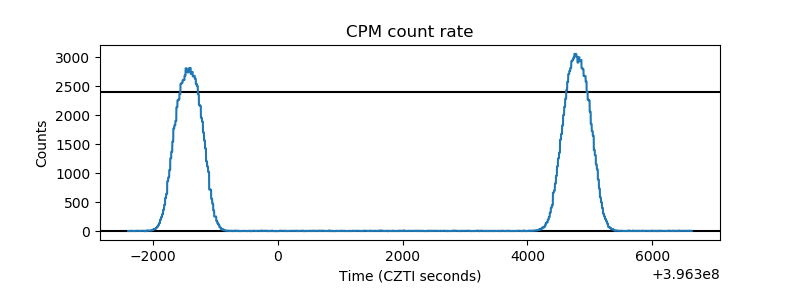 |
| CZT Counter | 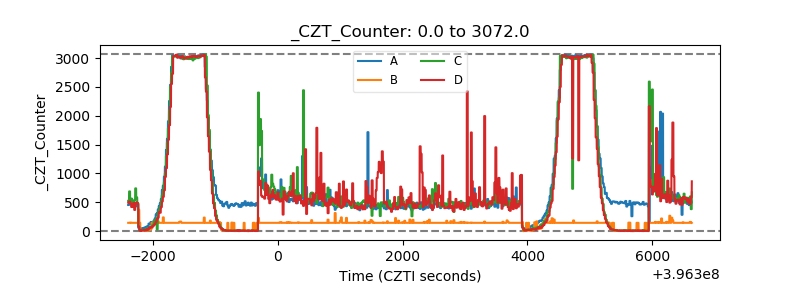 |
| +2.5 Volts monitor | 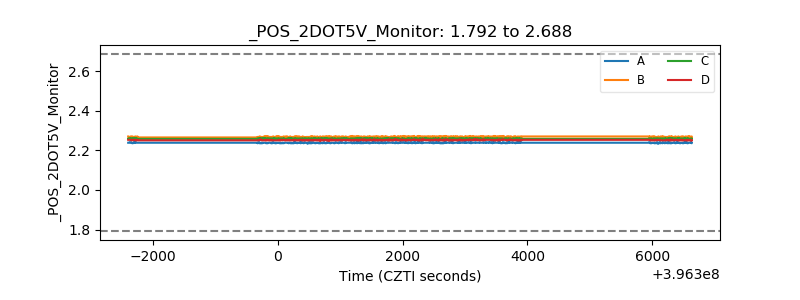 |
| +5 Volts monitor |  |
| _ROLL_ROT | 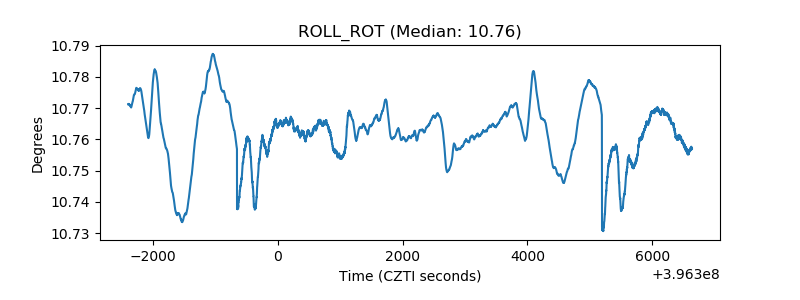 |
| _Roll_DEC | 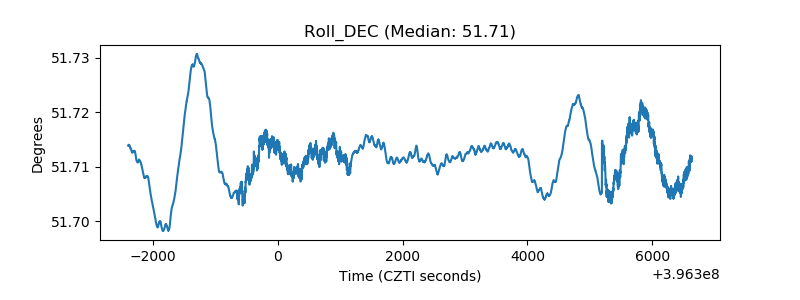 |
| _Roll_RA | 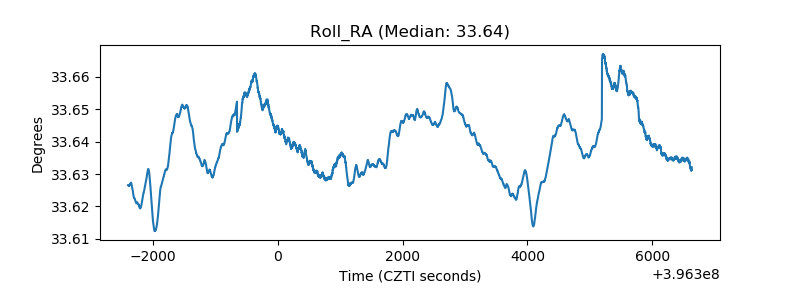 |
| Veto Counter | 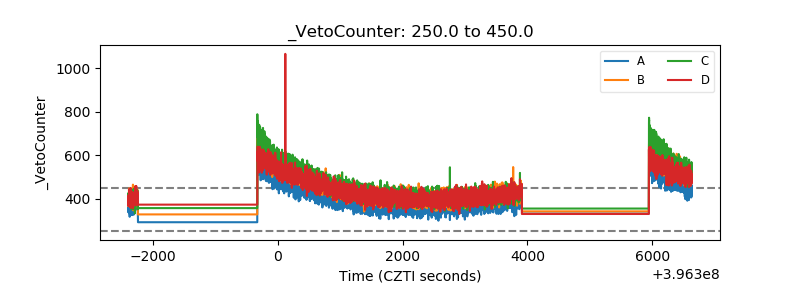 |