| Param | Original file | Final file |
|---|---|---|
| Filename | modeM0/AS1A11_075T01_9000005244_36869cztM0_level2.evt | modeM0/AS1A11_075T01_9000005244_36869cztM0_level2_quad_clean.evt |
| Size (bytes) | 337,268,160 | 73,563,840 |
| Size | 321.6 MB | 70.2 MB |
| Events in quadrant A | 2,558,683 | 628,101 |
| Events in quadrant B | 744,730 | 9,555 |
| Events in quadrant C | 2,833,983 | 647,584 |
| Events in quadrant D | 3,740,648 | 598,693 |
| Mode SS | |||
|---|---|---|---|
| Quadrant | BADHDUFLAG | Total packets | Discarded packets |
| A | 0 | 100 | 0 |
| B | 0 | 100 | 0 |
| C | 0 | 100 | 0 |
| D | 0 | 100 | 0 |
| Mode M0 | |||
|---|---|---|---|
| Quadrant | BADHDUFLAG | Total packets | Discarded packets |
| A | 0 | 10729 | 3 |
| B | 0 | 4960 | 2 |
| C | 0 | 11328 | 2 |
| D | 0 | 14333 | 2 |
| Mode M9 | |||
|---|---|---|---|
| Quadrant | BADHDUFLAG | Total packets | Discarded packets |
| A | 0 | 29 | 0 |
| B | 0 | 29 | 0 |
| C | 0 | 29 | 0 |
| D | 0 | 30 | 0 |
| Quadrant | Total seconds | Saturated seconds | Saturation percentage |
|---|---|---|---|
| A | 4863 | 30 | 0.616903% |
| B | 4863 | 4863 | 100.000000% |
| C | 4863 | 110 | 2.261978% |
| D | 4863 | 252 | 5.181986% |
Noise dominated data is calculated using 1-second bins in cleaned event files. If a bin has >2000 counts, and if more than 50% of those come from <1% of pixels, then it is considered to be noise-dominated and hence unusable.
| Quadrant | # 1 sec bins | Bins with >0 counts | Bins with >2000 counts | High rate bins dominated by noise | Noise dominated (total time) | Noise dominated (detector-on time) | Marked lightcurve |
|---|---|---|---|---|---|---|---|
| A | 6986 | 4864 | 21 | 21 | 0.30% | 0.43% | 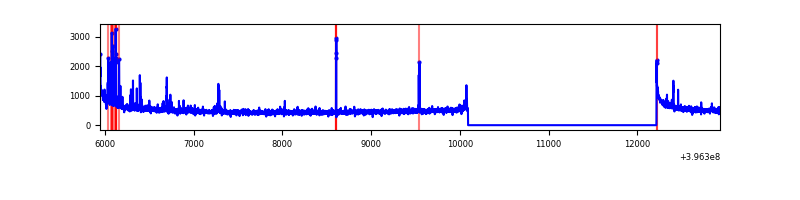 |
| B | 6985 | 4862 | 0 | 0 | 0.00% | 0.00% | 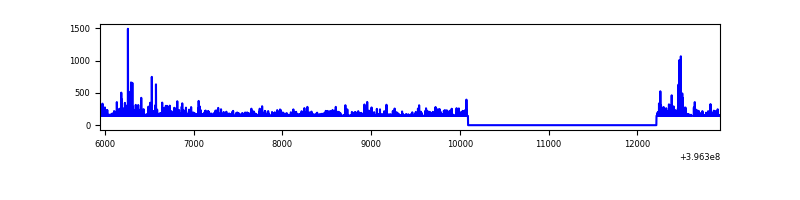 |
| C | 6986 | 4864 | 87 | 87 | 1.25% | 1.79% | 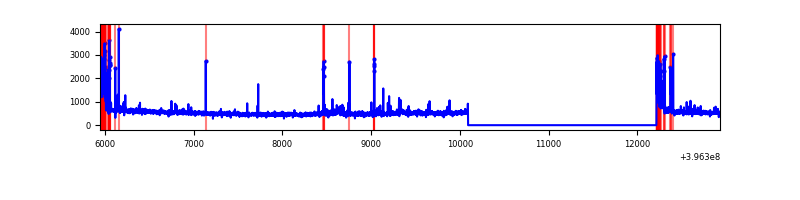 |
| D | 6986 | 4864 | 254 | 254 | 3.64% | 5.22% | 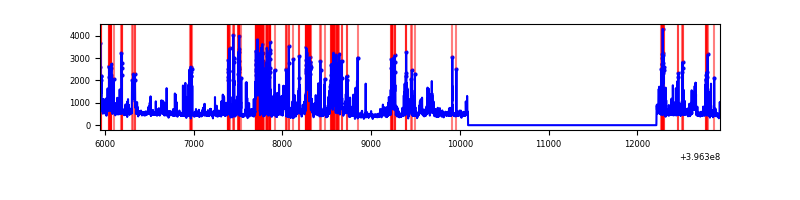 |
Top three noisy pixels from each quadrant. If the there are fewer than three noisy pixels in the level2.evt file, extra rows are filled as -1
| Pixel properties | Quadrant properties | ||||||
|---|---|---|---|---|---|---|---|
| Quadrant | DetID | PixID | Counts | Sigma | Mean | Median | Sigma |
| A | 10 | 83 | 216675 | 1900.05 | 566 | 557 | 113.7 |
| A | 13 | 248 | 65176 | 568.11 | 566 | 557 | 113.7 |
| A | 9 | 143 | 56215 | 489.33 | 566 | 557 | 113.7 |
| B | 12 | 243 | 674454 | 185952.26 | 10 | 10 | 3.6 |
| B | 12 | 144 | 12157 | 3349.07 | 10 | 10 | 3.6 |
| B | 5 | 172 | 5760 | 1585.34 | 10 | 10 | 3.6 |
| C | 0 | 10 | 227097 | 1757.25 | 564 | 570 | 128.9 |
| C | 15 | 214 | 205332 | 1588.41 | 564 | 570 | 128.9 |
| C | 14 | 254 | 84714 | 652.73 | 564 | 570 | 128.9 |
| D | 12 | 17 | 799942 | 5518.71 | 547 | 537 | 144.9 |
| D | 13 | 249 | 219217 | 1509.66 | 547 | 537 | 144.9 |
| D | 13 | 171 | 165553 | 1139.19 | 547 | 537 | 144.9 |
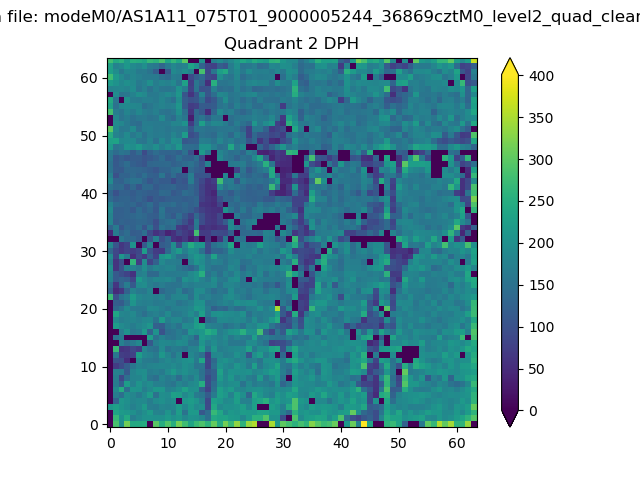
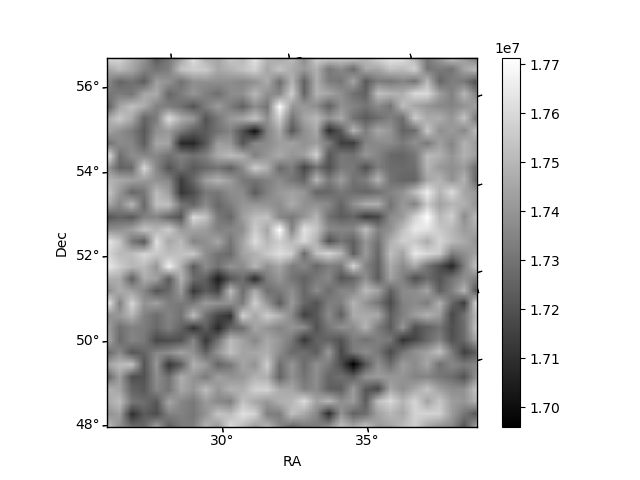
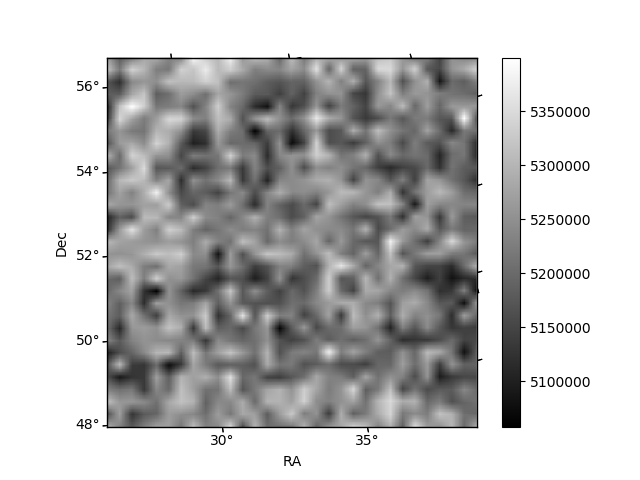
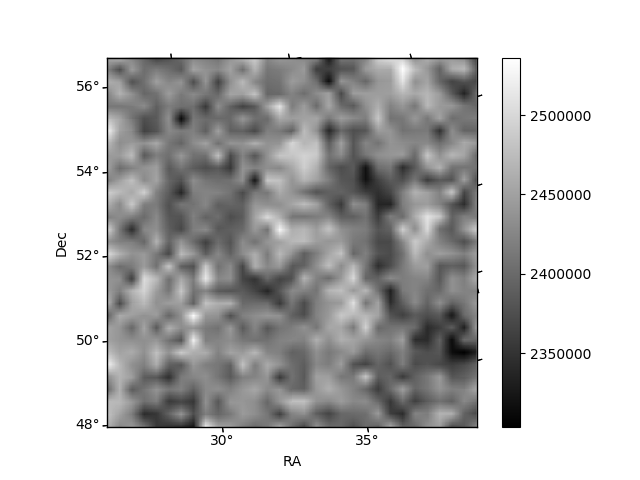
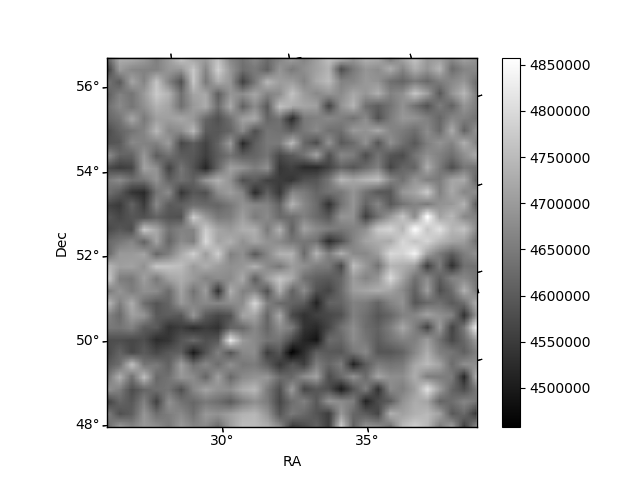
Histogram calculated using DETX and DETY for each event in the final _common_clean file
| Quadrant A | 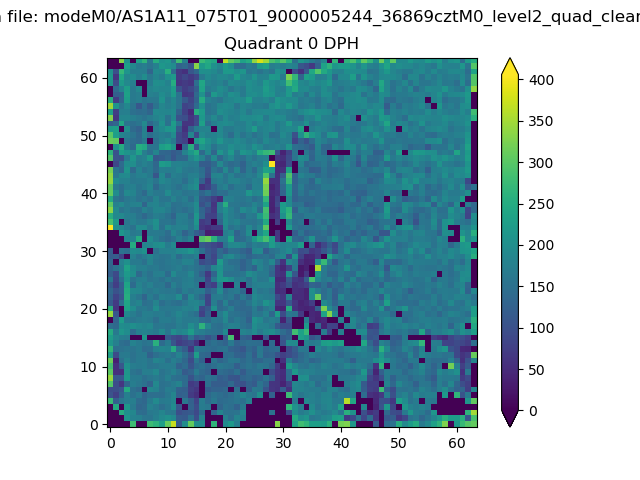 |
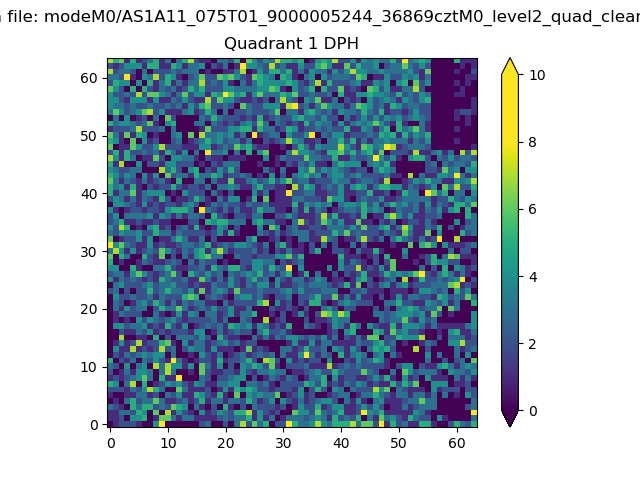 |
Quadrant B |
|---|---|---|---|
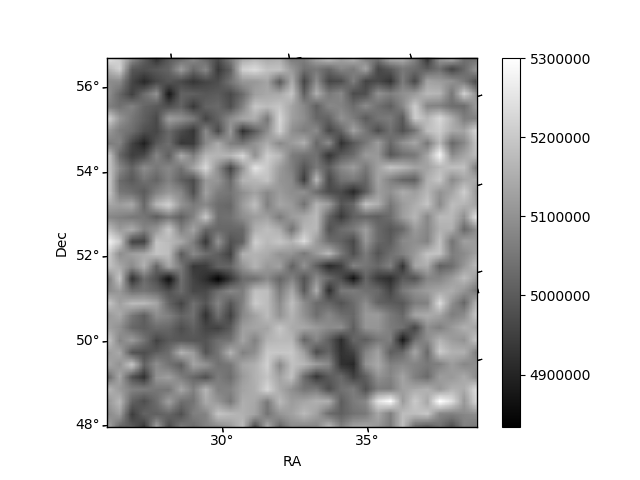
| Quadrant D | 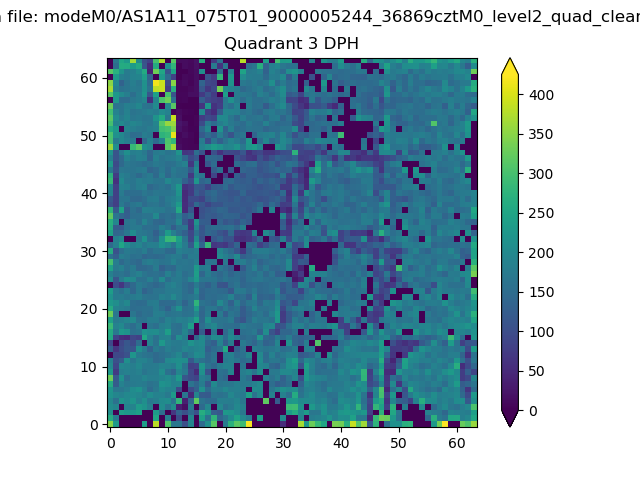 |
 |
Quadrant C |
| Plot type | Count rate plots | Images |
|---|---|---|
| Comparison with Poisson distribution Blue bars denote a histogram of data divided into 1 sec bins. Red curve is a Poisson curve with rate = median count rate of data. |
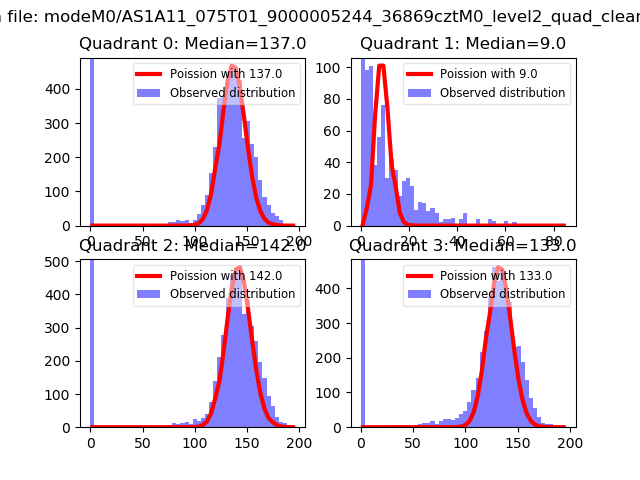 |
 |
| Quadrant-wise count rates Data is divided into 100 sec bins |
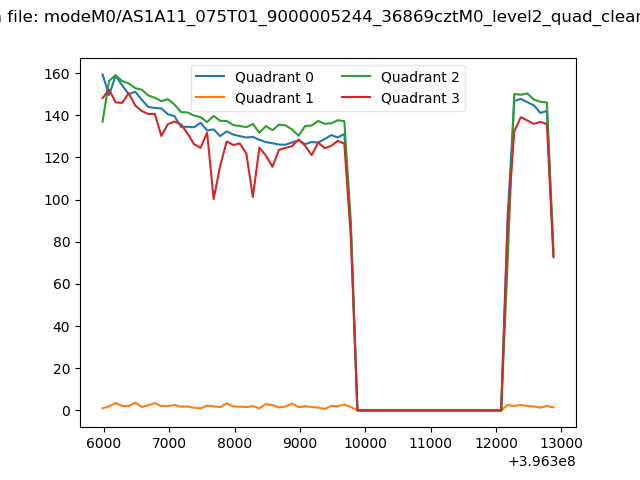 |
|
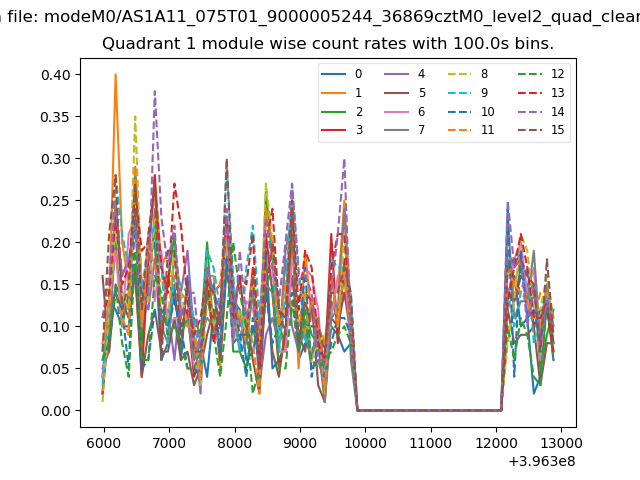
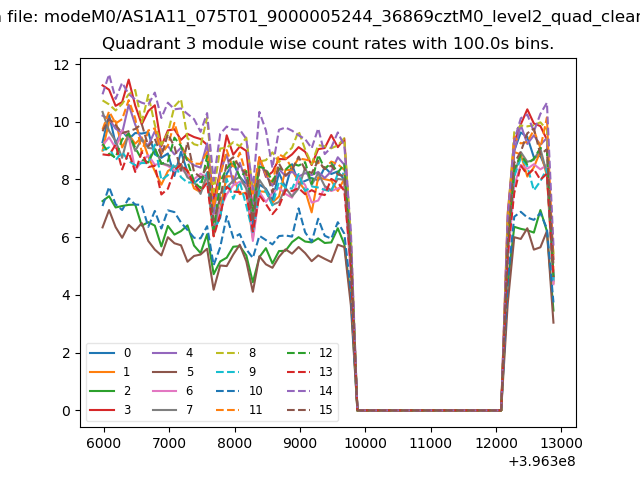
| Module-wise count rates for Quadrant A Data is divided into 100 sec bins |
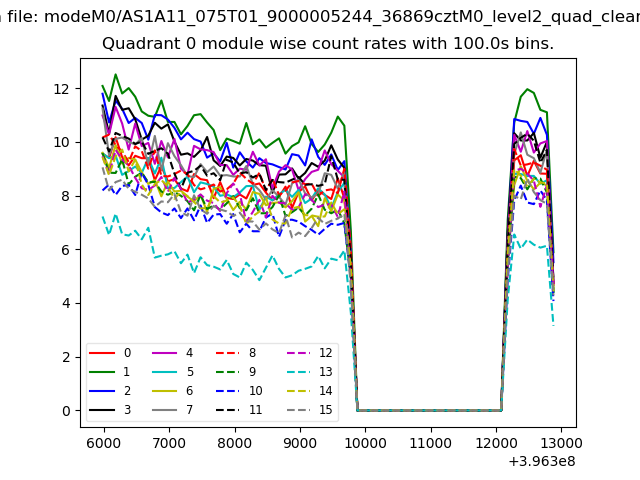 |
 |
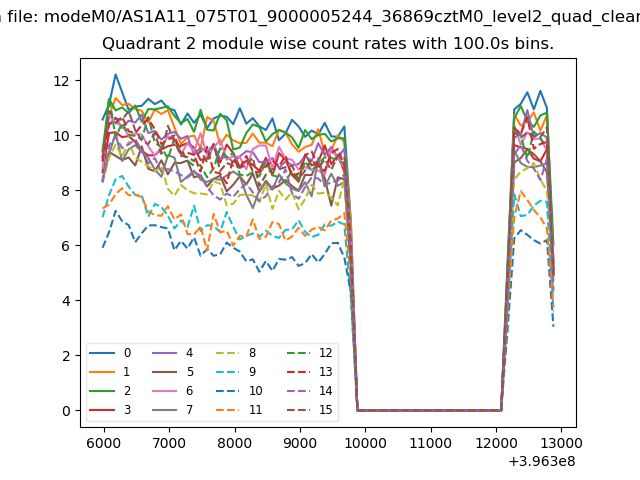
| Module-wise count rates for Quadrant B Data is divided into 100 sec bins |
 |
 |
| Module-wise count rates for Quadrant C Data is divided into 100 sec bins |
 |
 |
| Module-wise count rates for Quadrant D Data is divided into 100 sec bins |
 |
 |
| Parameter | Plot |
|---|---|
| CZT HV Monitor | 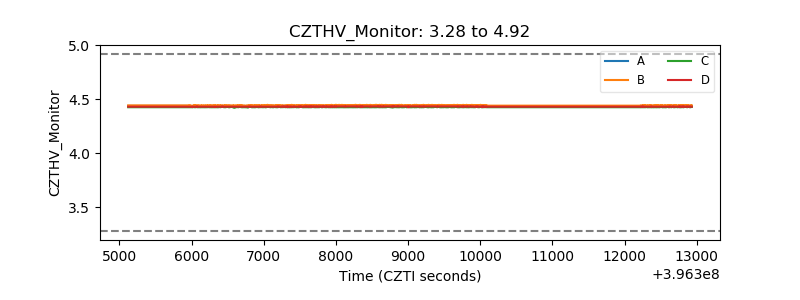 |
| D_VDD | 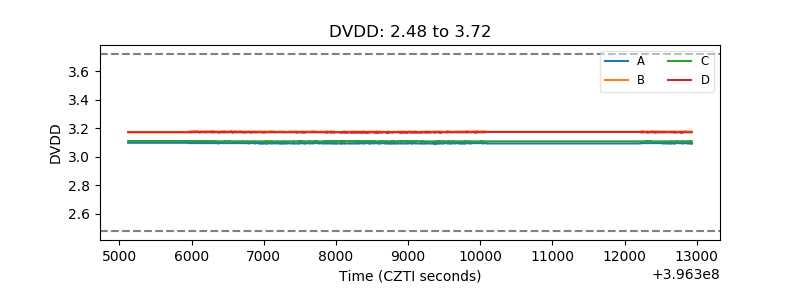 |
| Temperature 1 | 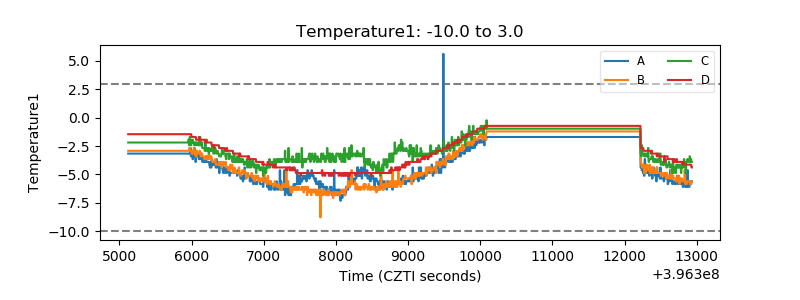 |
| Veto HV Monitor | 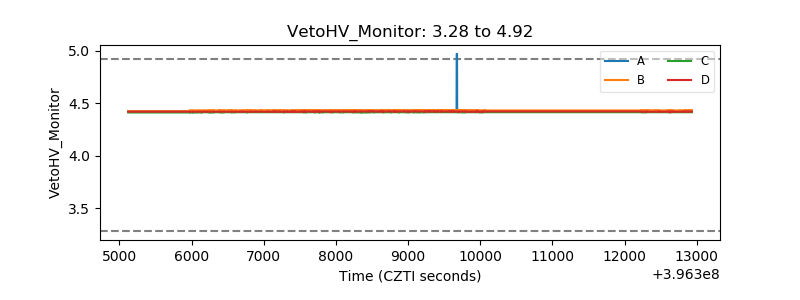 |
| Veto LLD | 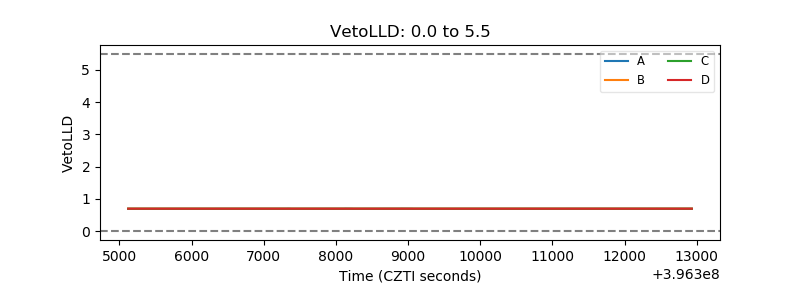 |
| Alpha Counter | 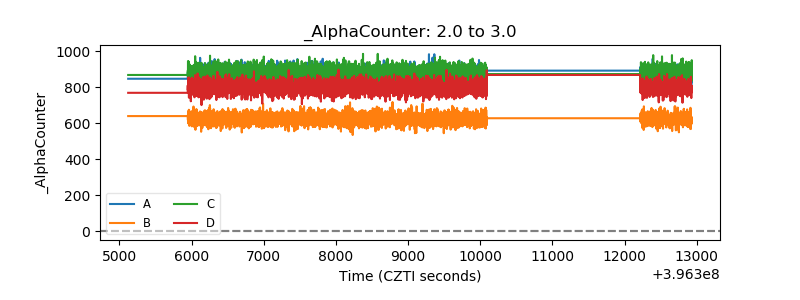 |
| _CPM_Rate | 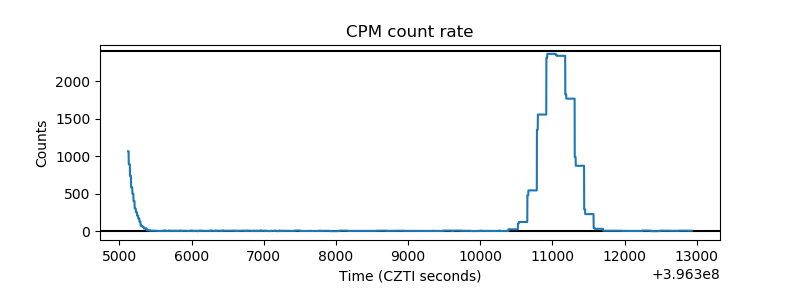 |
| CZT Counter | 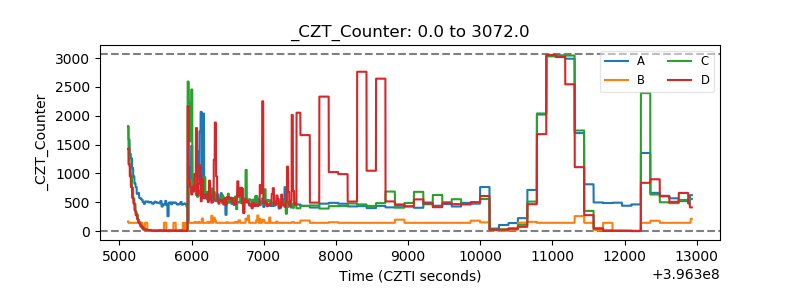 |
| +2.5 Volts monitor |  |
| +5 Volts monitor |  |
| _ROLL_ROT | 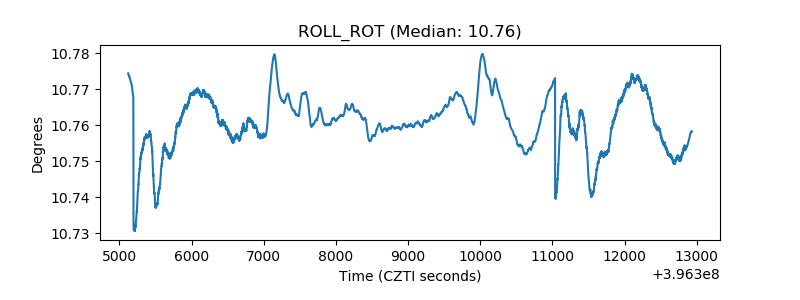 |
| _Roll_DEC | 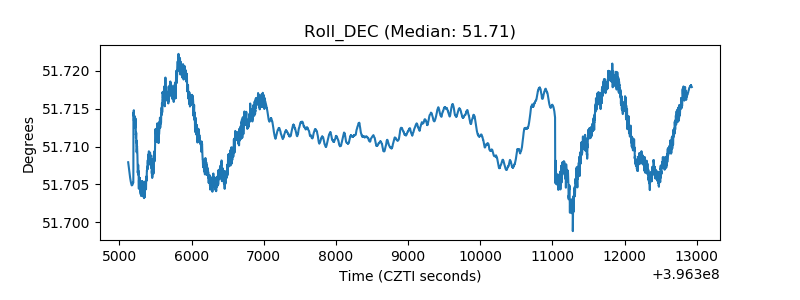 |
| _Roll_RA | 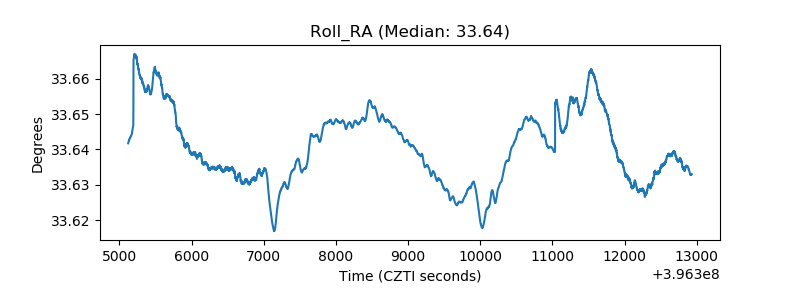 |
| Veto Counter | 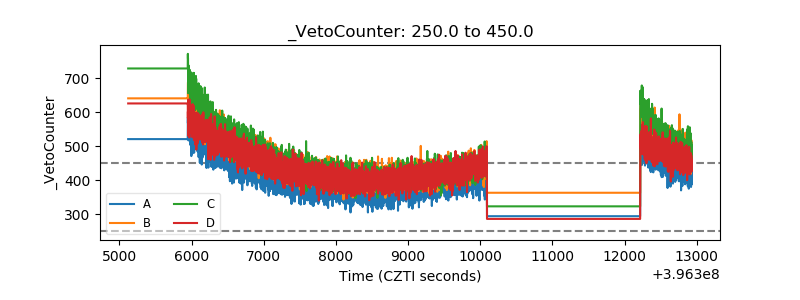 |