| Param | Original file | Final file |
|---|---|---|
| Filename | modeM0/AS1A11_075T01_9000005244_36870cztM0_level2.evt | modeM0/AS1A11_075T01_9000005244_36870cztM0_level2_quad_clean.evt |
| Size (bytes) | 308,600,640 | 66,755,520 |
| Size | 294.3 MB | 63.7 MB |
| Events in quadrant A | 2,442,261 | 556,168 |
| Events in quadrant B | 743,336 | 8,024 |
| Events in quadrant C | 2,744,705 | 570,929 |
| Events in quadrant D | 3,077,117 | 540,935 |
| Mode SS | |||
|---|---|---|---|
| Quadrant | BADHDUFLAG | Total packets | Discarded packets |
| A | 0 | 102 | 0 |
| B | 0 | 102 | 0 |
| C | 0 | 102 | 0 |
| D | 0 | 102 | 0 |
| Mode M0 | |||
|---|---|---|---|
| Quadrant | BADHDUFLAG | Total packets | Discarded packets |
| A | 0 | 10482 | 3 |
| B | 0 | 4974 | 2 |
| C | 0 | 11128 | 2 |
| D | 0 | 12564 | 2 |
| Mode M9 | |||
|---|---|---|---|
| Quadrant | BADHDUFLAG | Total packets | Discarded packets |
| A | 0 | 32 | 0 |
| B | 0 | 32 | 0 |
| C | 0 | 32 | 0 |
| D | 0 | 33 | 0 |
| Quadrant | Total seconds | Saturated seconds | Saturation percentage |
|---|---|---|---|
| A | 4886 | 18 | 0.368400% |
| B | 4886 | 4886 | 100.000000% |
| C | 4886 | 109 | 2.230864% |
| D | 4886 | 157 | 3.213262% |
Noise dominated data is calculated using 1-second bins in cleaned event files. If a bin has >2000 counts, and if more than 50% of those come from <1% of pixels, then it is considered to be noise-dominated and hence unusable.
| Quadrant | # 1 sec bins | Bins with >0 counts | Bins with >2000 counts | High rate bins dominated by noise | Noise dominated (total time) | Noise dominated (detector-on time) | Marked lightcurve |
|---|---|---|---|---|---|---|---|
| A | 7039 | 4887 | 10 | 10 | 0.14% | 0.20% | 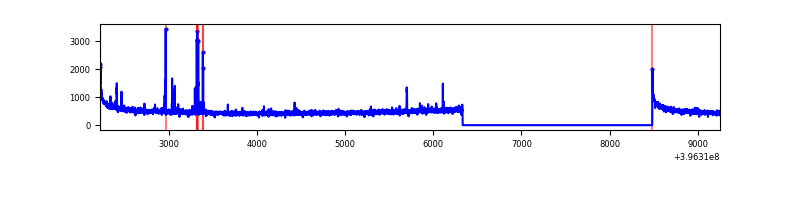 |
| B | 7038 | 4885 | 0 | 0 | 0.00% | 0.00% | 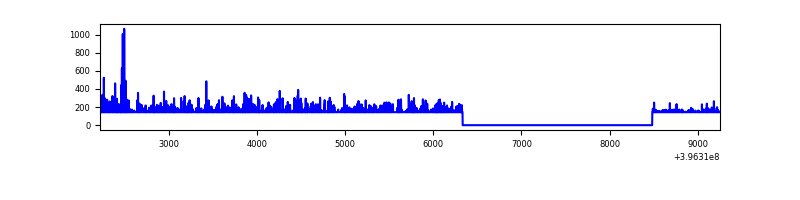 |
| C | 7039 | 4887 | 94 | 94 | 1.34% | 1.92% | 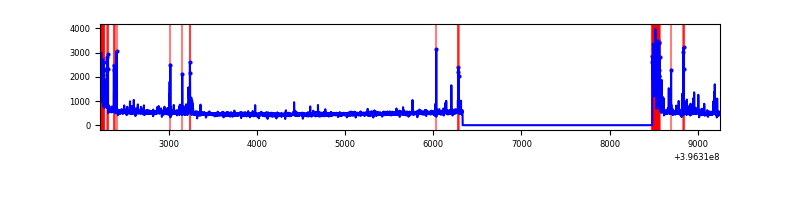 |
| D | 7039 | 4887 | 139 | 139 | 1.97% | 2.84% | 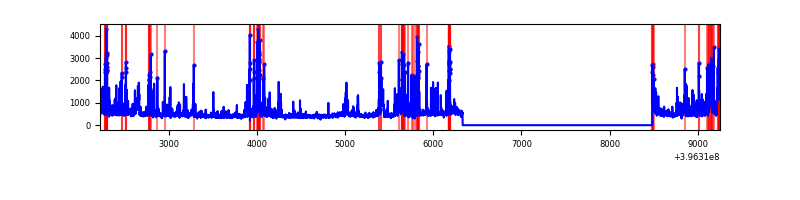 |
Top three noisy pixels from each quadrant. If the there are fewer than three noisy pixels in the level2.evt file, extra rows are filled as -1
| Pixel properties | Quadrant properties | ||||||
|---|---|---|---|---|---|---|---|
| Quadrant | DetID | PixID | Counts | Sigma | Mean | Median | Sigma |
| A | 10 | 83 | 212558 | 1905.76 | 550 | 541 | 111.3 |
| A | 9 | 143 | 73595 | 656.66 | 550 | 541 | 111.3 |
| A | 13 | 6 | 14928 | 129.32 | 550 | 541 | 111.3 |
| B | 12 | 243 | 678743 | 198261.76 | 9 | 9 | 3.4 |
| B | 12 | 144 | 12293 | 3588.22 | 9 | 9 | 3.4 |
| B | 5 | 172 | 6102 | 1779.8 | 9 | 9 | 3.4 |
| C | 0 | 10 | 284000 | 2289.7 | 544 | 550 | 123.8 |
| C | 15 | 214 | 206305 | 1662.09 | 544 | 550 | 123.8 |
| C | 14 | 254 | 74093 | 594.08 | 544 | 550 | 123.8 |
| D | 13 | 249 | 352663 | 2510.14 | 531 | 521 | 140.3 |
| D | 12 | 17 | 180962 | 1286.22 | 531 | 521 | 140.3 |
| D | 12 | 227 | 157321 | 1117.7 | 531 | 521 | 140.3 |
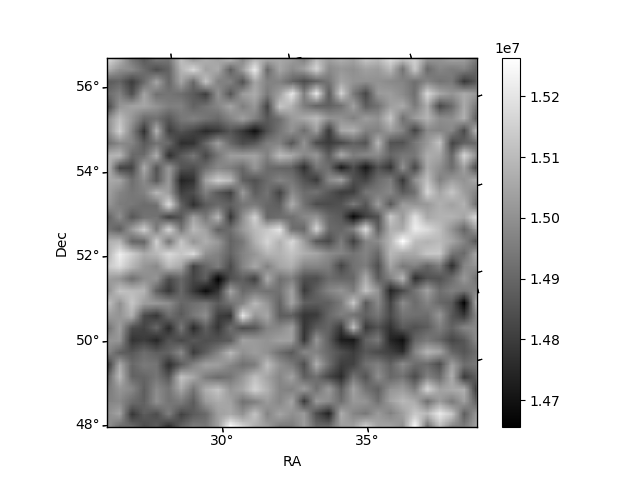
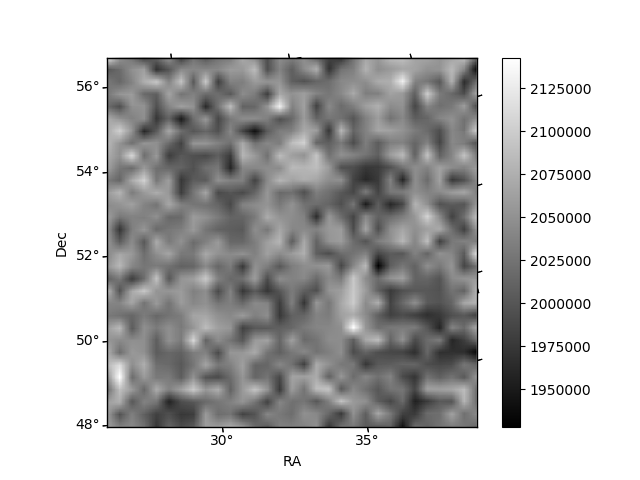
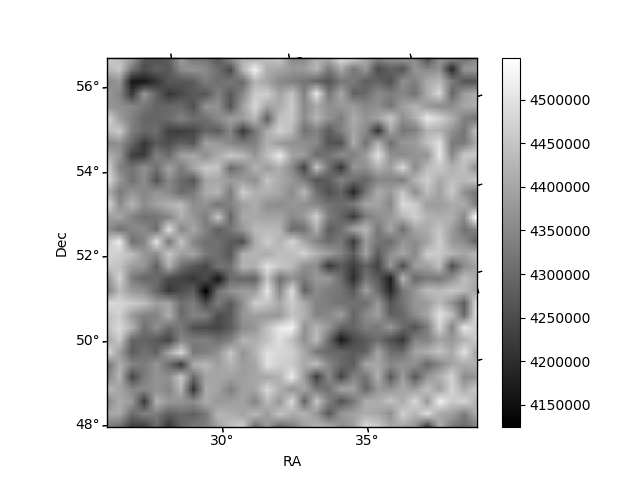
Histogram calculated using DETX and DETY for each event in the final _common_clean file
| Quadrant A | 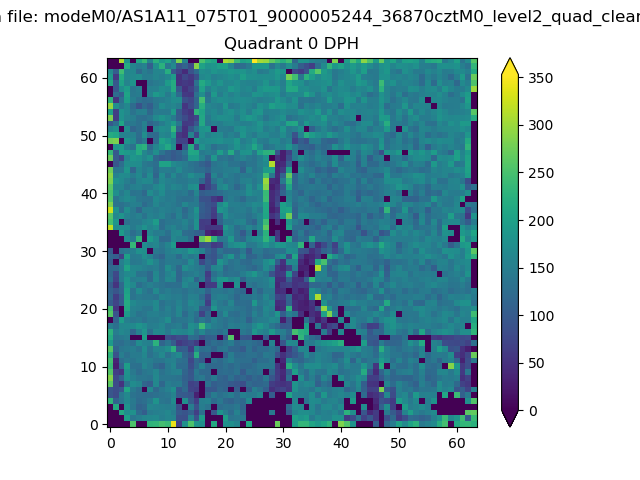 |
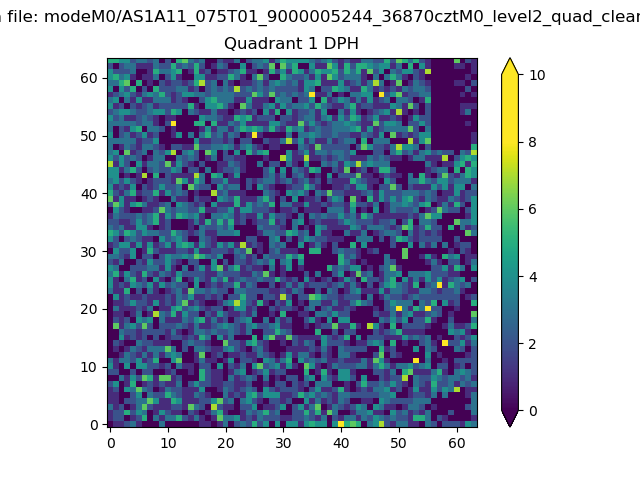 |
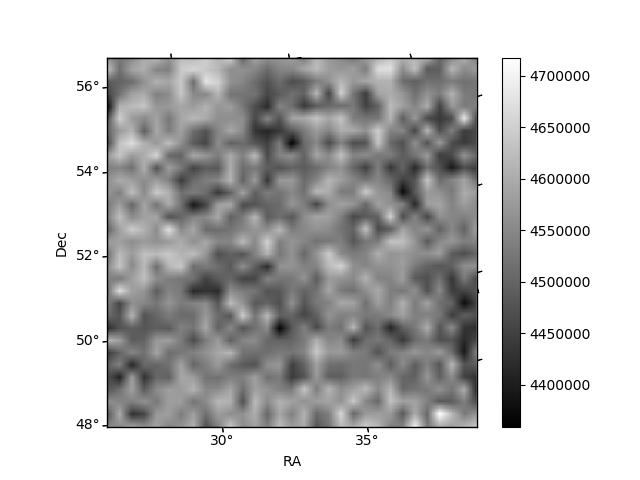
Quadrant B |
|---|---|---|---|
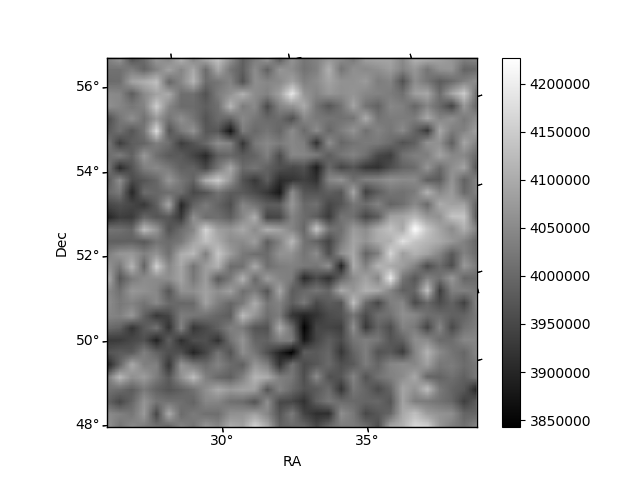
| Quadrant D |  |
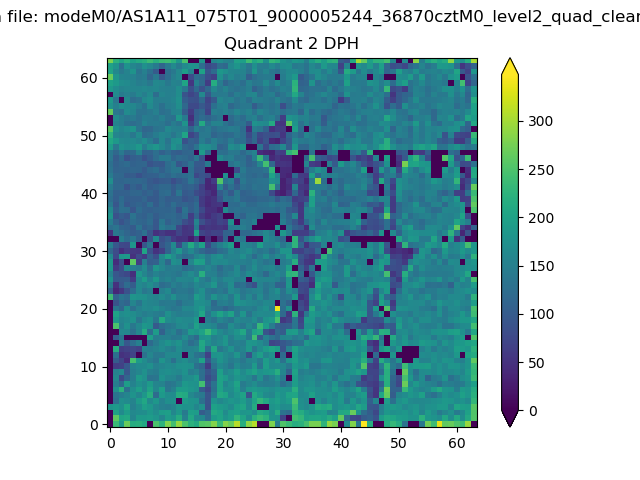 |
Quadrant C |
| Plot type | Count rate plots | Images |
|---|---|---|
| Comparison with Poisson distribution Blue bars denote a histogram of data divided into 1 sec bins. Red curve is a Poisson curve with rate = median count rate of data. |
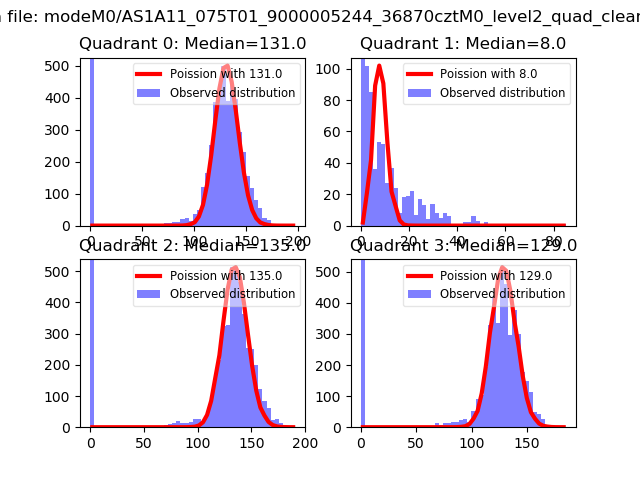 |
 |
| Quadrant-wise count rates Data is divided into 100 sec bins |
 |
|
| Module-wise count rates for Quadrant A Data is divided into 100 sec bins |
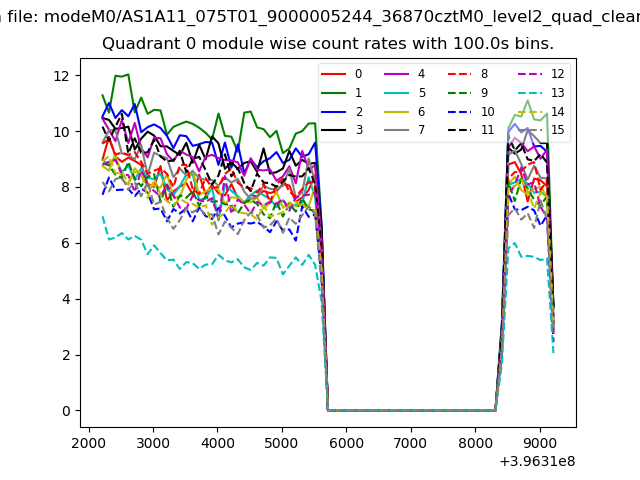 |
 |
| Module-wise count rates for Quadrant B Data is divided into 100 sec bins |
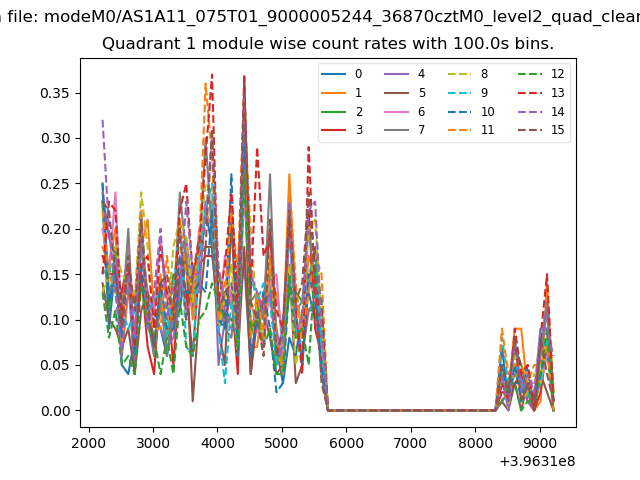 |
 |
| Module-wise count rates for Quadrant C Data is divided into 100 sec bins |
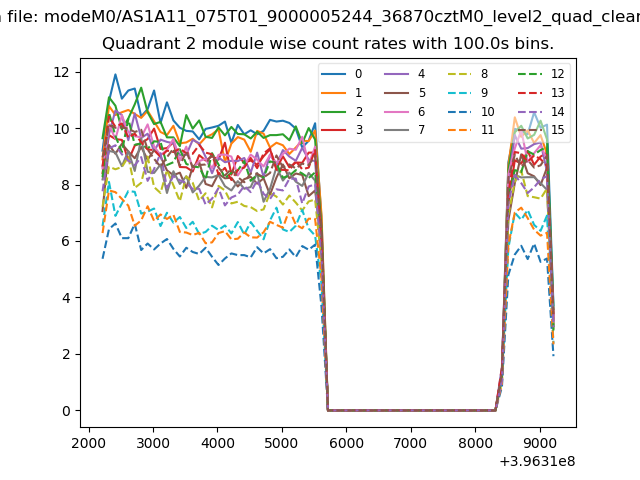 |
 |
| Module-wise count rates for Quadrant D Data is divided into 100 sec bins |
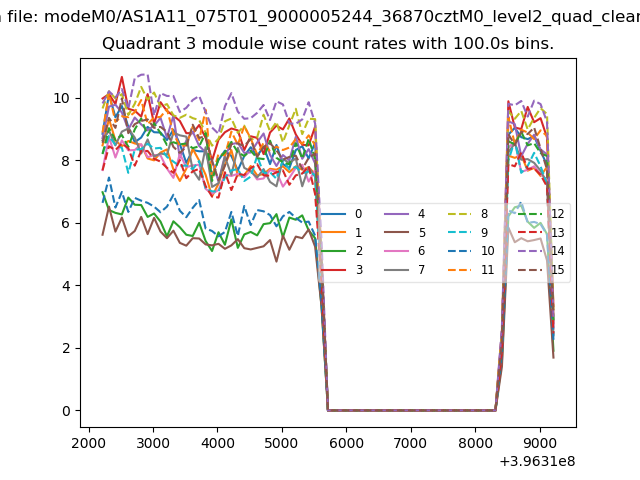 |
 |
| Parameter | Plot |
|---|---|
| CZT HV Monitor | 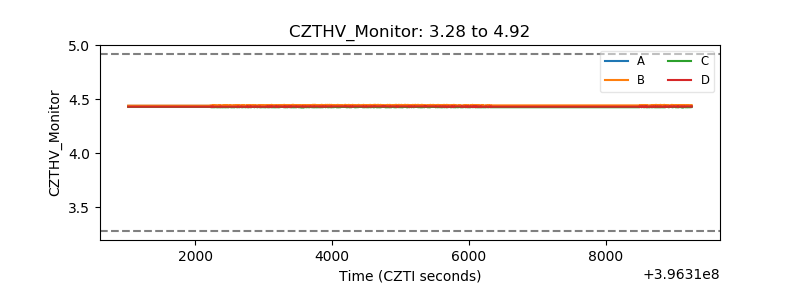 |
| D_VDD | 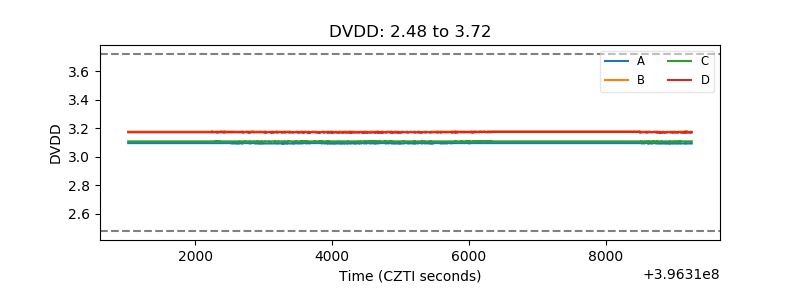 |
| Temperature 1 | 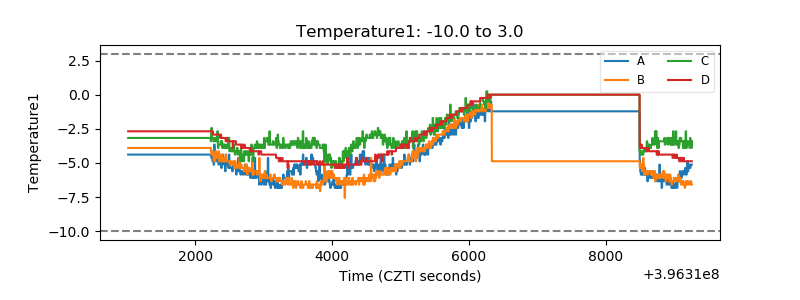 |
| Veto HV Monitor |  |
| Veto LLD | 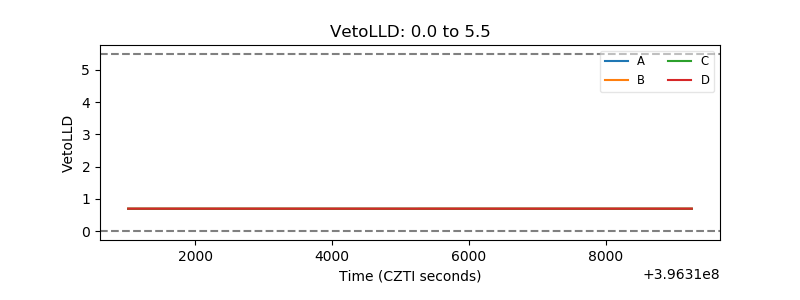 |
| Alpha Counter | 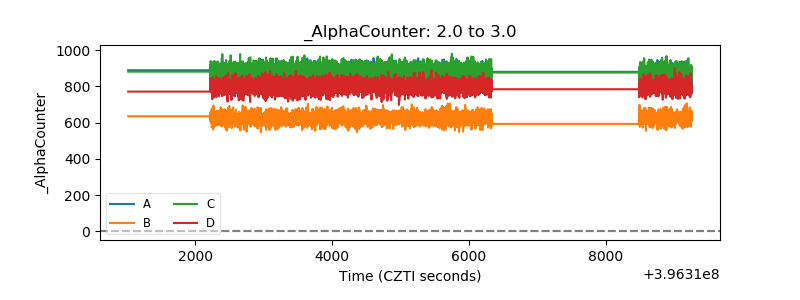 |
| _CPM_Rate | 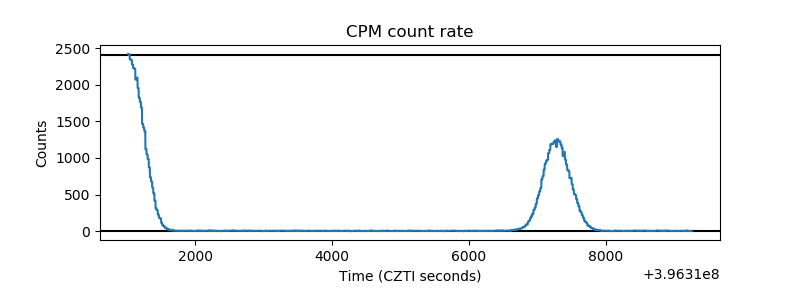 |
| CZT Counter | 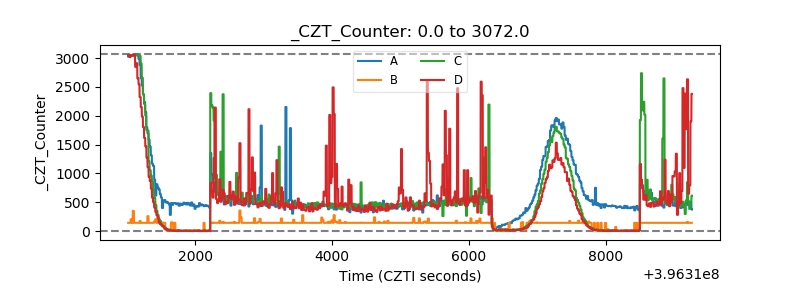 |
| +2.5 Volts monitor | 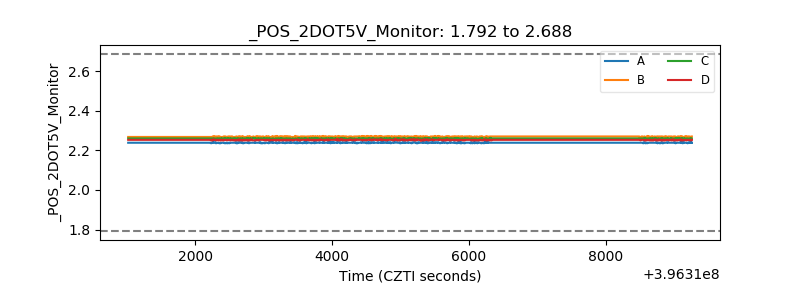 |
| +5 Volts monitor |  |
| _ROLL_ROT | 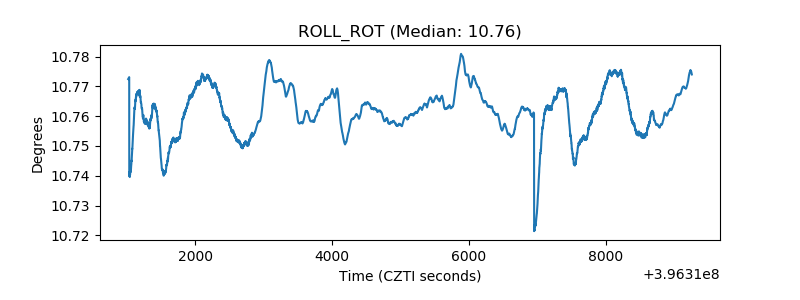 |
| _Roll_DEC | 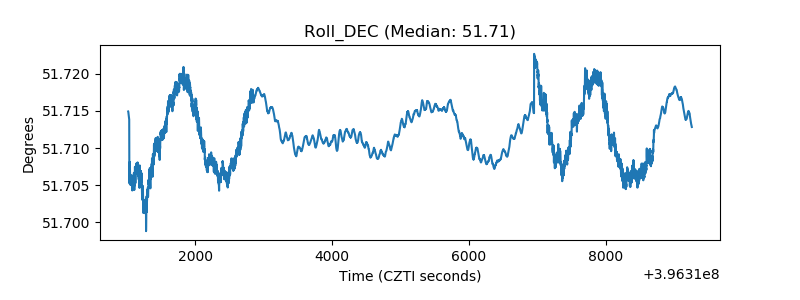 |
| _Roll_RA | 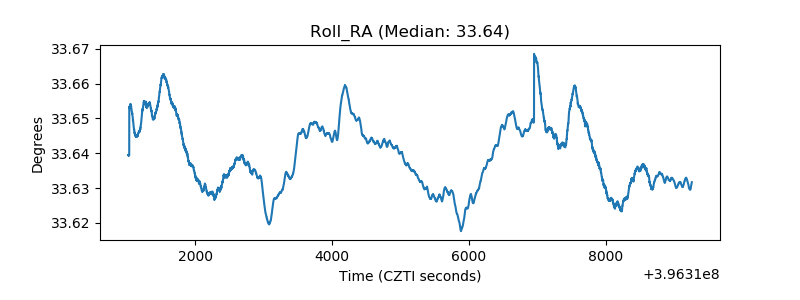 |
| Veto Counter | 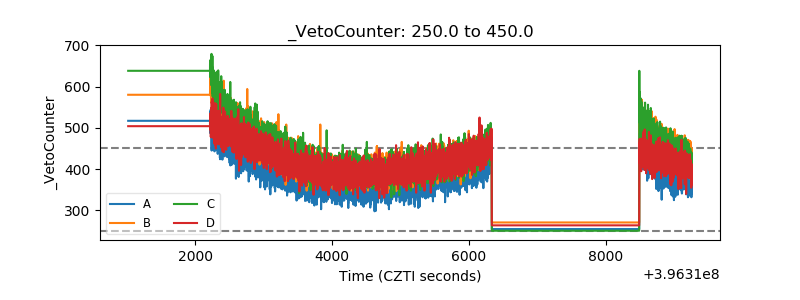 |