| Param | Original file | Final file |
|---|---|---|
| Filename | modeM0/AS1A11_075T01_9000005244_36873cztM0_level2.evt | modeM0/AS1A11_075T01_9000005244_36873cztM0_level2_quad_clean.evt |
| Size (bytes) | 250,539,840 | 33,704,640 |
| Size | 238.9 MB | 32.1 MB |
| Events in quadrant A | 2,022,343 | 246,561 |
| Events in quadrant B | 638,615 | 4,241 |
| Events in quadrant C | 2,019,503 | 254,994 |
| Events in quadrant D | 2,624,517 | 225,867 |
| Mode SS | |||
|---|---|---|---|
| Quadrant | BADHDUFLAG | Total packets | Discarded packets |
| A | 0 | 89 | 5 |
| B | 0 | 89 | 5 |
| C | 0 | 90 | 8 |
| D | 0 | 90 | 8 |
| Mode M0 | |||
|---|---|---|---|
| Quadrant | BADHDUFLAG | Total packets | Discarded packets |
| A | 0 | 9237 | 674 |
| B | 0 | 4484 | 253 |
| C | 0 | 9184 | 619 |
| D | 0 | 11676 | 919 |
| Mode M9 | |||
|---|---|---|---|
| Quadrant | BADHDUFLAG | Total packets | Discarded packets |
| A | 0 | 15 | 0 |
| B | 0 | 15 | 0 |
| C | 0 | 15 | 0 |
| D | 0 | 15 | 0 |
| Quadrant | Total seconds | Saturated seconds | Saturation percentage |
|---|---|---|---|
| A | 4049 | 24 | 0.592739% |
| B | 4131 | 4131 | 100.000000% |
| C | 4071 | 7 | 0.171948% |
| D | 4047 | 268 | 6.622189% |
Noise dominated data is calculated using 1-second bins in cleaned event files. If a bin has >2000 counts, and if more than 50% of those come from <1% of pixels, then it is considered to be noise-dominated and hence unusable.
| Quadrant | # 1 sec bins | Bins with >0 counts | Bins with >2000 counts | High rate bins dominated by noise | Noise dominated (total time) | Noise dominated (detector-on time) | Marked lightcurve |
|---|---|---|---|---|---|---|---|
| A | 5850 | 4127 | 8 | 8 | 0.14% | 0.19% | 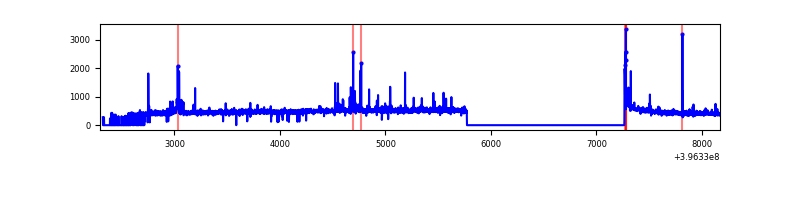 |
| B | 5867 | 4130 | 0 | 0 | 0.00% | 0.00% | 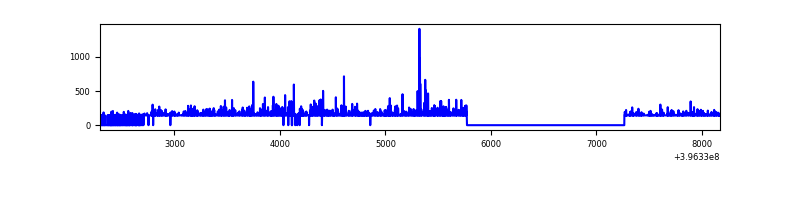 |
| C | 5877 | 4160 | 6 | 6 | 0.10% | 0.14% | 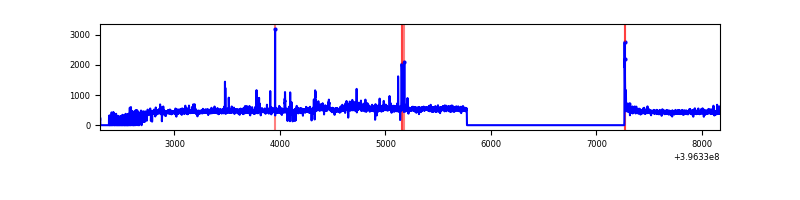 |
| D | 5827 | 4126 | 215 | 215 | 3.69% | 5.21% | 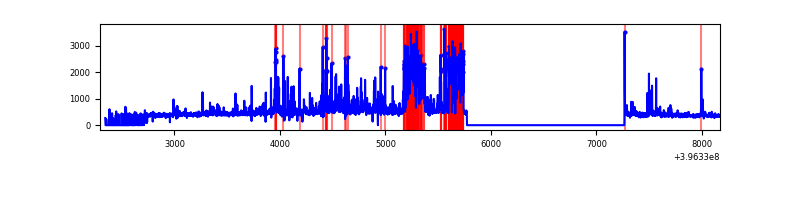 |
Top three noisy pixels from each quadrant. If the there are fewer than three noisy pixels in the level2.evt file, extra rows are filled as -1
| Pixel properties | Quadrant properties | ||||||
|---|---|---|---|---|---|---|---|
| Quadrant | DetID | PixID | Counts | Sigma | Mean | Median | Sigma |
| A | 10 | 83 | 153026 | 1646.3 | 453 | 444 | 92.7 |
| A | 9 | 143 | 57204 | 612.42 | 453 | 444 | 92.7 |
| A | 13 | 248 | 32850 | 349.65 | 453 | 444 | 92.7 |
| B | 12 | 243 | 571390 | 157232.81 | 9 | 9 | 3.6 |
| B | 12 | 144 | 10820 | 2974.97 | 9 | 9 | 3.6 |
| B | 4 | 232 | 4078 | 1119.71 | 9 | 9 | 3.6 |
| C | 15 | 214 | 174601 | 1689.9 | 442 | 445 | 103.1 |
| C | 0 | 239 | 37456 | 359.13 | 442 | 445 | 103.1 |
| C | 0 | 10 | 34677 | 332.17 | 442 | 445 | 103.1 |
| D | 2 | 249 | 639875 | 6139.33 | 426 | 414 | 104.2 |
| D | 12 | 233 | 91597 | 875.43 | 426 | 414 | 104.2 |
| D | 2 | 250 | 55004 | 524.11 | 426 | 414 | 104.2 |
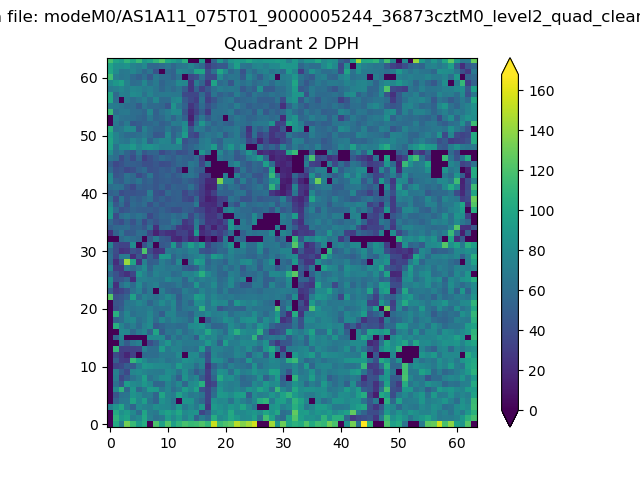
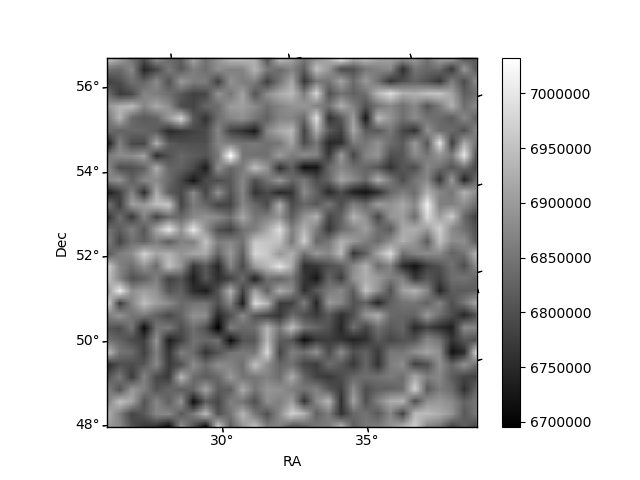
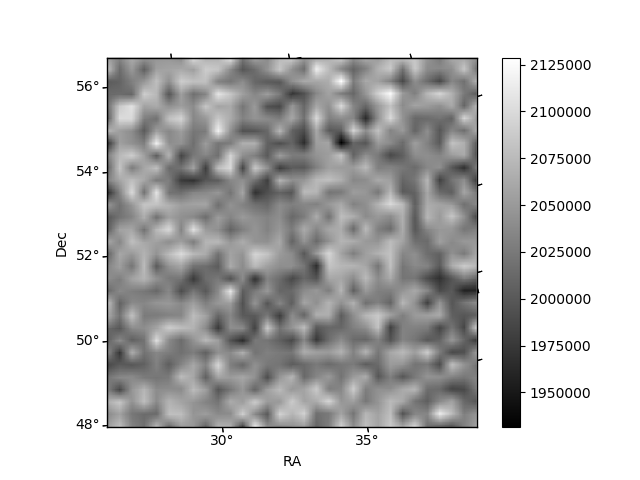
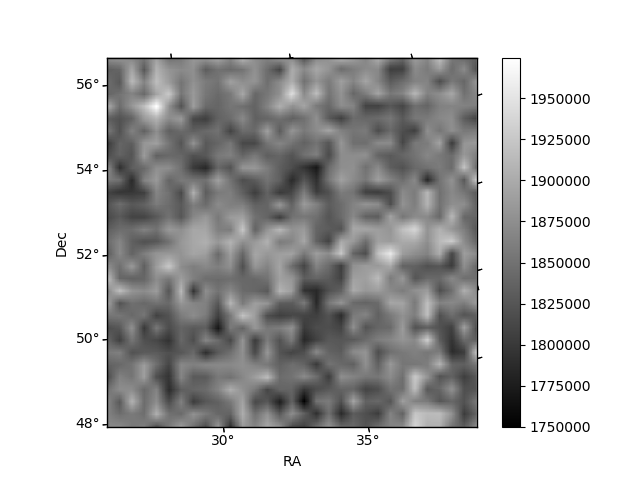
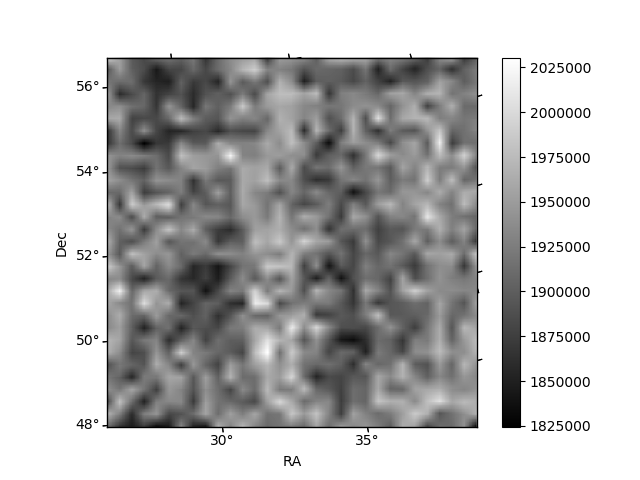
Histogram calculated using DETX and DETY for each event in the final _common_clean file
| Quadrant A | 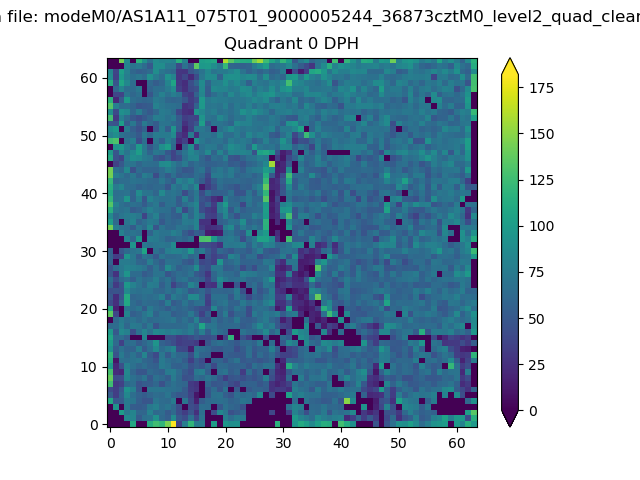 |
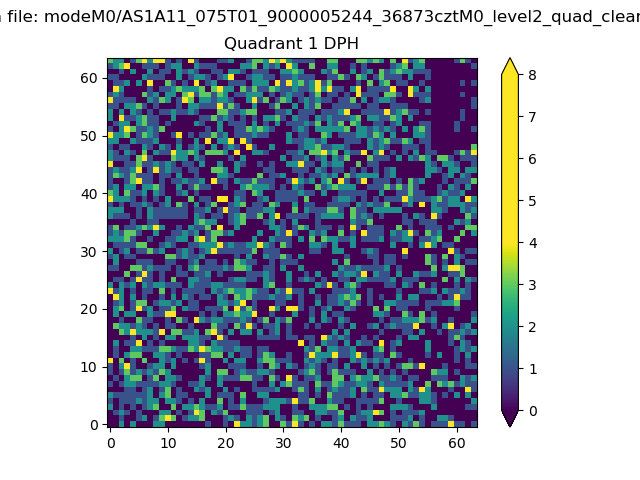 |
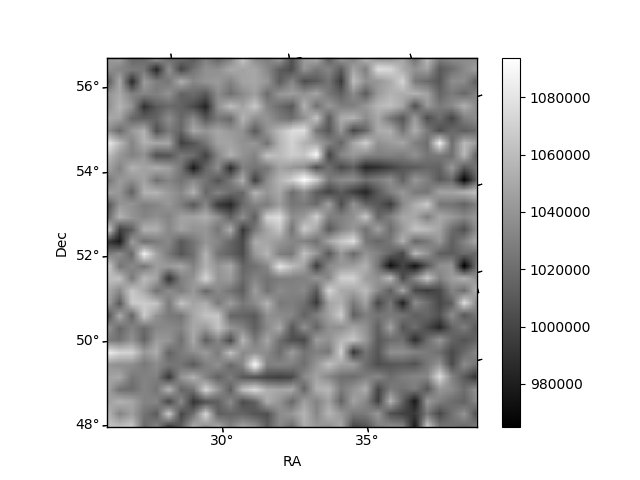
Quadrant B |
|---|---|---|---|
| Quadrant D | 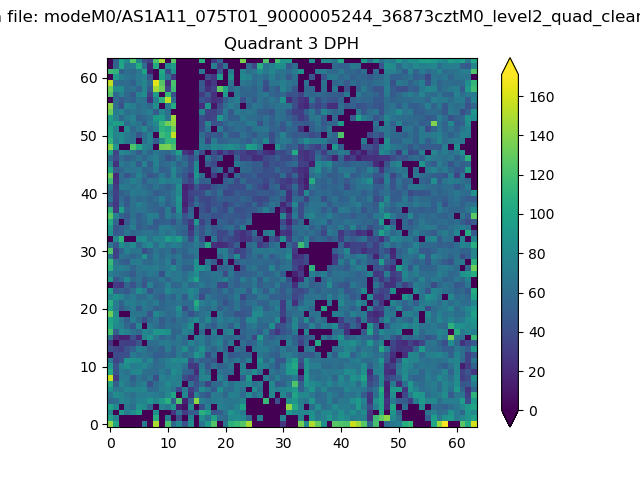 |
 |
Quadrant C |
| Plot type | Count rate plots | Images |
|---|---|---|
| Comparison with Poisson distribution Blue bars denote a histogram of data divided into 1 sec bins. Red curve is a Poisson curve with rate = median count rate of data. |
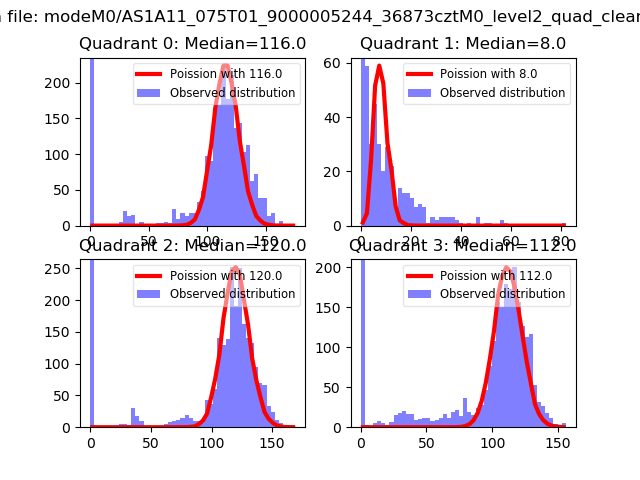 |
 |
| Quadrant-wise count rates Data is divided into 100 sec bins |
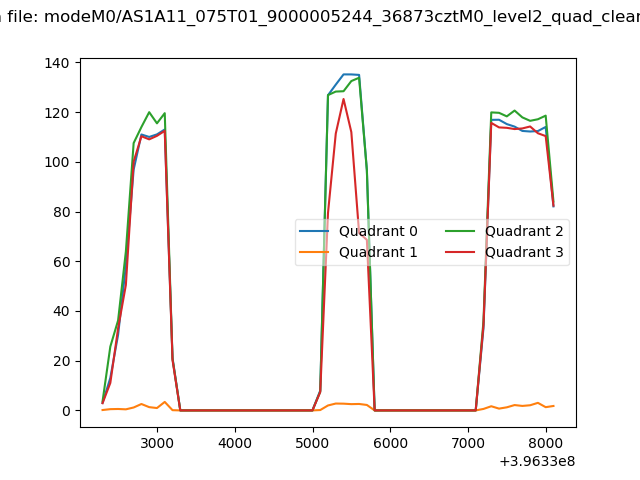 |
|
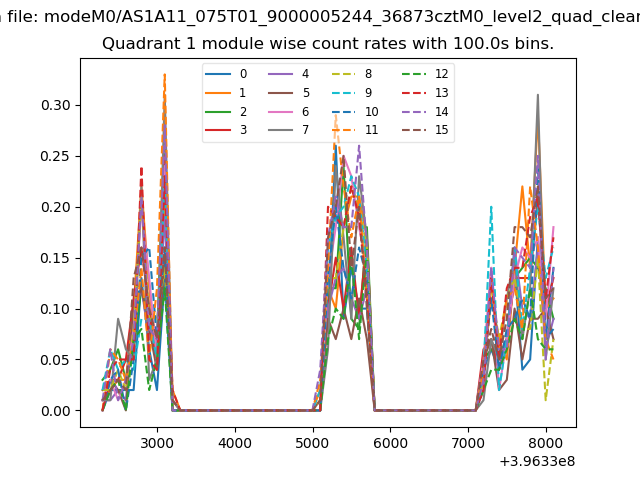
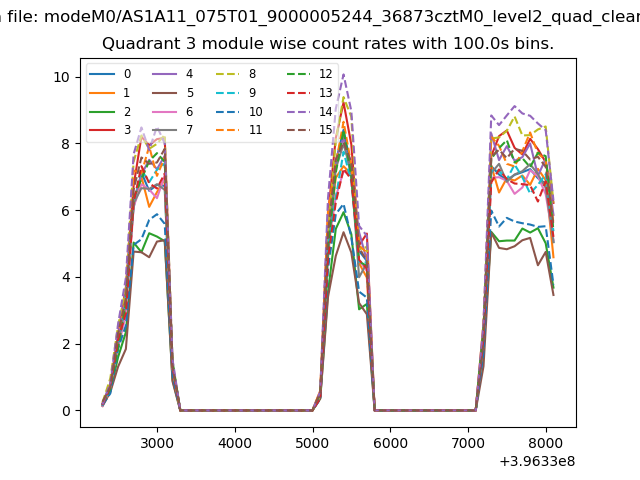
| Module-wise count rates for Quadrant A Data is divided into 100 sec bins |
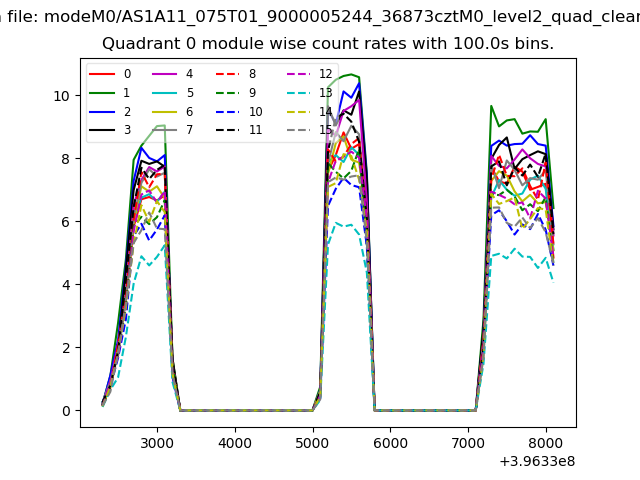 |
 |
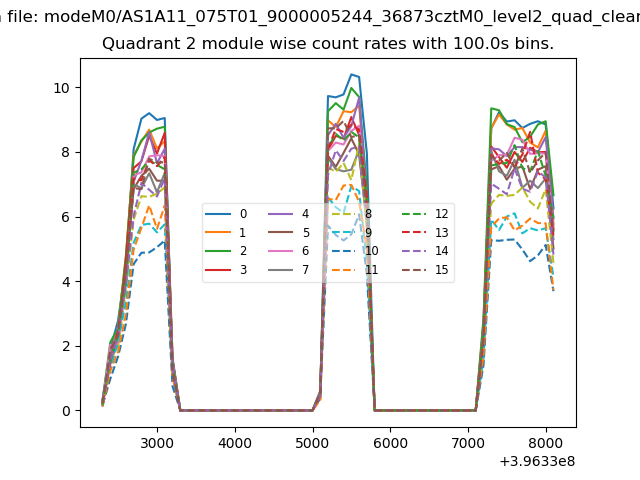
| Module-wise count rates for Quadrant B Data is divided into 100 sec bins |
 |
 |
| Module-wise count rates for Quadrant C Data is divided into 100 sec bins |
 |
 |
| Module-wise count rates for Quadrant D Data is divided into 100 sec bins |
 |
 |
| Parameter | Plot |
|---|---|
| CZT HV Monitor | 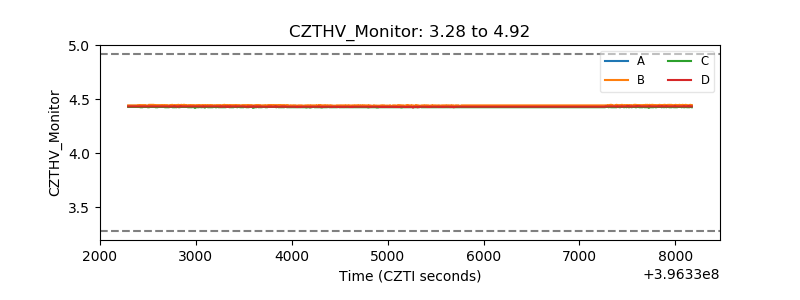 |
| D_VDD | 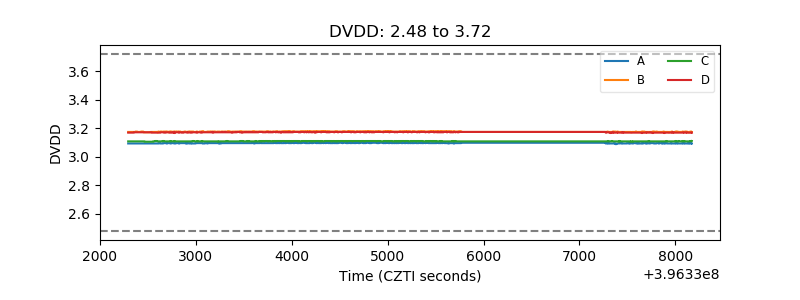 |
| Temperature 1 | 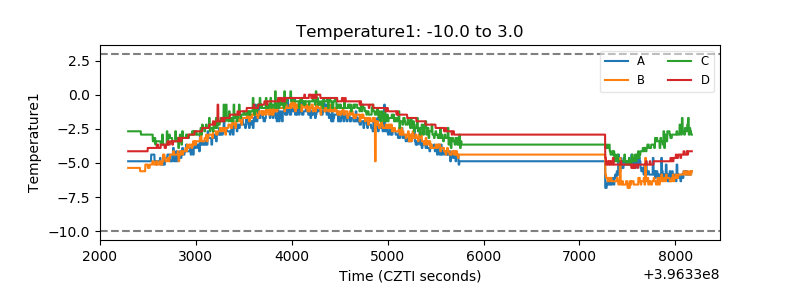 |
| Veto HV Monitor | 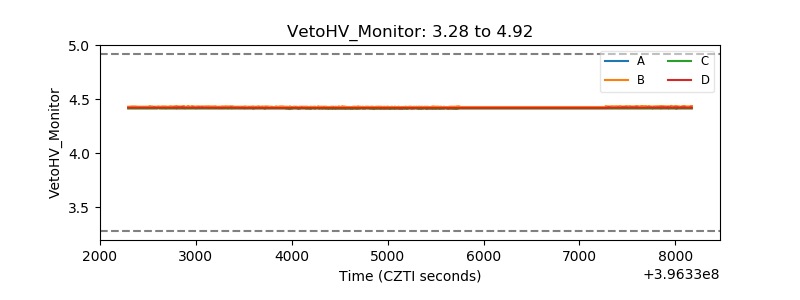 |
| Veto LLD |  |
| Alpha Counter | 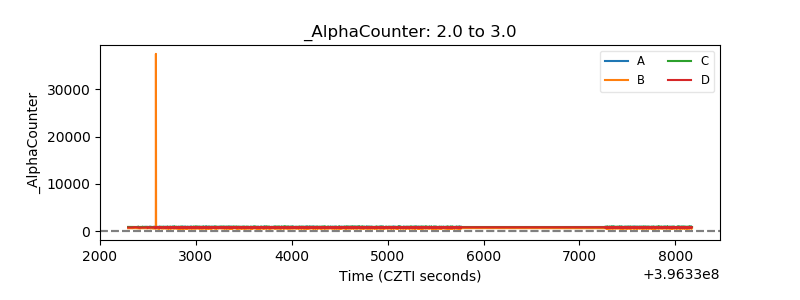 |
| _CPM_Rate |  |
| CZT Counter | 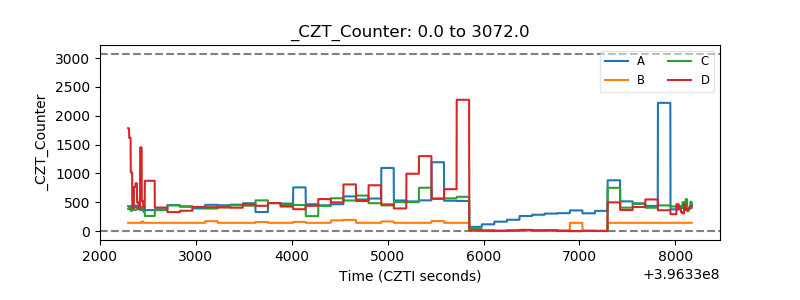 |
| +2.5 Volts monitor |  |
| +5 Volts monitor |  |
| _ROLL_ROT | 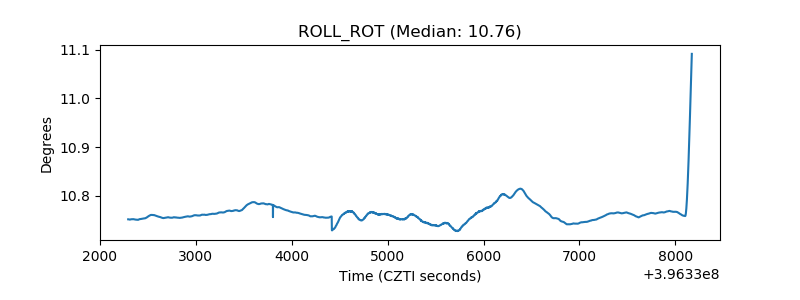 |
| _Roll_DEC | 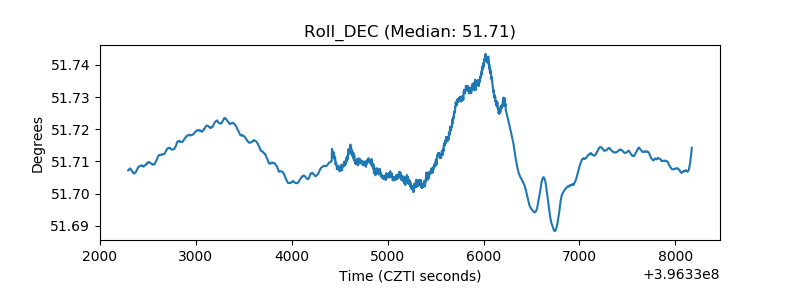 |
| _Roll_RA | 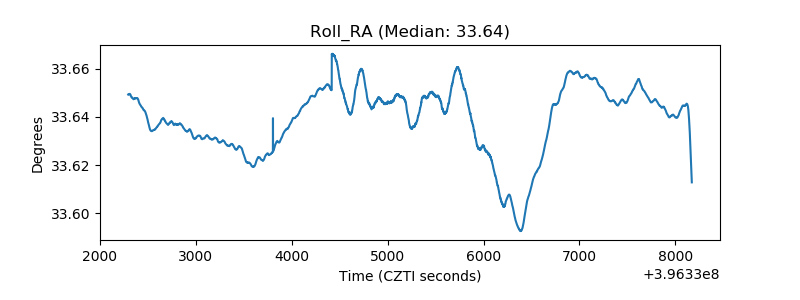 |
| Veto Counter | 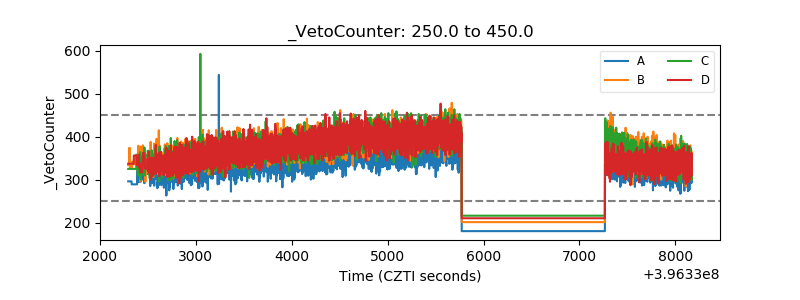 |