| Param | Original file | Final file |
|---|---|---|
| Filename | modeM0/AS1A11_075T01_9000005244_36874cztM0_level2.evt | modeM0/AS1A11_075T01_9000005244_36874cztM0_level2_quad_clean.evt |
| Size (bytes) | 364,538,880 | 59,463,360 |
| Size | 347.7 MB | 56.7 MB |
| Events in quadrant A | 2,845,721 | 459,913 |
| Events in quadrant B | 902,417 | 7,378 |
| Events in quadrant C | 2,818,453 | 471,831 |
| Events in quadrant D | 4,064,888 | 446,093 |
| Mode SS | |||
|---|---|---|---|
| Quadrant | BADHDUFLAG | Total packets | Discarded packets |
| A | 0 | 120 | 0 |
| B | 0 | 120 | 0 |
| C | 0 | 120 | 0 |
| D | 0 | 120 | 0 |
| Mode M0 | |||
|---|---|---|---|
| Quadrant | BADHDUFLAG | Total packets | Discarded packets |
| A | 0 | 12330 | 6 |
| B | 0 | 6018 | 2 |
| C | 0 | 12183 | 20 |
| D | 0 | 16570 | 3 |
| Mode M9 | |||
|---|---|---|---|
| Quadrant | BADHDUFLAG | Total packets | Discarded packets |
| A | 0 | 16 | 0 |
| B | 0 | 16 | 0 |
| C | 0 | 16 | 0 |
| D | 0 | 17 | 0 |
| Quadrant | Total seconds | Saturated seconds | Saturation percentage |
|---|---|---|---|
| A | 5916 | 18 | 0.304260% |
| B | 5918 | 5918 | 100.000000% |
| C | 5907 | 23 | 0.389369% |
| D | 5917 | 236 | 3.988508% |
Noise dominated data is calculated using 1-second bins in cleaned event files. If a bin has >2000 counts, and if more than 50% of those come from <1% of pixels, then it is considered to be noise-dominated and hence unusable.
| Quadrant | # 1 sec bins | Bins with >0 counts | Bins with >2000 counts | High rate bins dominated by noise | Noise dominated (total time) | Noise dominated (detector-on time) | Marked lightcurve |
|---|---|---|---|---|---|---|---|
| A | 7231 | 5918 | 10 | 10 | 0.14% | 0.17% | 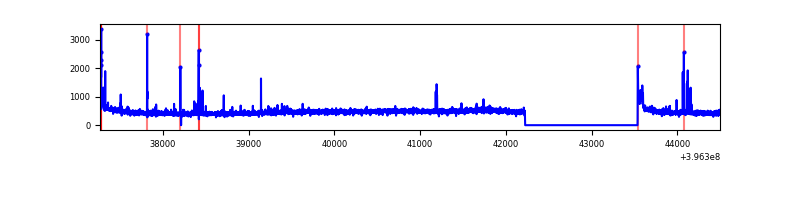 |
| B | 7230 | 5917 | 0 | 0 | 0.00% | 0.00% | 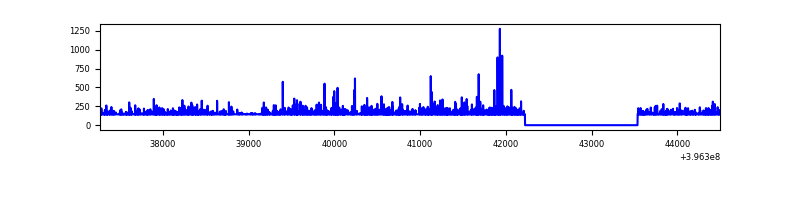 |
| C | 7231 | 5915 | 15 | 15 | 0.21% | 0.25% | 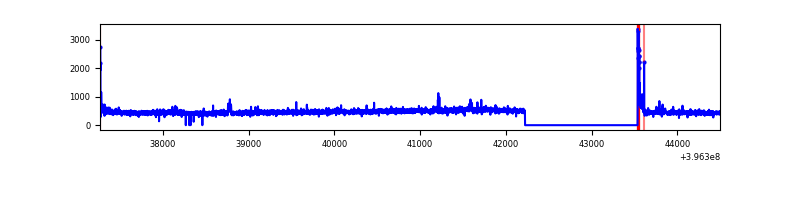 |
| D | 7231 | 5919 | 190 | 190 | 2.63% | 3.21% | 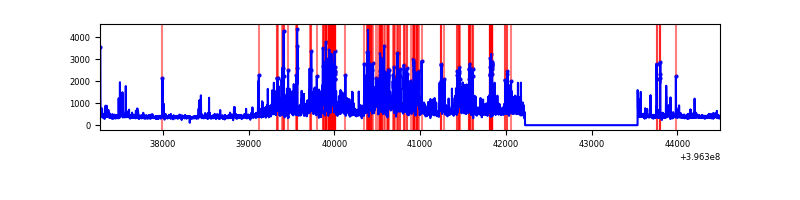 |
Top three noisy pixels from each quadrant. If the there are fewer than three noisy pixels in the level2.evt file, extra rows are filled as -1
| Pixel properties | Quadrant properties | ||||||
|---|---|---|---|---|---|---|---|
| Quadrant | DetID | PixID | Counts | Sigma | Mean | Median | Sigma |
| A | 10 | 83 | 242499 | 1880.81 | 642 | 630 | 128.6 |
| A | 9 | 143 | 68640 | 528.85 | 642 | 630 | 128.6 |
| A | 13 | 6 | 17057 | 127.74 | 642 | 630 | 128.6 |
| B | 12 | 243 | 820804 | 195449.19 | 12 | 12 | 4.2 |
| B | 12 | 144 | 15385 | 3660.66 | 12 | 12 | 4.2 |
| B | 4 | 81 | 3747 | 889.39 | 12 | 12 | 4.2 |
| C | 15 | 214 | 253552 | 1718.98 | 627 | 630 | 147.1 |
| C | 0 | 10 | 77936 | 525.41 | 627 | 630 | 147.1 |
| C | 3 | 233 | 23620 | 156.25 | 627 | 630 | 147.1 |
| D | 12 | 227 | 757697 | 5055.54 | 615 | 599 | 149.8 |
| D | 12 | 233 | 331660 | 2210.67 | 615 | 599 | 149.8 |
| D | 13 | 249 | 250456 | 1668.43 | 615 | 599 | 149.8 |
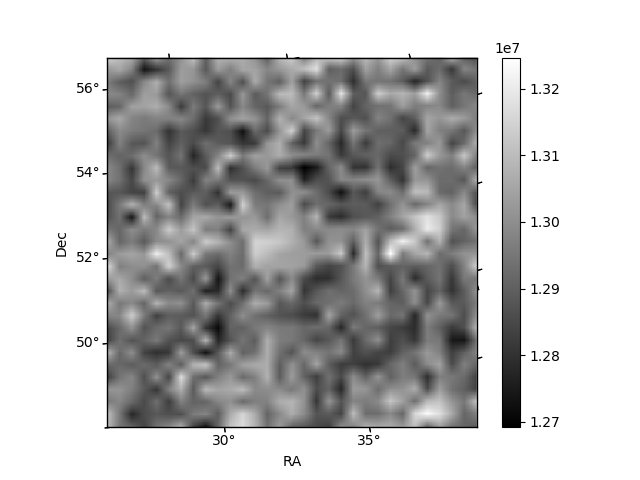
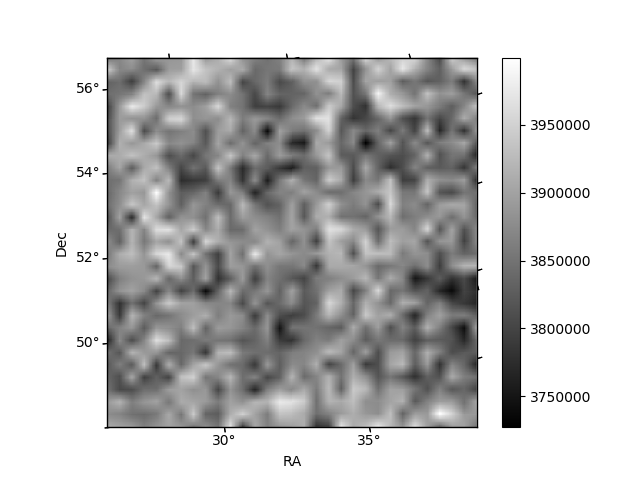
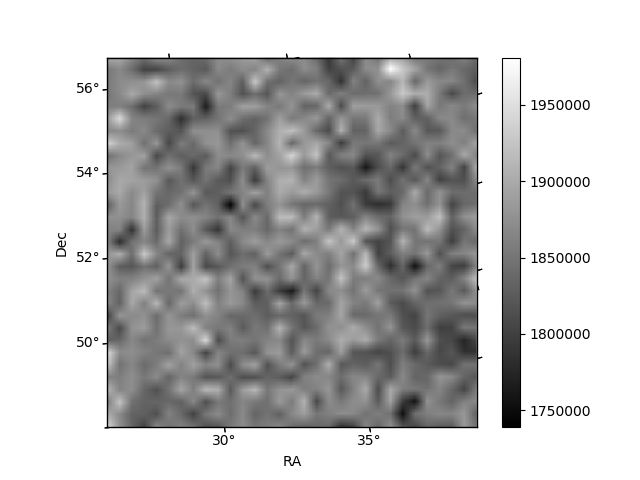
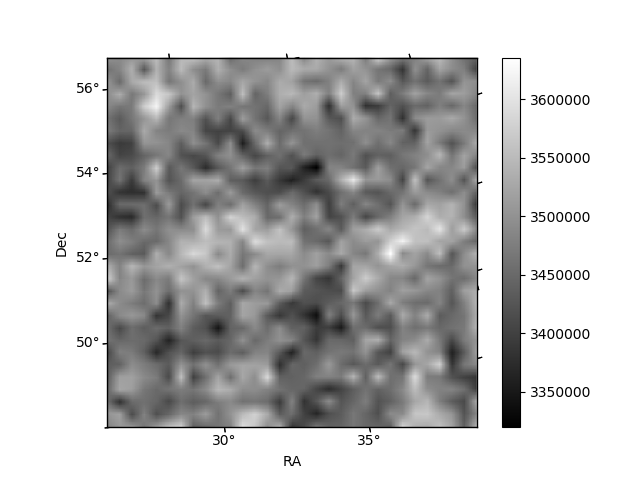
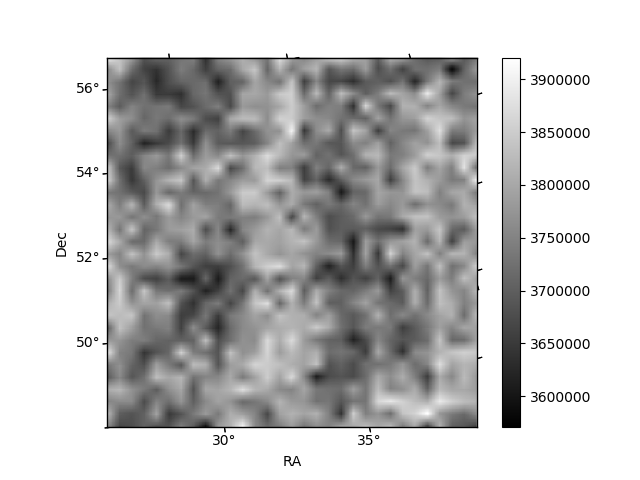
Histogram calculated using DETX and DETY for each event in the final _common_clean file
| Quadrant A | 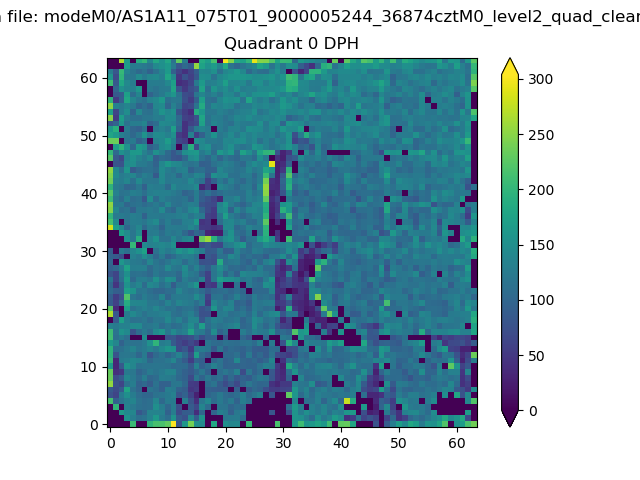 |
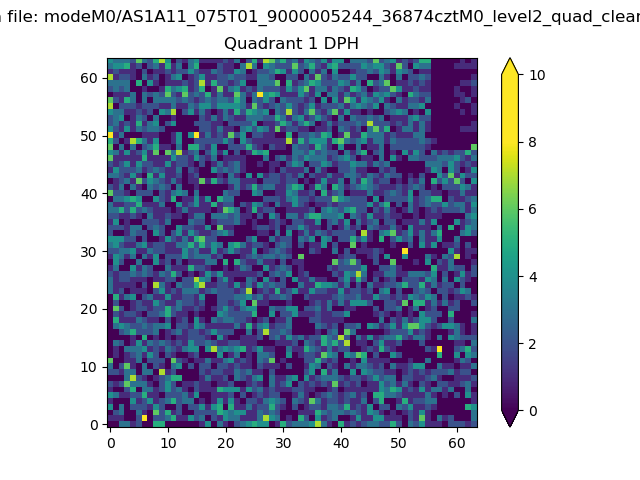 |
Quadrant B |
|---|---|---|---|
| Quadrant D | 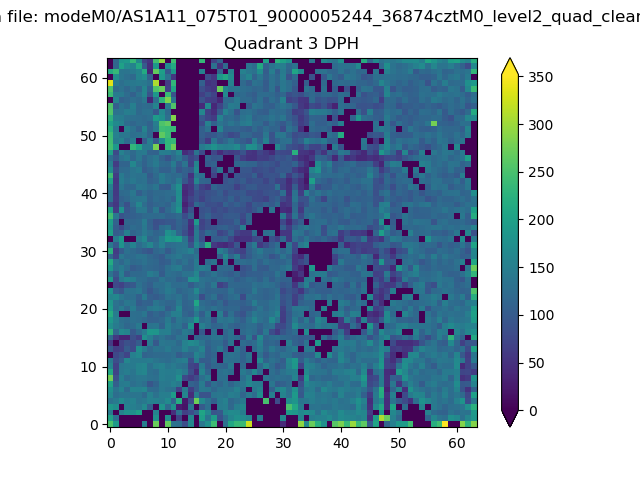 |
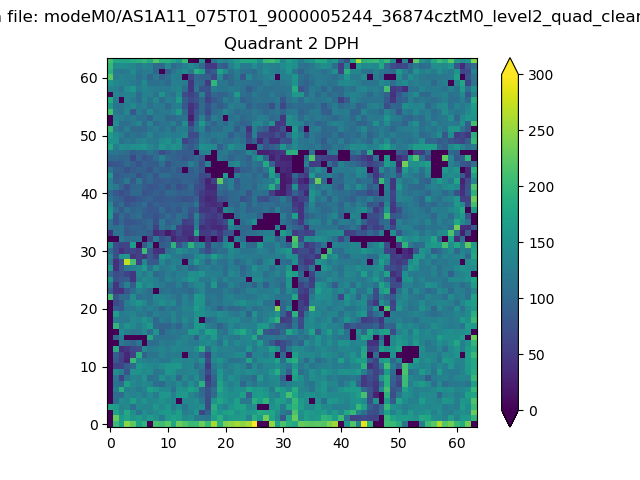 |
Quadrant C |
| Plot type | Count rate plots | Images |
|---|---|---|
| Comparison with Poisson distribution Blue bars denote a histogram of data divided into 1 sec bins. Red curve is a Poisson curve with rate = median count rate of data. |
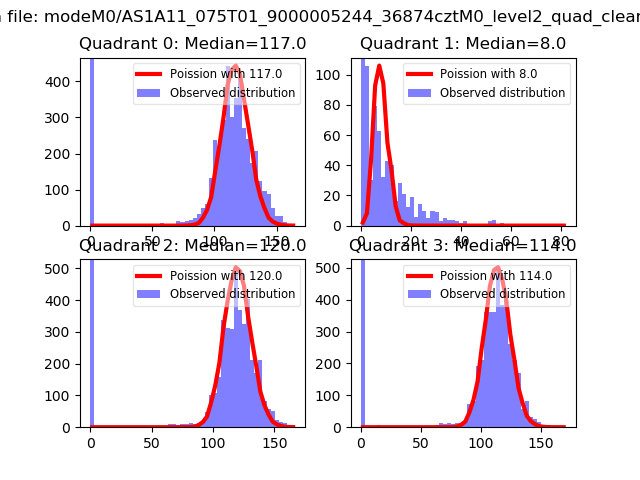 |
 |
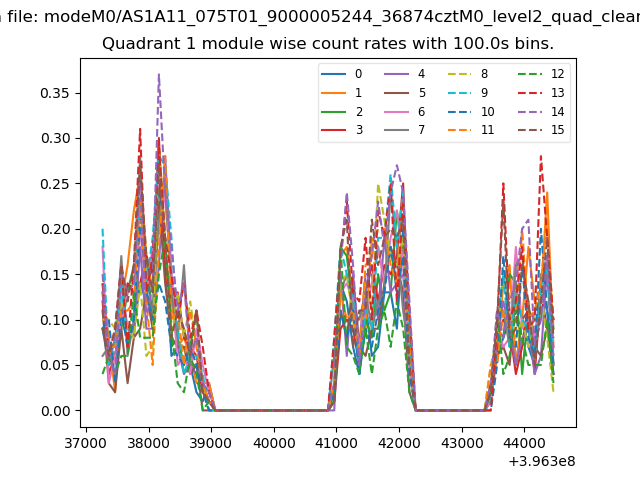
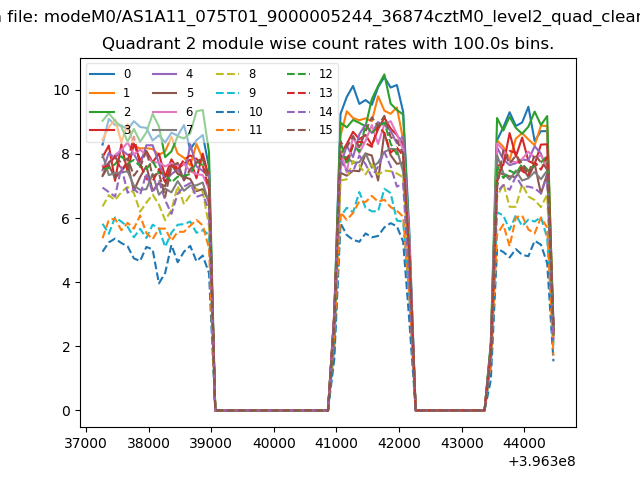
| Quadrant-wise count rates Data is divided into 100 sec bins |
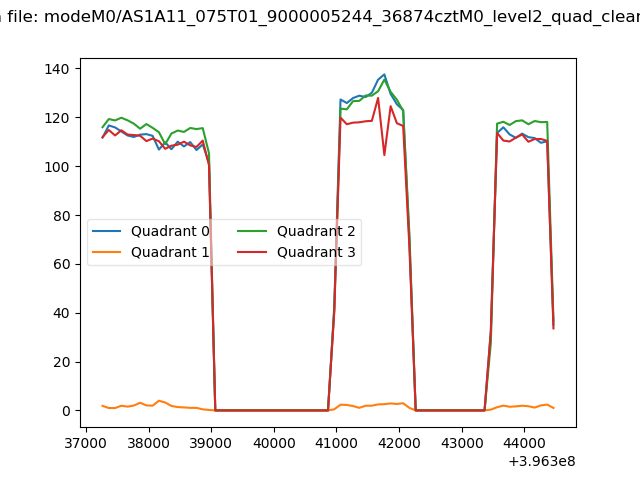 |
|
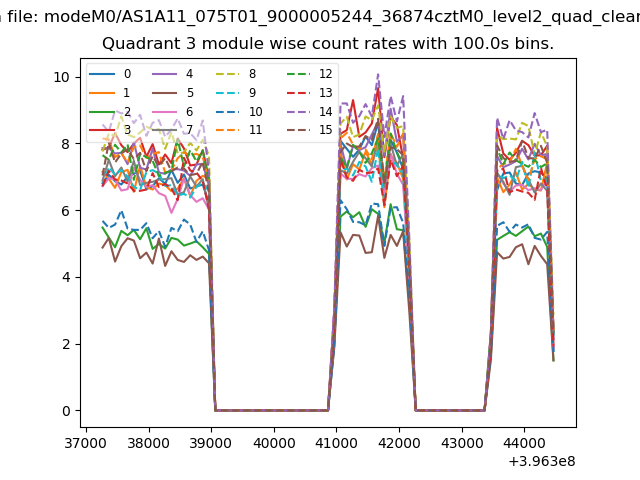
| Module-wise count rates for Quadrant A Data is divided into 100 sec bins |
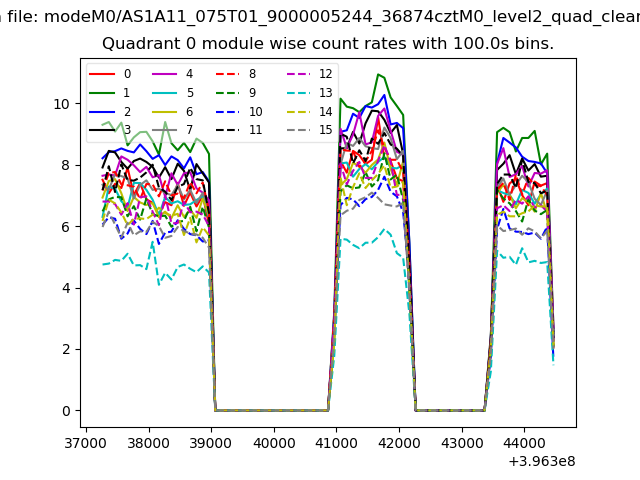 |
 |
| Module-wise count rates for Quadrant B Data is divided into 100 sec bins |
 |
 |
| Module-wise count rates for Quadrant C Data is divided into 100 sec bins |
 |
 |
| Module-wise count rates for Quadrant D Data is divided into 100 sec bins |
 |
 |
| Parameter | Plot |
|---|---|
| CZT HV Monitor | 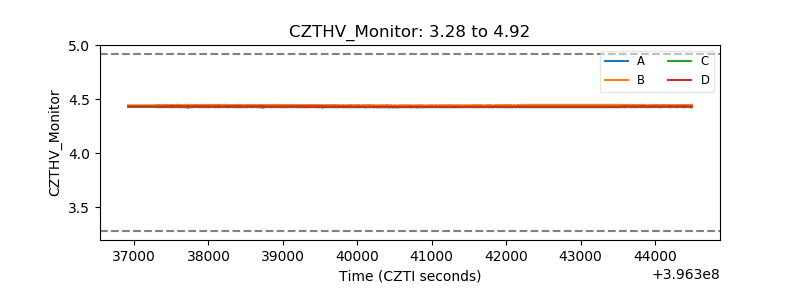 |
| D_VDD | 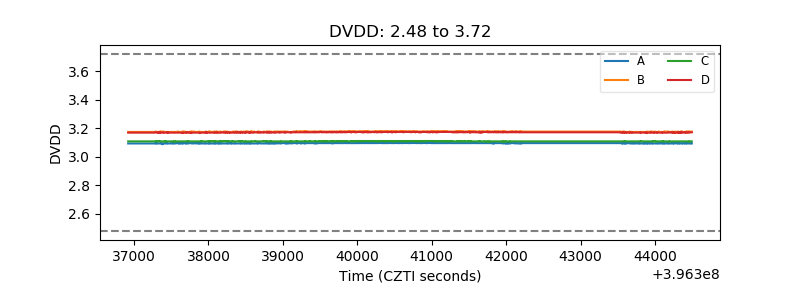 |
| Temperature 1 | 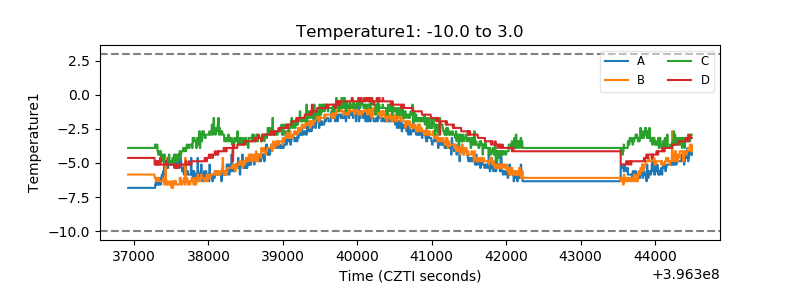 |
| Veto HV Monitor | 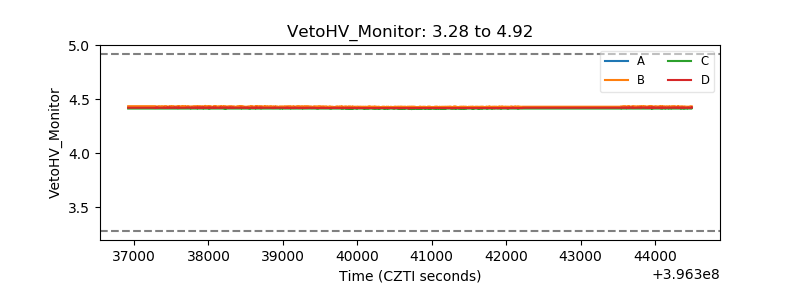 |
| Veto LLD | 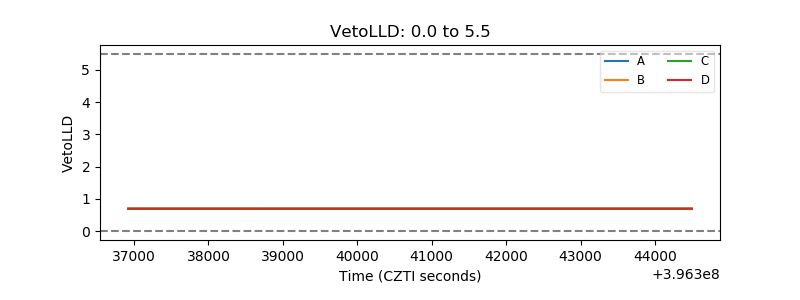 |
| Alpha Counter | 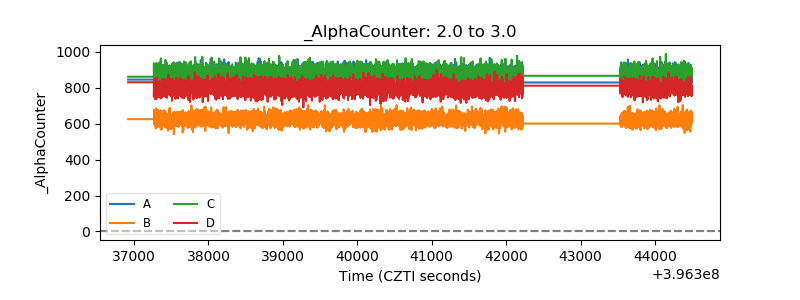 |
| _CPM_Rate | 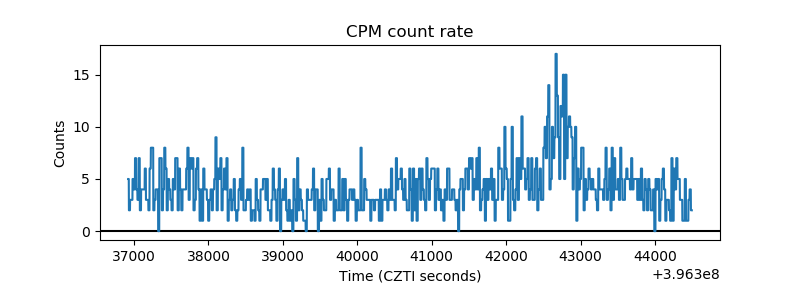 |
| CZT Counter | 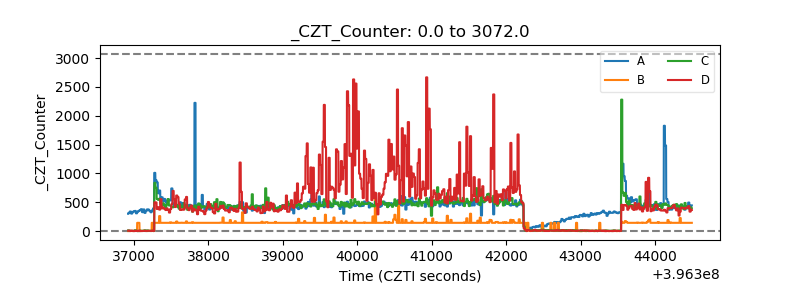 |
| +2.5 Volts monitor | 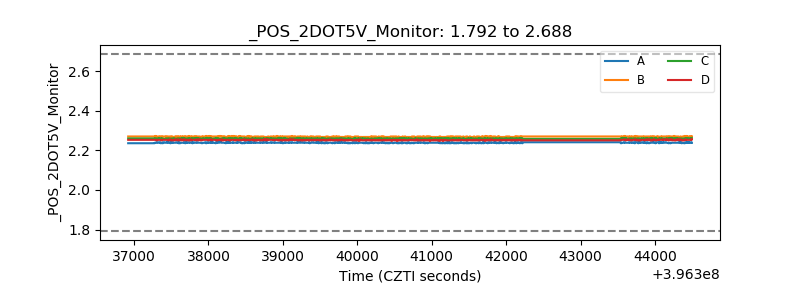 |
| +5 Volts monitor |  |
| _ROLL_ROT | 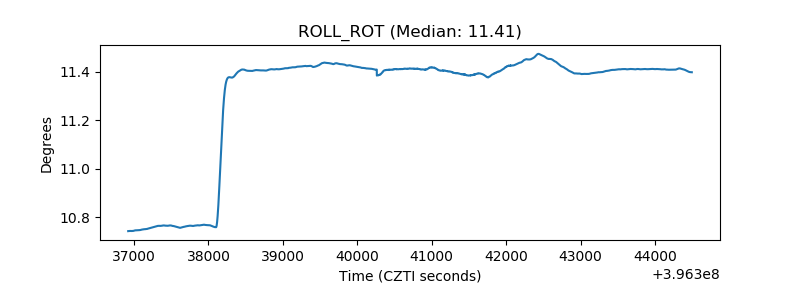 |
| _Roll_DEC | 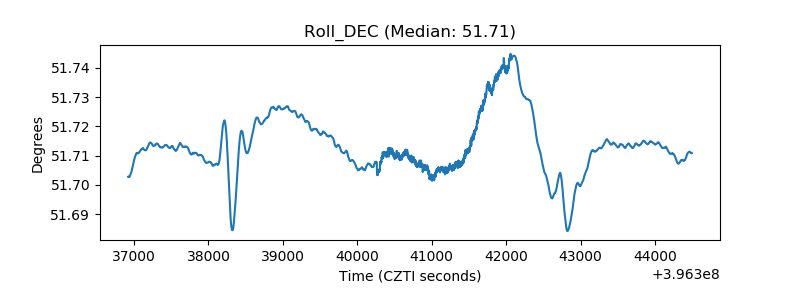 |
| _Roll_RA | 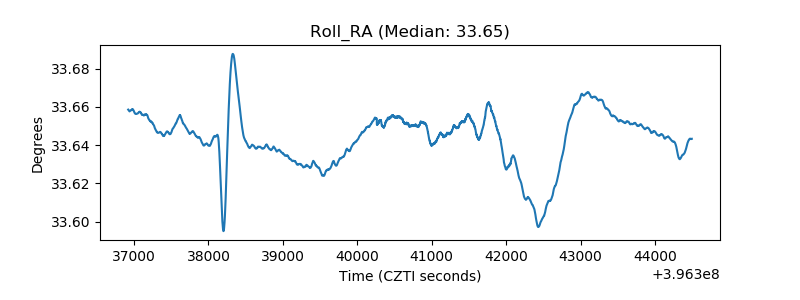 |
| Veto Counter | 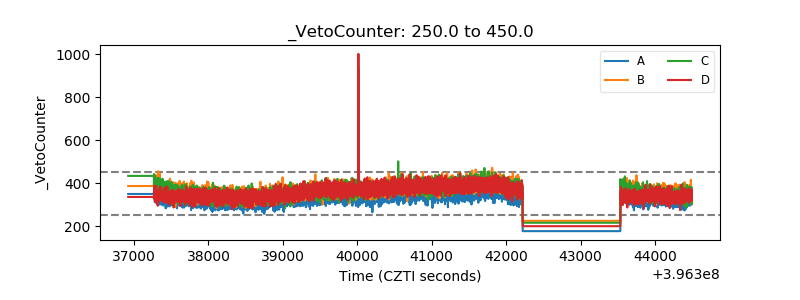 |