| Param | Original file | Final file |
|---|---|---|
| Filename | modeM0/AS1A11_075T01_9000005244_36877cztM0_level2.evt | modeM0/AS1A11_075T01_9000005244_36877cztM0_level2_quad_clean.evt |
| Size (bytes) | 660,896,640 | 94,826,880 |
| Size | 630.3 MB | 90.4 MB |
| Events in quadrant A | 5,184,847 | 708,662 |
| Events in quadrant B | 1,673,514 | 12,872 |
| Events in quadrant C | 5,640,476 | 713,244 |
| Events in quadrant D | 6,768,373 | 681,045 |
| Mode SS | |||
|---|---|---|---|
| Quadrant | BADHDUFLAG | Total packets | Discarded packets |
| A | 0 | 222 | 0 |
| B | 0 | 222 | 0 |
| C | 0 | 222 | 0 |
| D | 0 | 222 | 0 |
| Mode M0 | |||
|---|---|---|---|
| Quadrant | BADHDUFLAG | Total packets | Discarded packets |
| A | 0 | 22336 | 4 |
| B | 0 | 11094 | 3 |
| C | 0 | 23443 | 3 |
| D | 0 | 27624 | 3 |
| Mode M9 | |||
|---|---|---|---|
| Quadrant | BADHDUFLAG | Total packets | Discarded packets |
| A | 0 | 33 | 0 |
| B | 0 | 33 | 0 |
| C | 0 | 33 | 0 |
| D | 0 | 34 | 0 |
| Quadrant | Total seconds | Saturated seconds | Saturation percentage |
|---|---|---|---|
| A | 10867 | 17 | 0.156437% |
| B | 10867 | 10867 | 100.000000% |
| C | 10867 | 98 | 0.901813% |
| D | 10867 | 409 | 3.763688% |
Noise dominated data is calculated using 1-second bins in cleaned event files. If a bin has >2000 counts, and if more than 50% of those come from <1% of pixels, then it is considered to be noise-dominated and hence unusable.
| Quadrant | # 1 sec bins | Bins with >0 counts | Bins with >2000 counts | High rate bins dominated by noise | Noise dominated (total time) | Noise dominated (detector-on time) | Marked lightcurve |
|---|---|---|---|---|---|---|---|
| A | 13643 | 10869 | 3 | 3 | 0.02% | 0.03% | 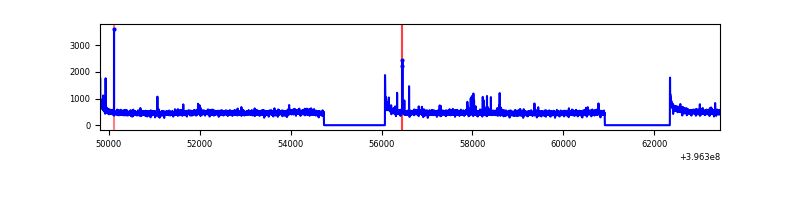 |
| B | 13642 | 10866 | 0 | 0 | 0.00% | 0.00% | 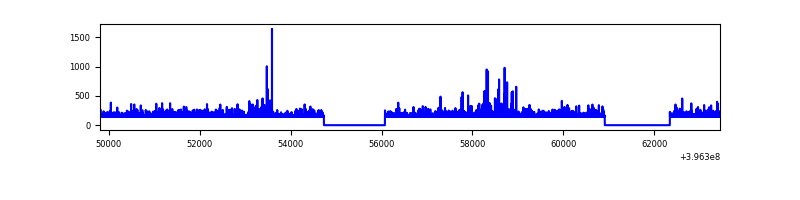 |
| C | 13643 | 10869 | 75 | 75 | 0.55% | 0.69% | 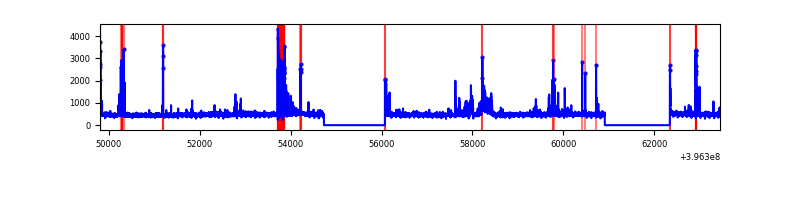 |
| D | 13643 | 10869 | 364 | 364 | 2.67% | 3.35% | 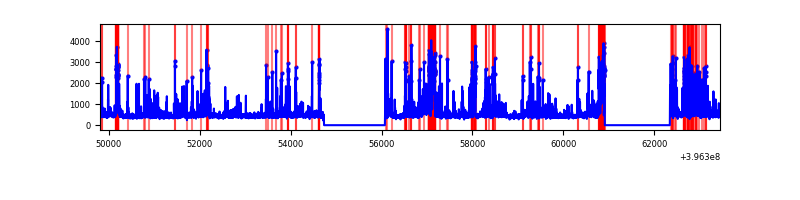 |
Top three noisy pixels from each quadrant. If the there are fewer than three noisy pixels in the level2.evt file, extra rows are filled as -1
| Pixel properties | Quadrant properties | ||||||
|---|---|---|---|---|---|---|---|
| Quadrant | DetID | PixID | Counts | Sigma | Mean | Median | Sigma |
| A | 10 | 83 | 423593 | 1730.39 | 1208 | 1182 | 244.1 |
| A | 13 | 6 | 35537 | 140.73 | 1208 | 1182 | 244.1 |
| A | 9 | 143 | 27506 | 107.83 | 1208 | 1182 | 244.1 |
| B | 12 | 243 | 1504177 | 213712.8 | 26 | 25 | 7.0 |
| B | 12 | 144 | 28444 | 4037.83 | 26 | 25 | 7.0 |
| B | 5 | 172 | 6882 | 974.26 | 26 | 25 | 7.0 |
| C | 15 | 214 | 462847 | 1702.45 | 1173 | 1181 | 271.2 |
| C | 15 | 208 | 199312 | 730.63 | 1173 | 1181 | 271.2 |
| C | 0 | 239 | 130922 | 478.43 | 1173 | 1181 | 271.2 |
| D | 13 | 249 | 762816 | 2669.75 | 1164 | 1132 | 285.3 |
| D | 13 | 171 | 453917 | 1587.04 | 1164 | 1132 | 285.3 |
| D | 12 | 233 | 401115 | 1401.97 | 1164 | 1132 | 285.3 |
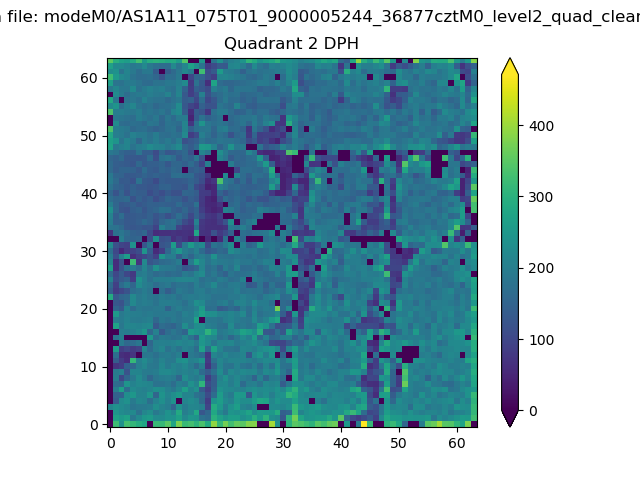
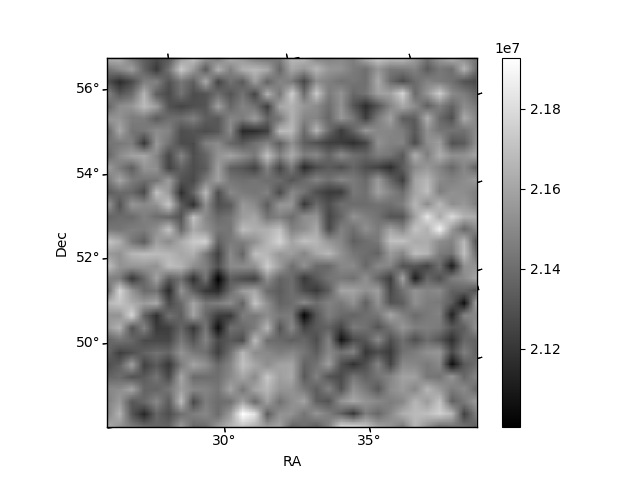
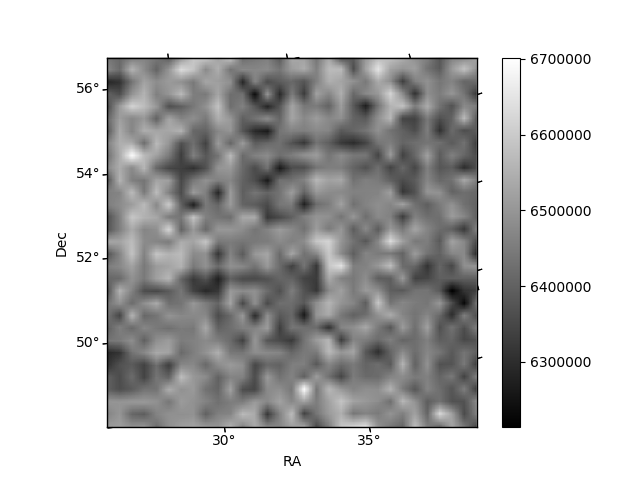
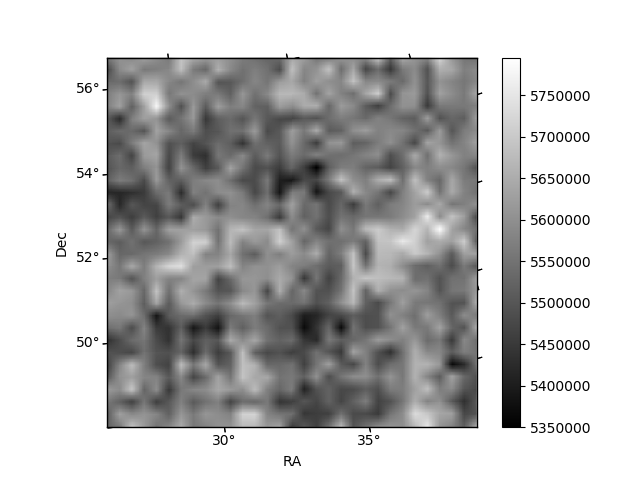
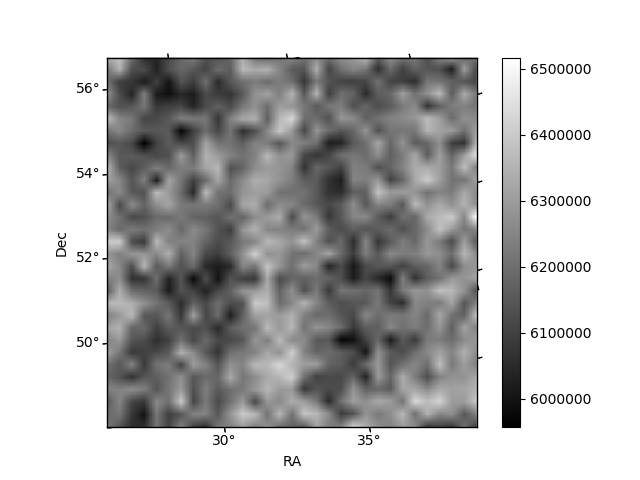
Histogram calculated using DETX and DETY for each event in the final _common_clean file
| Quadrant A | 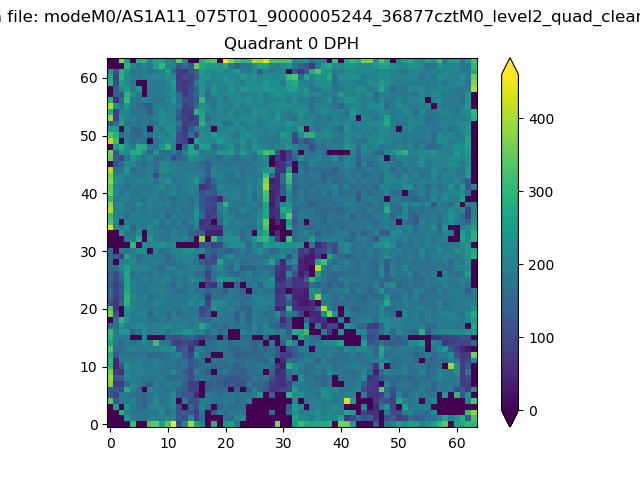 |
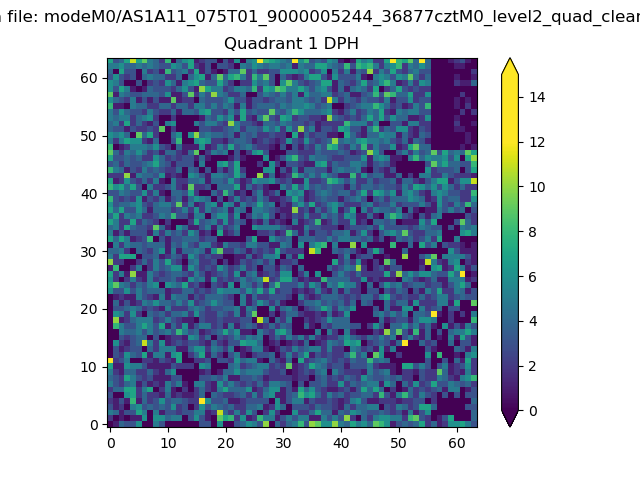 |
Quadrant B |
|---|---|---|---|
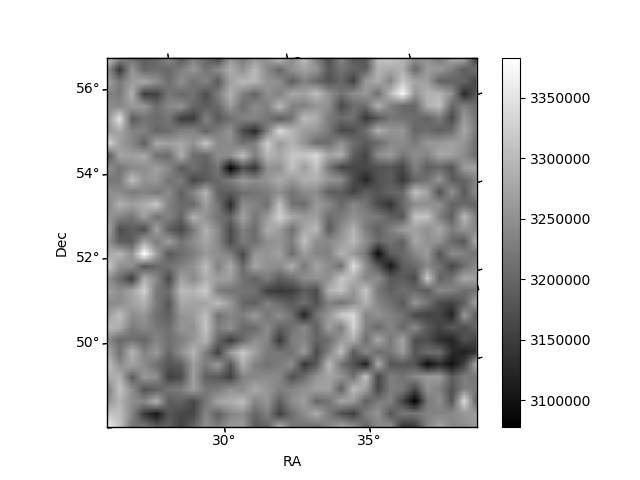
| Quadrant D | 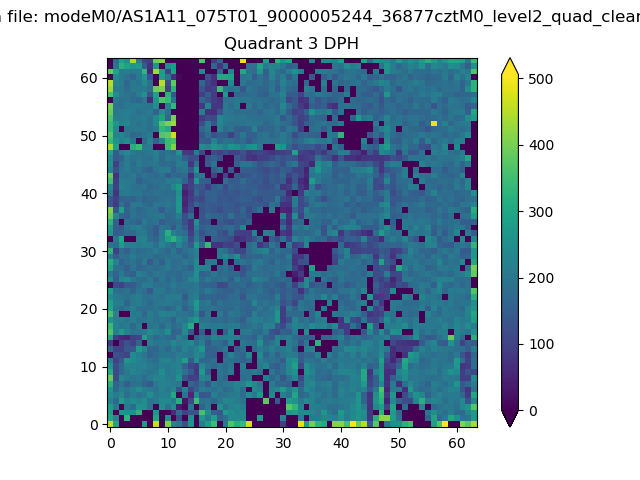 |
 |
Quadrant C |
| Plot type | Count rate plots | Images |
|---|---|---|
| Comparison with Poisson distribution Blue bars denote a histogram of data divided into 1 sec bins. Red curve is a Poisson curve with rate = median count rate of data. |
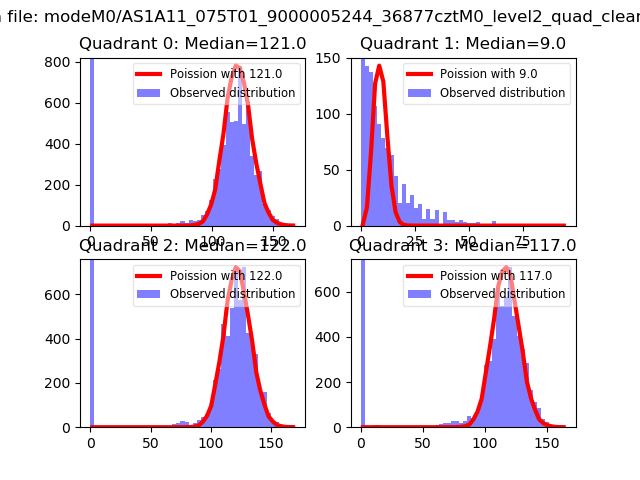 |
 |
| Quadrant-wise count rates Data is divided into 100 sec bins |
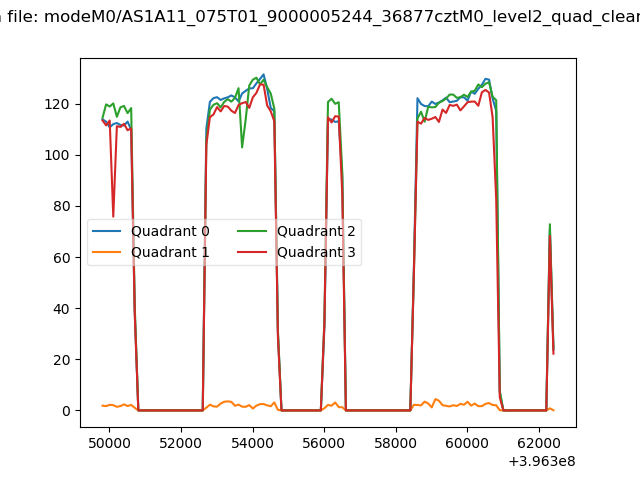 |
|
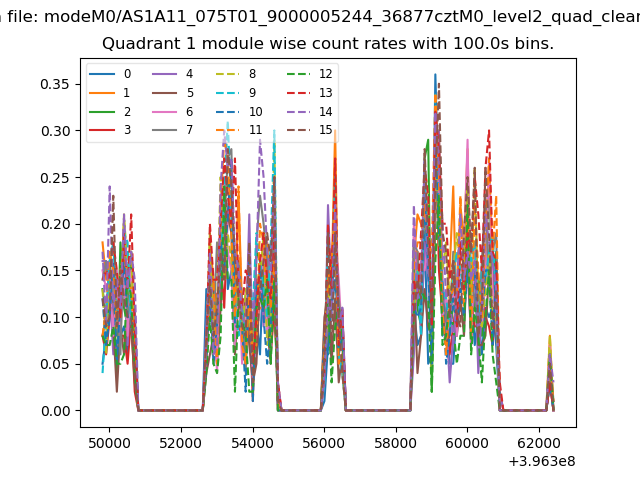
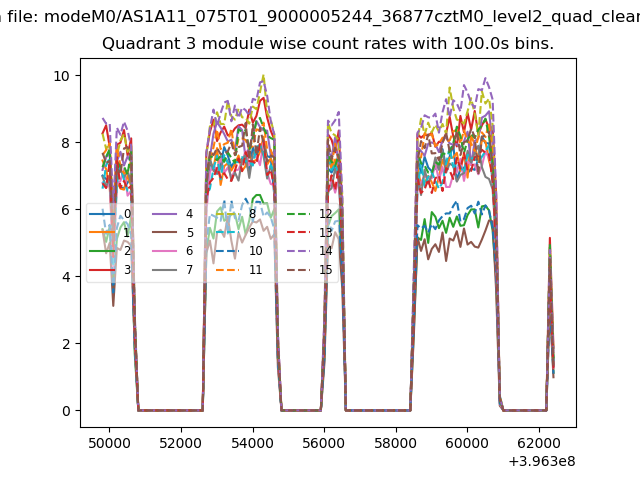
| Module-wise count rates for Quadrant A Data is divided into 100 sec bins |
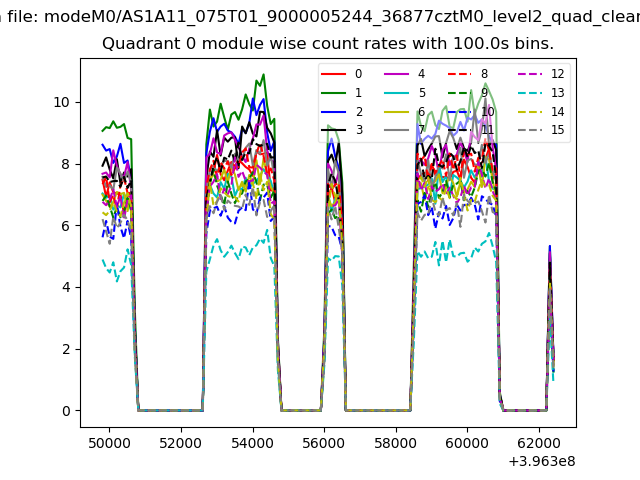 |
 |
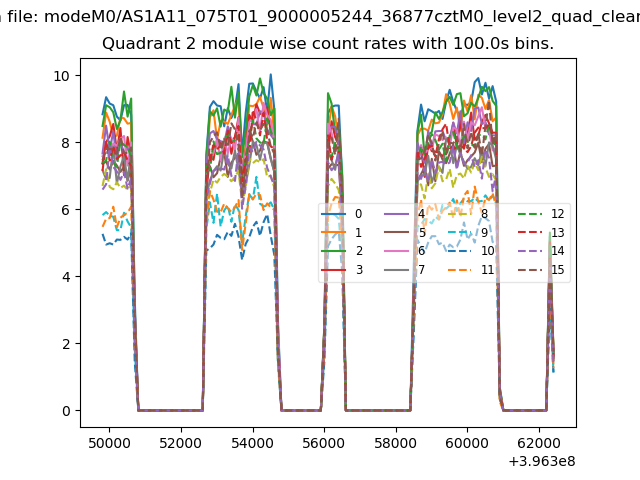
| Module-wise count rates for Quadrant B Data is divided into 100 sec bins |
 |
 |
| Module-wise count rates for Quadrant C Data is divided into 100 sec bins |
 |
 |
| Module-wise count rates for Quadrant D Data is divided into 100 sec bins |
 |
 |
| Parameter | Plot |
|---|---|
| CZT HV Monitor | 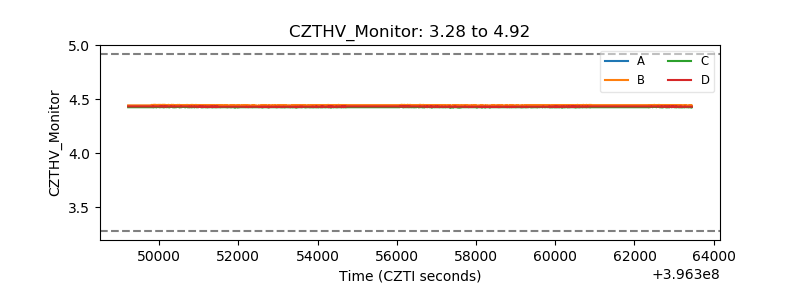 |
| D_VDD | 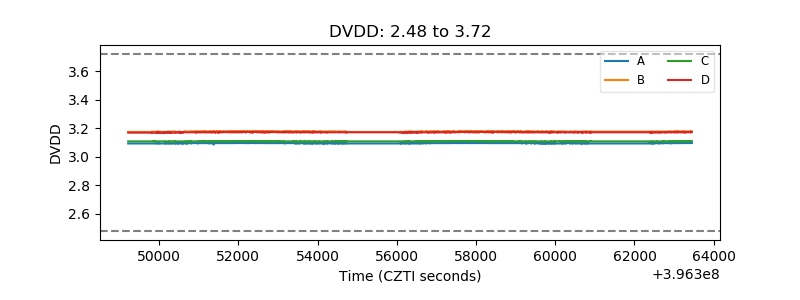 |
| Temperature 1 | 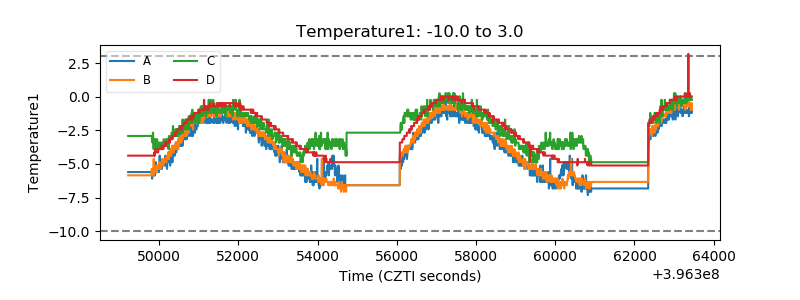 |
| Veto HV Monitor |  |
| Veto LLD | 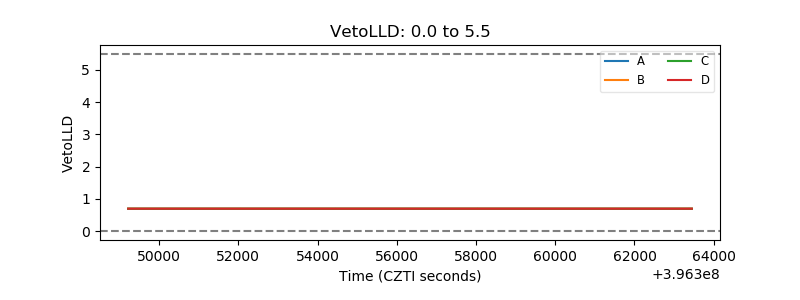 |
| Alpha Counter | 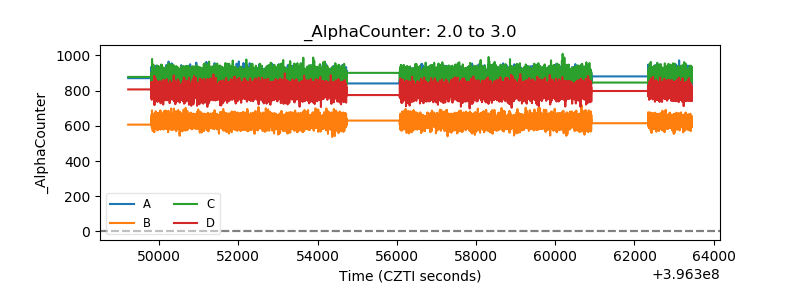 |
| _CPM_Rate | 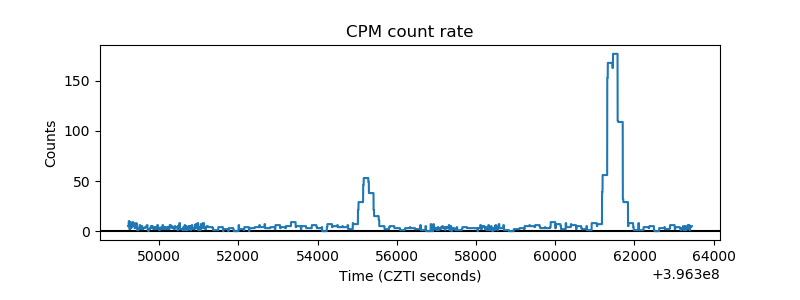 |
| CZT Counter | 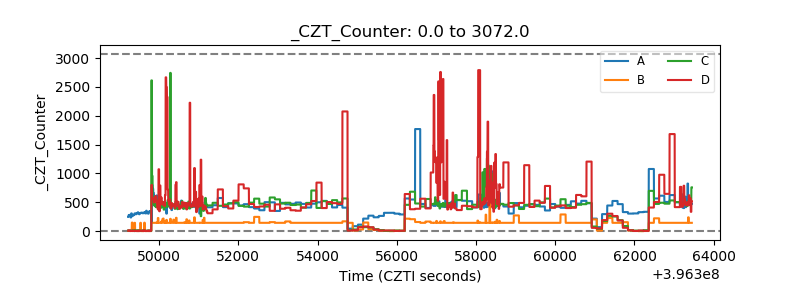 |
| +2.5 Volts monitor | 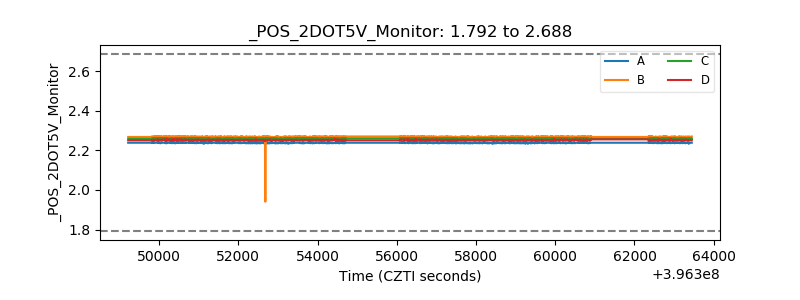 |
| +5 Volts monitor |  |
| _ROLL_ROT | 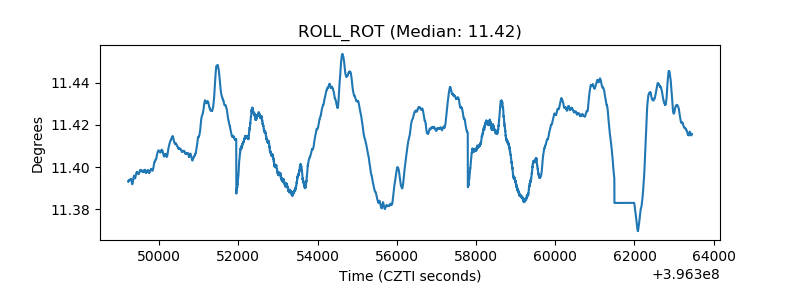 |
| _Roll_DEC | 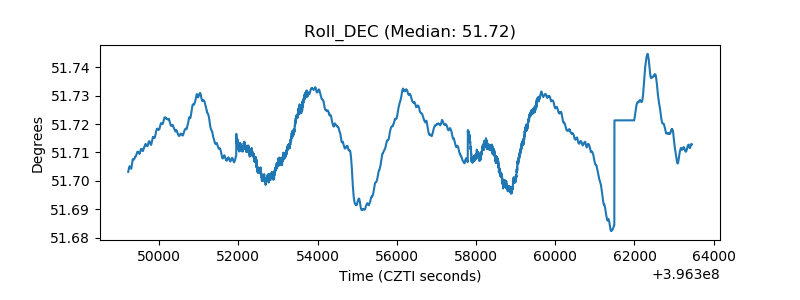 |
| _Roll_RA | 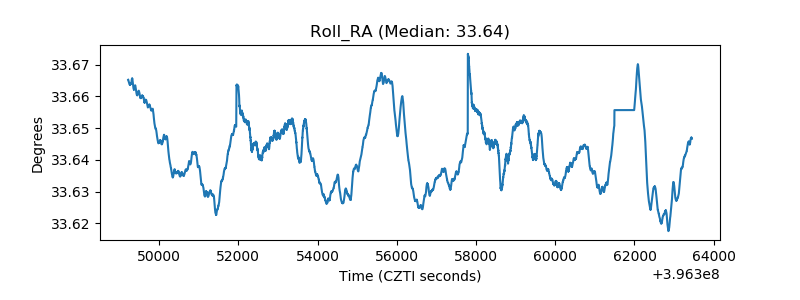 |
| Veto Counter | 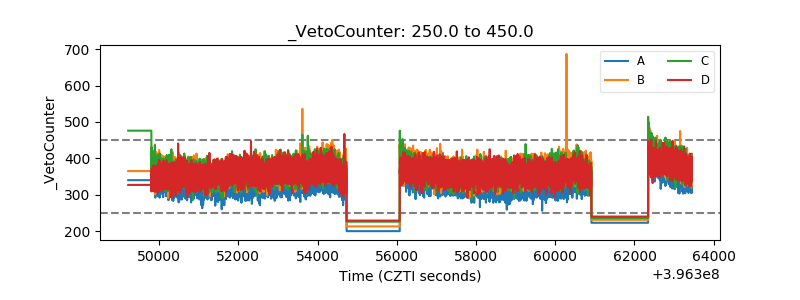 |