| Param | Original file | Final file |
|---|---|---|
| Filename | modeM0/AS1A11_075T01_9000005244_36879cztM0_level2.evt | modeM0/AS1A11_075T01_9000005244_36879cztM0_level2_quad_clean.evt |
| Size (bytes) | 389,064,960 | 47,678,400 |
| Size | 371.0 MB | 45.5 MB |
| Events in quadrant A | 2,752,826 | 359,579 |
| Events in quadrant B | 831,992 | 6,292 |
| Events in quadrant C | 2,849,007 | 361,222 |
| Events in quadrant D | 4,975,383 | 335,339 |
| Mode SS | |||
|---|---|---|---|
| Quadrant | BADHDUFLAG | Total packets | Discarded packets |
| A | 0 | 112 | 0 |
| B | 0 | 112 | 0 |
| C | 0 | 112 | 0 |
| D | 0 | 112 | 0 |
| Mode M0 | |||
|---|---|---|---|
| Quadrant | BADHDUFLAG | Total packets | Discarded packets |
| A | 0 | 11727 | 3 |
| B | 0 | 5518 | 2 |
| C | 0 | 11710 | 2 |
| D | 0 | 18579 | 2 |
| Mode M9 | |||
|---|---|---|---|
| Quadrant | BADHDUFLAG | Total packets | Discarded packets |
| A | 0 | 29 | 0 |
| B | 0 | 29 | 0 |
| C | 0 | 29 | 0 |
| D | 0 | 30 | 0 |
| Quadrant | Total seconds | Saturated seconds | Saturation percentage |
|---|---|---|---|
| A | 5410 | 15 | 0.277264% |
| B | 5410 | 5410 | 100.000000% |
| C | 5410 | 56 | 1.035120% |
| D | 5410 | 567 | 10.480591% |
Noise dominated data is calculated using 1-second bins in cleaned event files. If a bin has >2000 counts, and if more than 50% of those come from <1% of pixels, then it is considered to be noise-dominated and hence unusable.
| Quadrant | # 1 sec bins | Bins with >0 counts | Bins with >2000 counts | High rate bins dominated by noise | Noise dominated (total time) | Noise dominated (detector-on time) | Marked lightcurve |
|---|---|---|---|---|---|---|---|
| A | 7113 | 5411 | 7 | 7 | 0.10% | 0.13% | 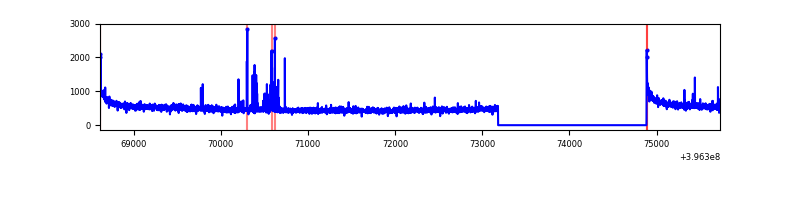 |
| B | 7112 | 5409 | 1 | 1 | 0.01% | 0.02% | 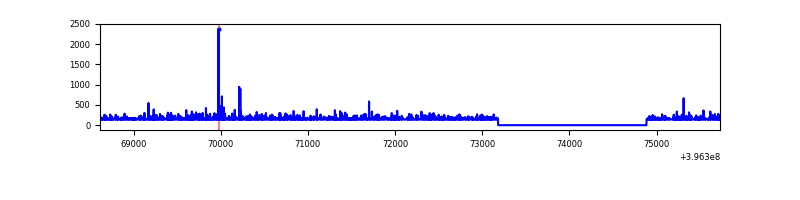 |
| C | 7113 | 5411 | 41 | 41 | 0.58% | 0.76% | 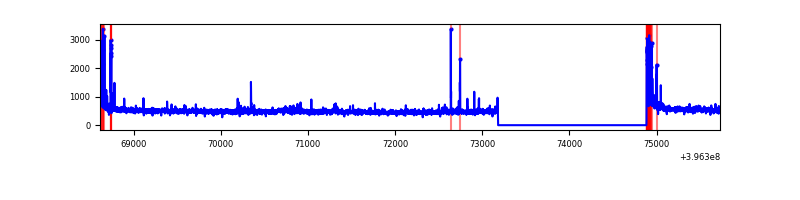 |
| D | 7113 | 5411 | 497 | 497 | 6.99% | 9.18% | 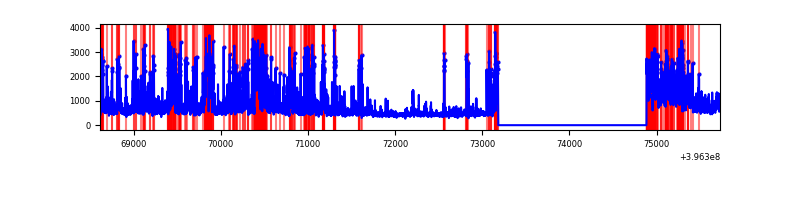 |
Top three noisy pixels from each quadrant. If the there are fewer than three noisy pixels in the level2.evt file, extra rows are filled as -1
| Pixel properties | Quadrant properties | ||||||
|---|---|---|---|---|---|---|---|
| Quadrant | DetID | PixID | Counts | Sigma | Mean | Median | Sigma |
| A | 10 | 83 | 256742 | 1999.73 | 623 | 610 | 128.1 |
| A | 13 | 248 | 65493 | 506.57 | 623 | 610 | 128.1 |
| A | 13 | 6 | 9548 | 69.78 | 623 | 610 | 128.1 |
| B | 12 | 243 | 749235 | 173635.99 | 12 | 12 | 4.3 |
| B | 12 | 144 | 14253 | 3300.42 | 12 | 12 | 4.3 |
| B | 5 | 172 | 5016 | 1159.7 | 12 | 12 | 4.3 |
| C | 15 | 214 | 232879 | 1651.85 | 604 | 608 | 140.6 |
| C | 0 | 10 | 160461 | 1136.84 | 604 | 608 | 140.6 |
| C | 14 | 254 | 41592 | 291.47 | 604 | 608 | 140.6 |
| D | 12 | 235 | 1390893 | 9711.25 | 584 | 567 | 143.2 |
| D | 2 | 249 | 541493 | 3778.3 | 584 | 567 | 143.2 |
| D | 12 | 233 | 248015 | 1728.39 | 584 | 567 | 143.2 |
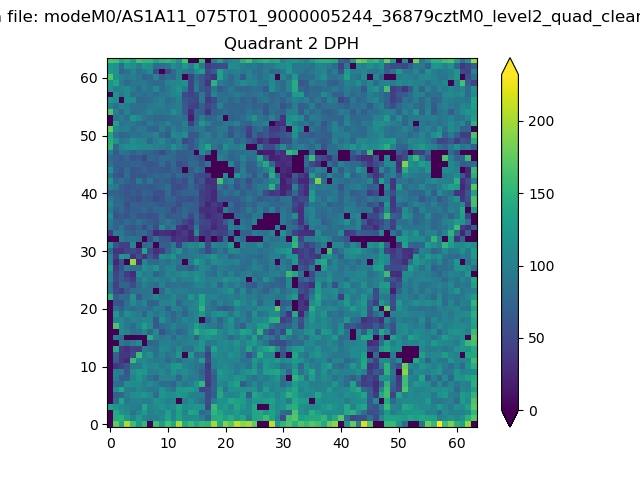
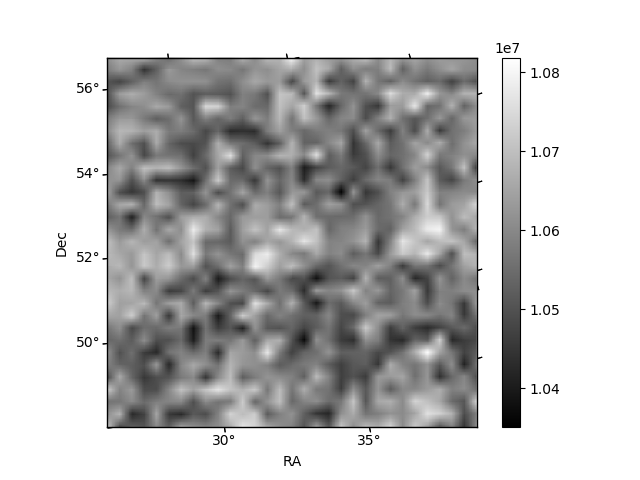
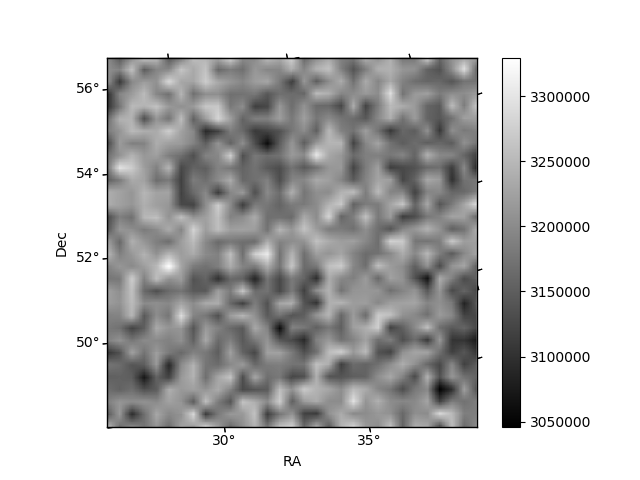
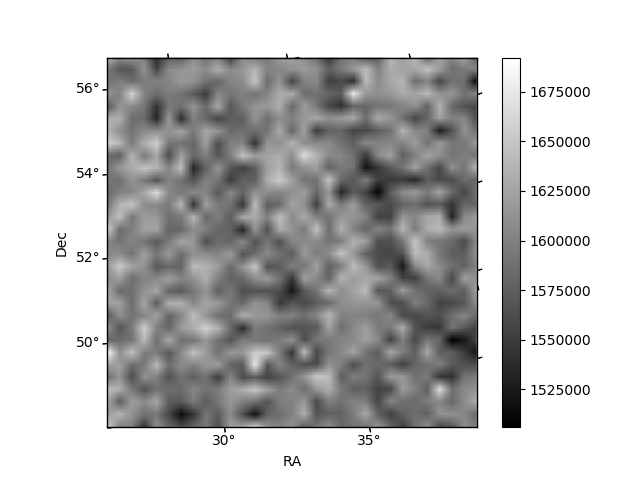
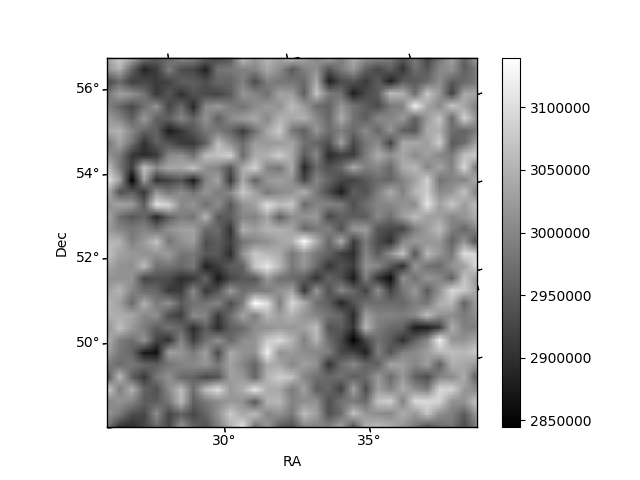
Histogram calculated using DETX and DETY for each event in the final _common_clean file
| Quadrant A | 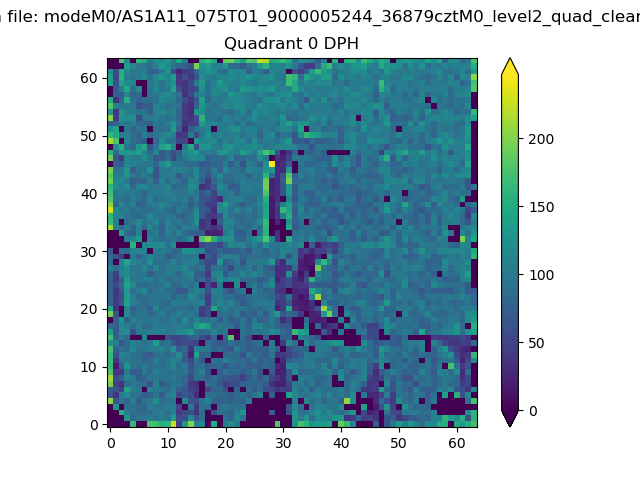 |
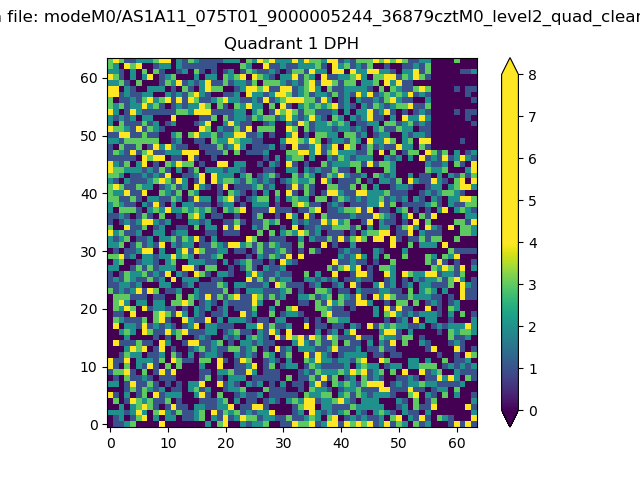 |
Quadrant B |
|---|---|---|---|
| Quadrant D | 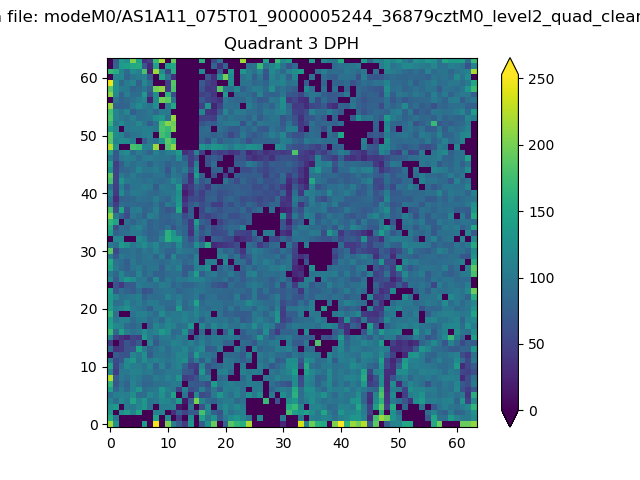 |
 |
Quadrant C |
| Plot type | Count rate plots | Images |
|---|---|---|
| Comparison with Poisson distribution Blue bars denote a histogram of data divided into 1 sec bins. Red curve is a Poisson curve with rate = median count rate of data. |
 |
 |
| Quadrant-wise count rates Data is divided into 100 sec bins |
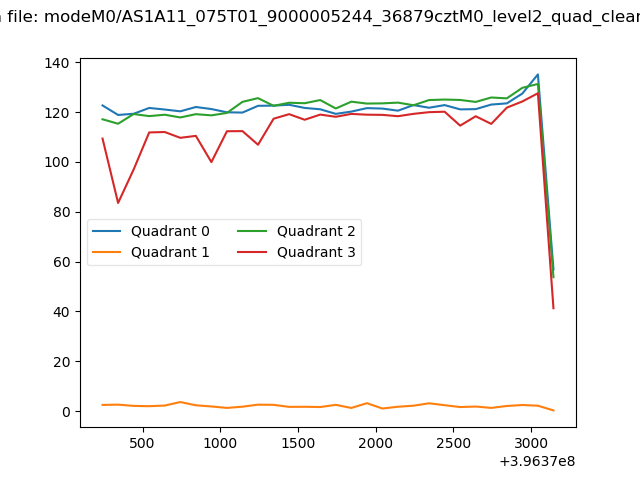 |
|
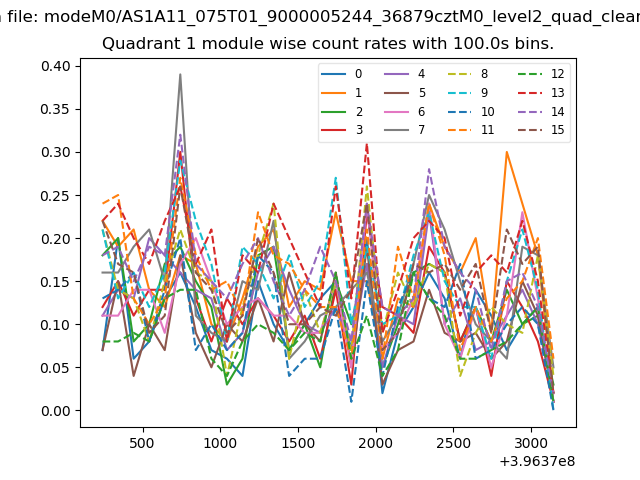
| Module-wise count rates for Quadrant A Data is divided into 100 sec bins |
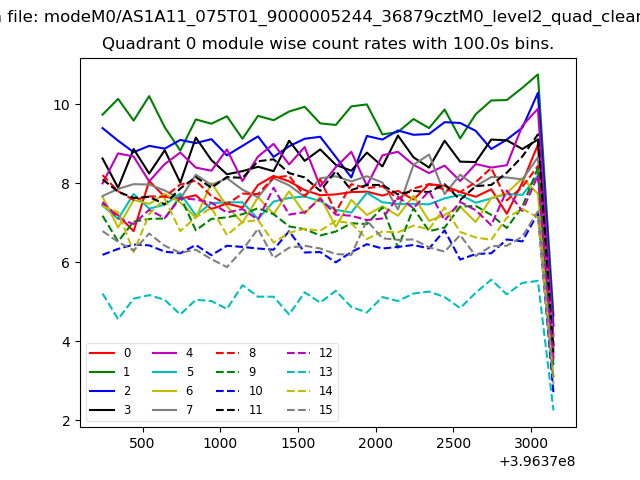 |
 |
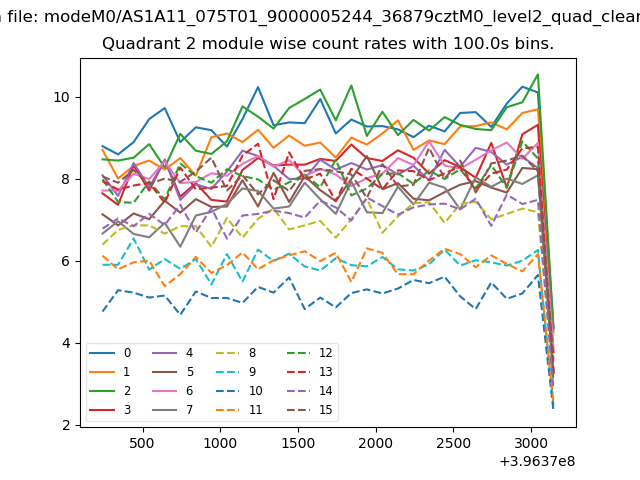
| Module-wise count rates for Quadrant B Data is divided into 100 sec bins |
 |
 |
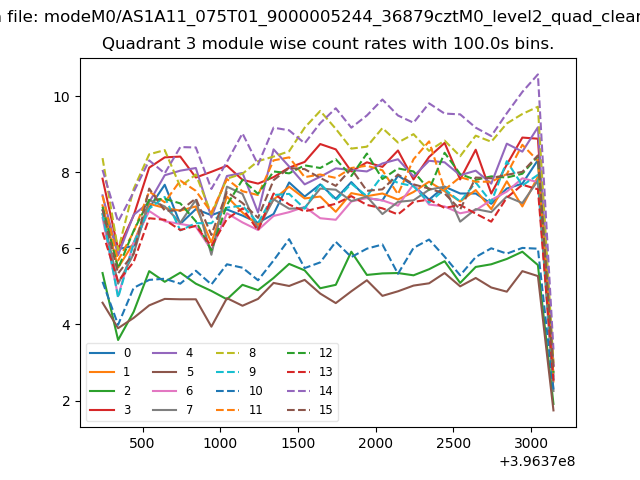
| Module-wise count rates for Quadrant C Data is divided into 100 sec bins |
 |
 |
| Module-wise count rates for Quadrant D Data is divided into 100 sec bins |
 |
 |
| Parameter | Plot |
|---|---|
| CZT HV Monitor | 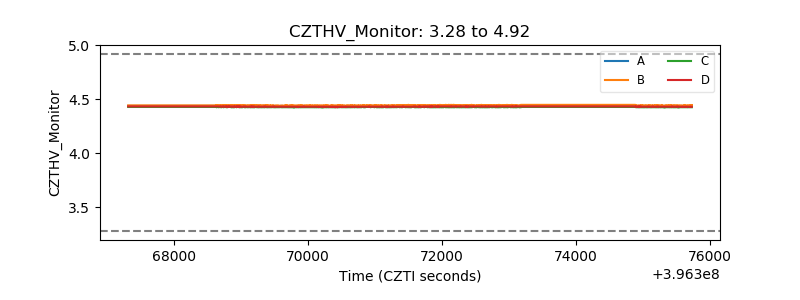 |
| D_VDD | 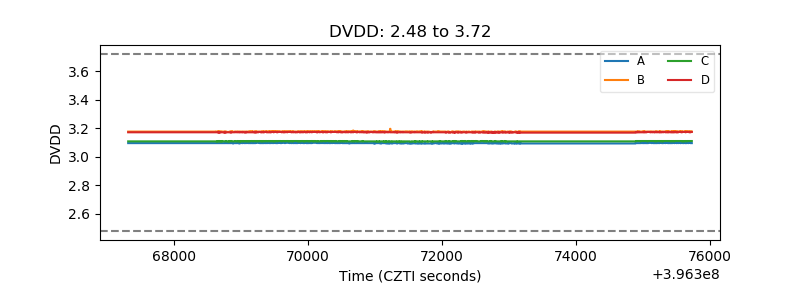 |
| Temperature 1 | 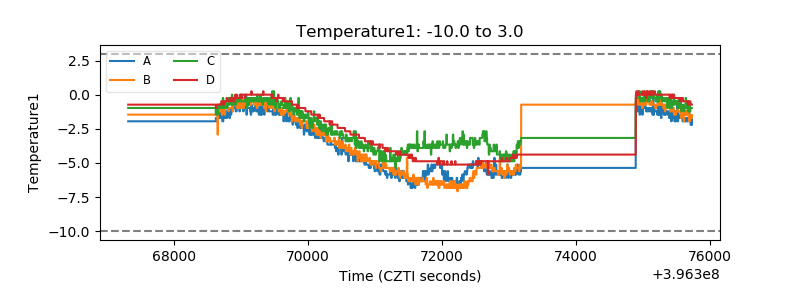 |
| Veto HV Monitor | 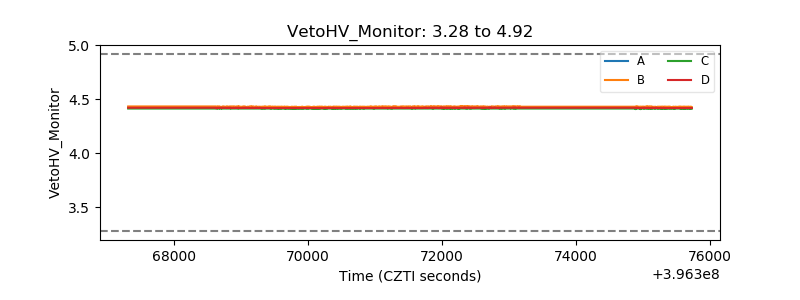 |
| Veto LLD | 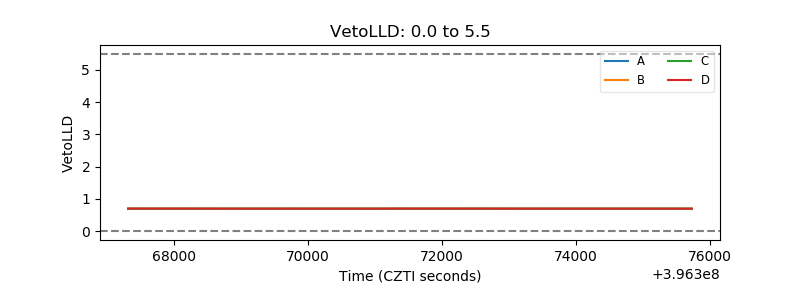 |
| Alpha Counter | 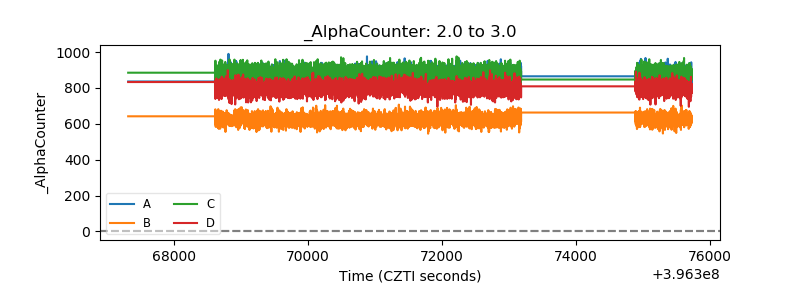 |
| _CPM_Rate |  |
| CZT Counter | 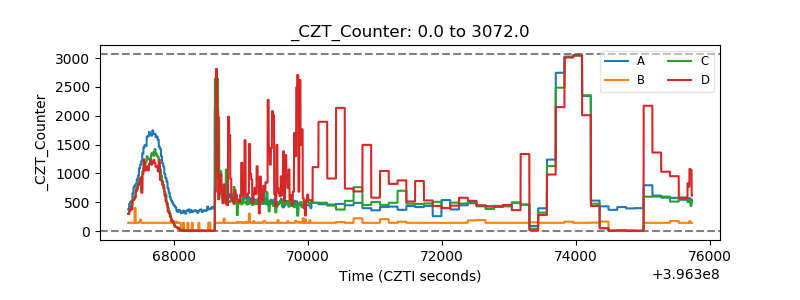 |
| +2.5 Volts monitor |  |
| +5 Volts monitor |  |
| _ROLL_ROT | 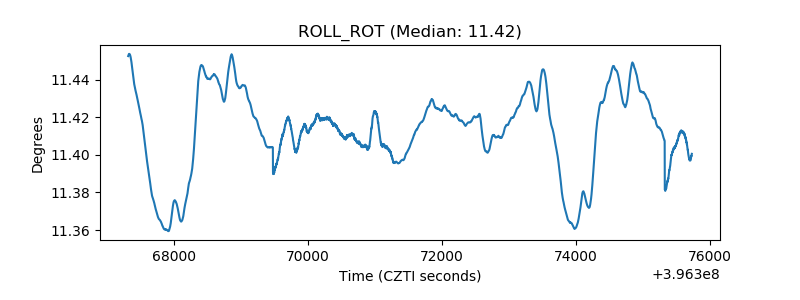 |
| _Roll_DEC | 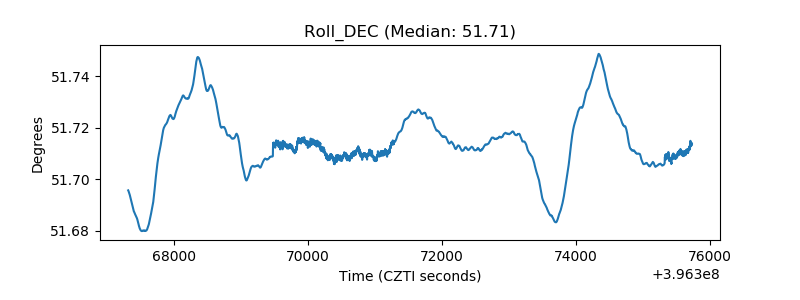 |
| _Roll_RA | 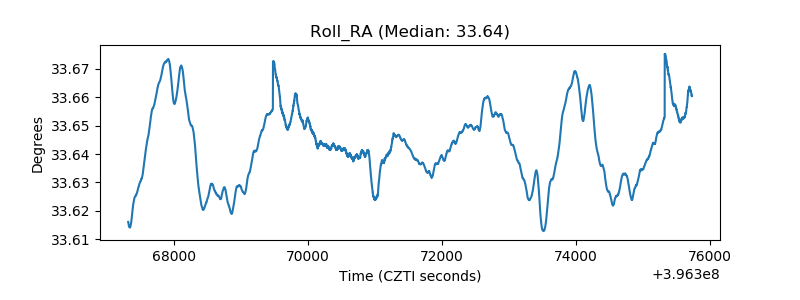 |
| Veto Counter | 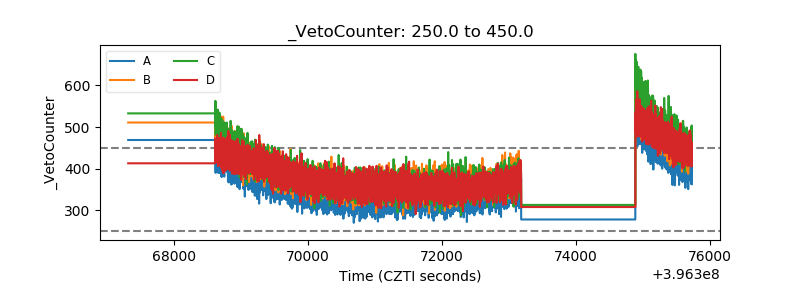 |