| Param | Original file | Final file |
|---|---|---|
| Filename | modeM0/AS1A11_075T01_9000005244_36881cztM0_level2.evt | modeM0/AS1A11_075T01_9000005244_36881cztM0_level2_quad_clean.evt |
| Size (bytes) | 444,784,320 | 52,476,480 |
| Size | 424.2 MB | 50.0 MB |
| Events in quadrant A | 2,801,147 | 420,501 |
| Events in quadrant B | 807,130 | 7,551 |
| Events in quadrant C | 2,999,297 | 420,294 |
| Events in quadrant D | 6,499,025 | 368,513 |
| Mode SS | |||
|---|---|---|---|
| Quadrant | BADHDUFLAG | Total packets | Discarded packets |
| A | 0 | 108 | 0 |
| B | 0 | 108 | 0 |
| C | 0 | 108 | 0 |
| D | 0 | 108 | 0 |
| Mode M0 | |||
|---|---|---|---|
| Quadrant | BADHDUFLAG | Total packets | Discarded packets |
| A | 0 | 11829 | 3 |
| B | 0 | 5368 | 2 |
| C | 0 | 12173 | 2 |
| D | 0 | 22971 | 2 |
| Mode M9 | |||
|---|---|---|---|
| Quadrant | BADHDUFLAG | Total packets | Discarded packets |
| A | 0 | 26 | 0 |
| B | 0 | 26 | 0 |
| C | 0 | 26 | 0 |
| D | 0 | 27 | 0 |
| Quadrant | Total seconds | Saturated seconds | Saturation percentage |
|---|---|---|---|
| A | 5282 | 29 | 0.549034% |
| B | 5282 | 5282 | 100.000000% |
| C | 5282 | 104 | 1.968951% |
| D | 5282 | 1095 | 20.730784% |
Noise dominated data is calculated using 1-second bins in cleaned event files. If a bin has >2000 counts, and if more than 50% of those come from <1% of pixels, then it is considered to be noise-dominated and hence unusable.
| Quadrant | # 1 sec bins | Bins with >0 counts | Bins with >2000 counts | High rate bins dominated by noise | Noise dominated (total time) | Noise dominated (detector-on time) | Marked lightcurve |
|---|---|---|---|---|---|---|---|
| A | 7105 | 5283 | 19 | 19 | 0.27% | 0.36% | 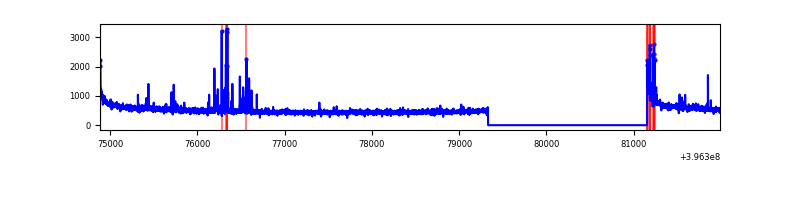 |
| B | 7104 | 5281 | 0 | 0 | 0.00% | 0.00% | 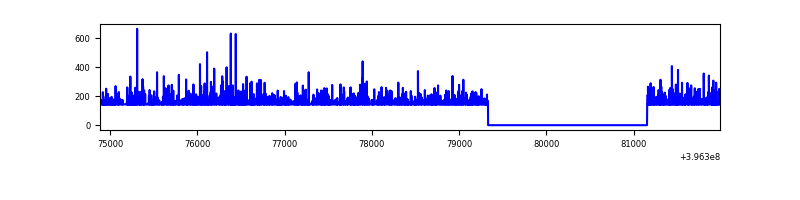 |
| C | 7105 | 5283 | 80 | 80 | 1.13% | 1.51% | 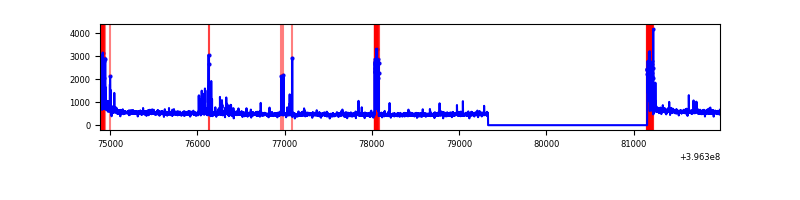 |
| D | 7104 | 5282 | 906 | 906 | 12.75% | 17.15% | 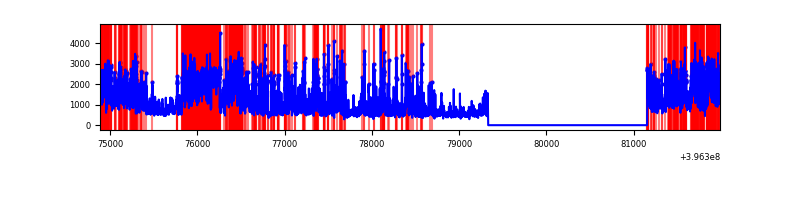 |
Top three noisy pixels from each quadrant. If the there are fewer than three noisy pixels in the level2.evt file, extra rows are filled as -1
| Pixel properties | Quadrant properties | ||||||
|---|---|---|---|---|---|---|---|
| Quadrant | DetID | PixID | Counts | Sigma | Mean | Median | Sigma |
| A | 10 | 83 | 254449 | 2010.34 | 624 | 613 | 126.3 |
| A | 13 | 248 | 106236 | 836.52 | 624 | 613 | 126.3 |
| A | 13 | 6 | 12155 | 91.41 | 624 | 613 | 126.3 |
| B | 12 | 243 | 732193 | 171586.02 | 12 | 12 | 4.3 |
| B | 12 | 144 | 13742 | 3217.61 | 12 | 12 | 4.3 |
| B | 0 | 221 | 1551 | 360.66 | 12 | 12 | 4.3 |
| C | 15 | 214 | 225292 | 1595.84 | 610 | 616 | 140.8 |
| C | 0 | 10 | 209944 | 1486.83 | 610 | 616 | 140.8 |
| C | 14 | 254 | 104629 | 738.79 | 610 | 616 | 140.8 |
| D | 12 | 235 | 3791879 | 28043.78 | 548 | 534 | 135.2 |
| D | 12 | 233 | 161046 | 1187.27 | 548 | 534 | 135.2 |
| D | 13 | 249 | 158832 | 1170.9 | 548 | 534 | 135.2 |
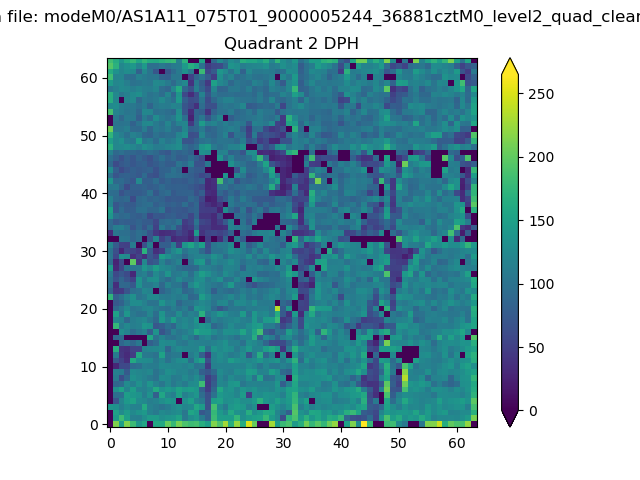
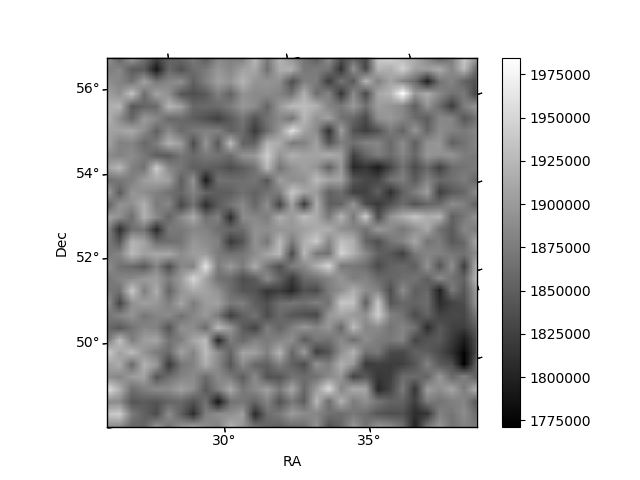
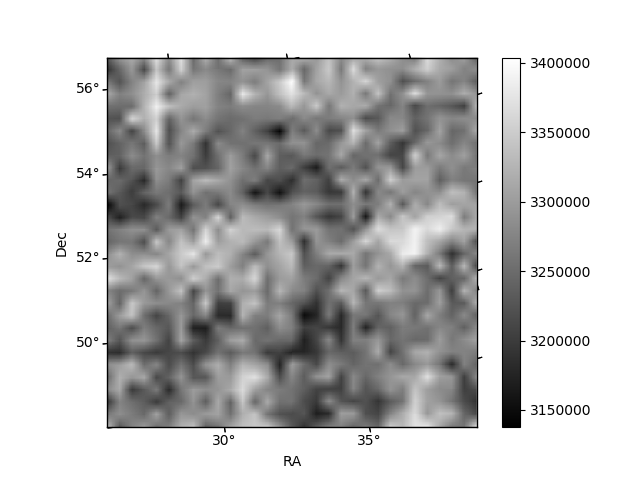
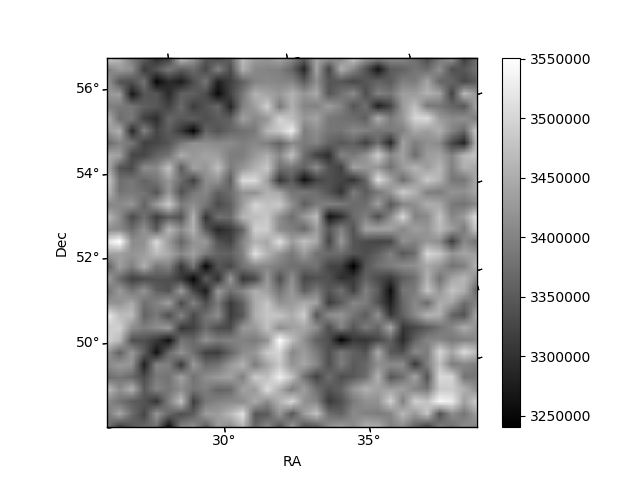
Histogram calculated using DETX and DETY for each event in the final _common_clean file
| Quadrant A | 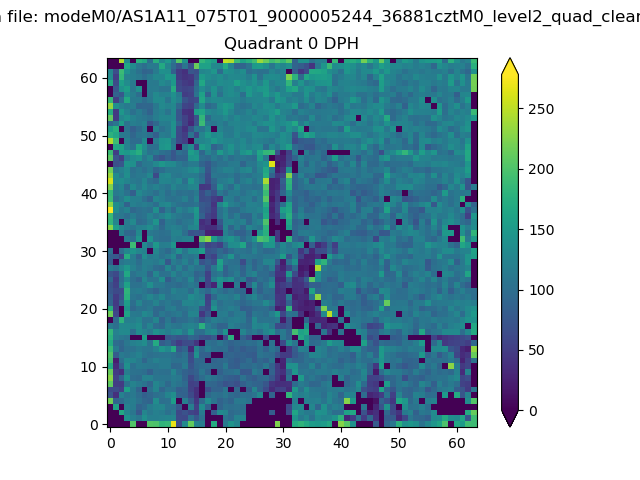 |
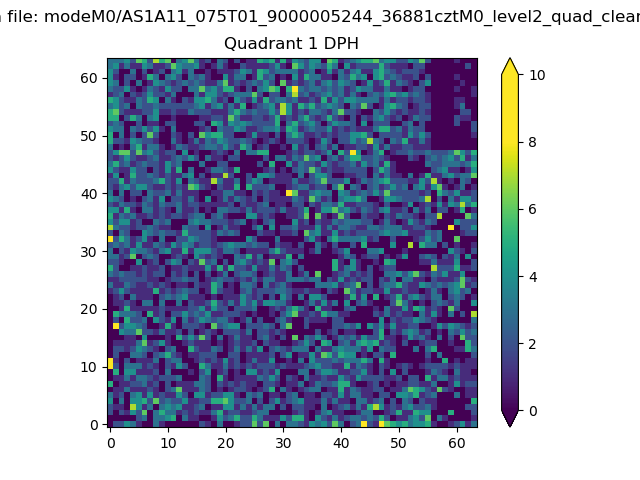 |
Quadrant B |
|---|---|---|---|
| Quadrant D | 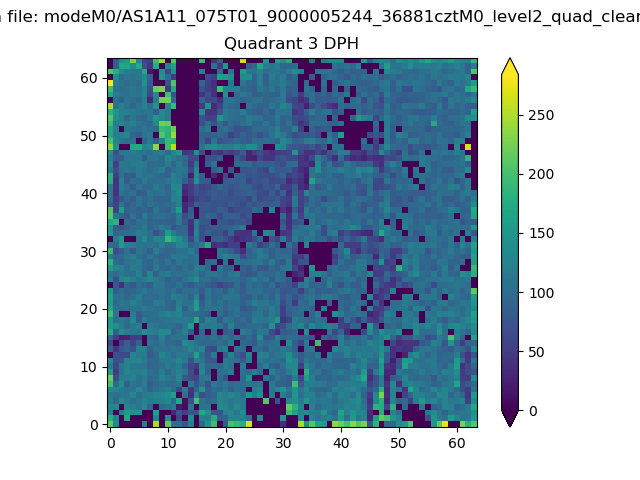 |
 |
Quadrant C |
| Plot type | Count rate plots | Images |
|---|---|---|
| Comparison with Poisson distribution Blue bars denote a histogram of data divided into 1 sec bins. Red curve is a Poisson curve with rate = median count rate of data. |
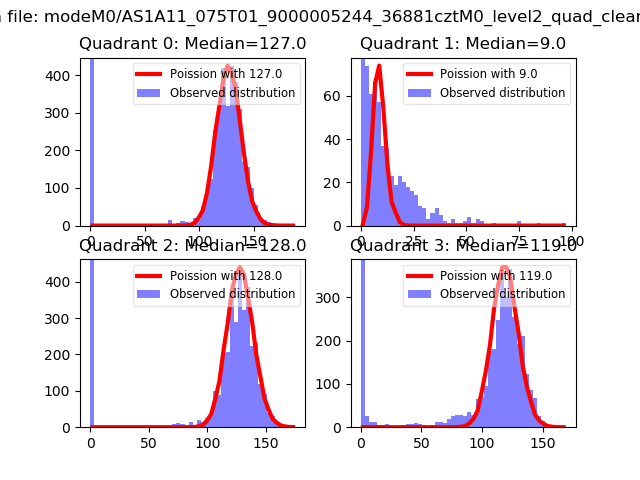 |
 |
| Quadrant-wise count rates Data is divided into 100 sec bins |
 |
|
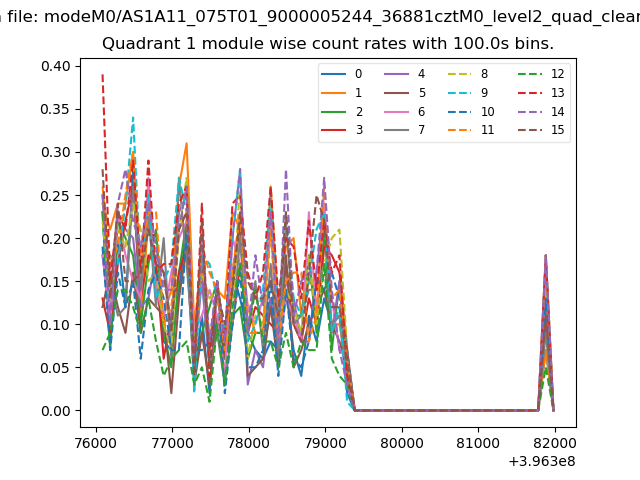
| Module-wise count rates for Quadrant A Data is divided into 100 sec bins |
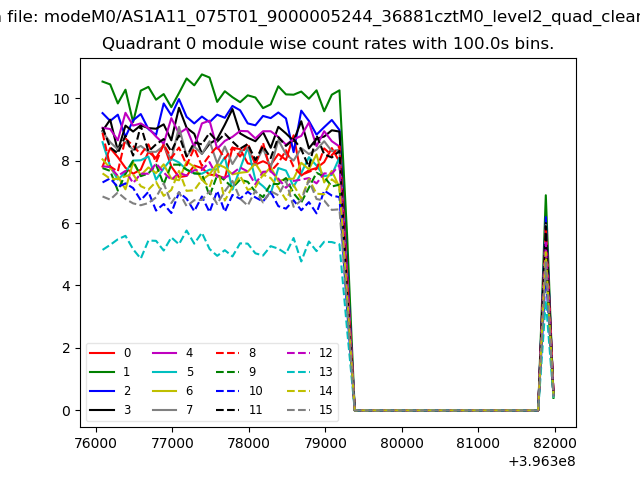 |
 |
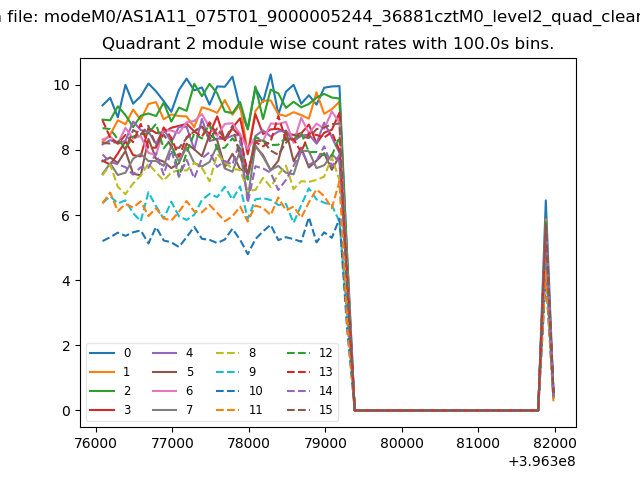
| Module-wise count rates for Quadrant B Data is divided into 100 sec bins |
 |
 |
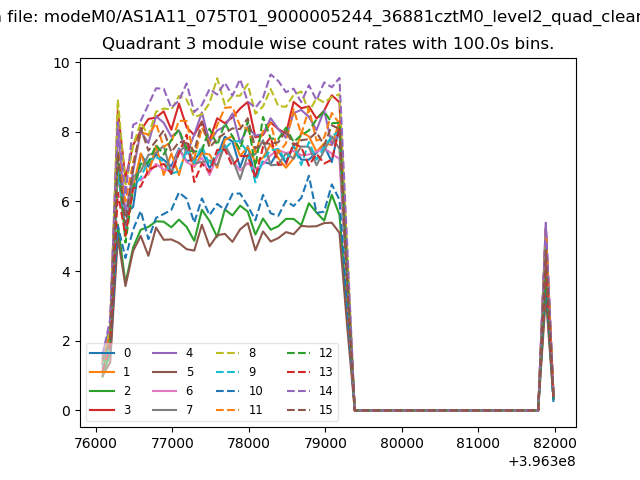
| Module-wise count rates for Quadrant C Data is divided into 100 sec bins |
 |
 |
| Module-wise count rates for Quadrant D Data is divided into 100 sec bins |
 |
 |
| Parameter | Plot |
|---|---|
| CZT HV Monitor | 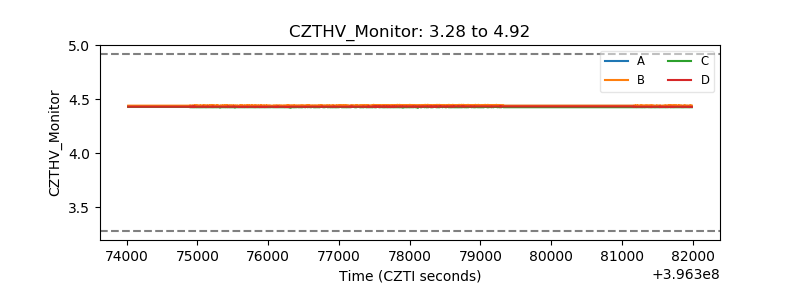 |
| D_VDD | 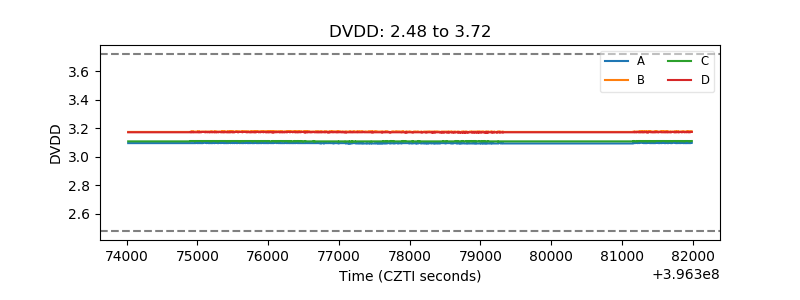 |
| Temperature 1 | 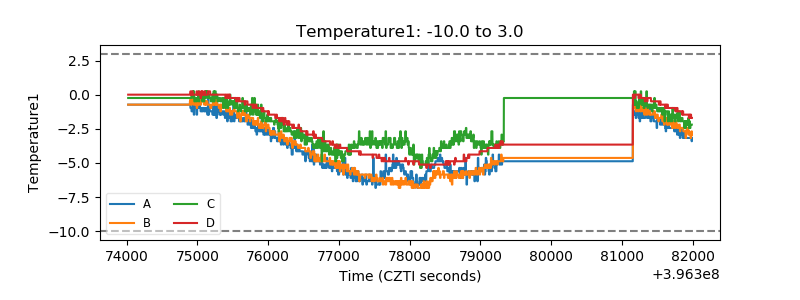 |
| Veto HV Monitor |  |
| Veto LLD | 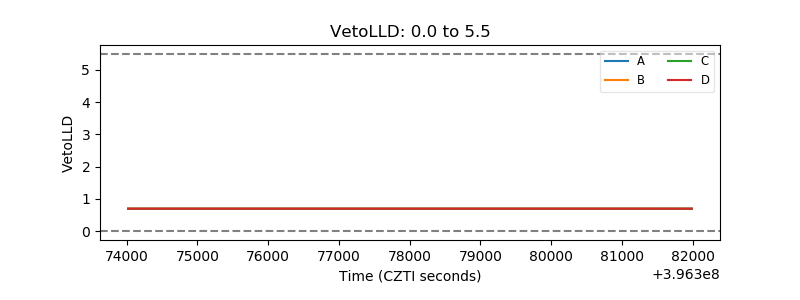 |
| Alpha Counter | 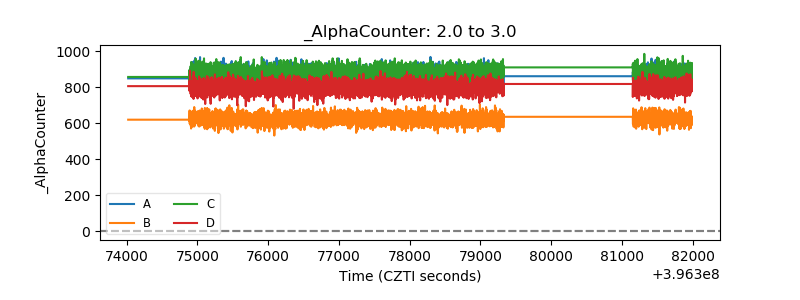 |
| _CPM_Rate | 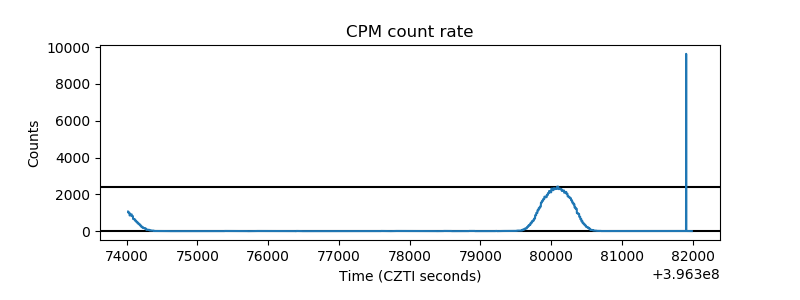 |
| CZT Counter | 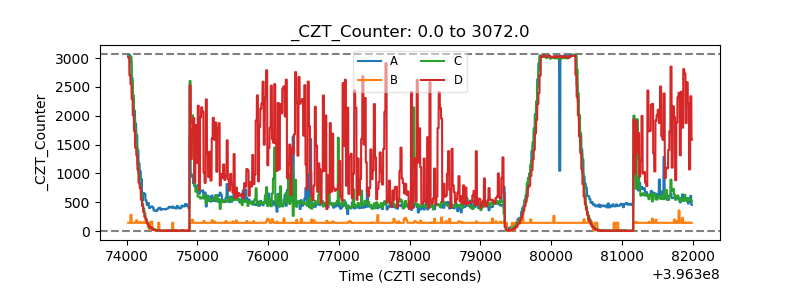 |
| +2.5 Volts monitor | 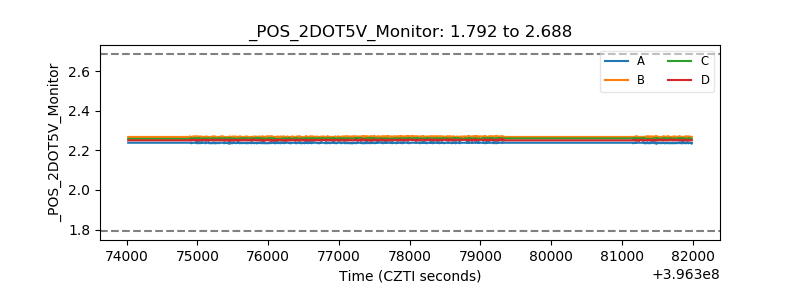 |
| +5 Volts monitor |  |
| _ROLL_ROT | 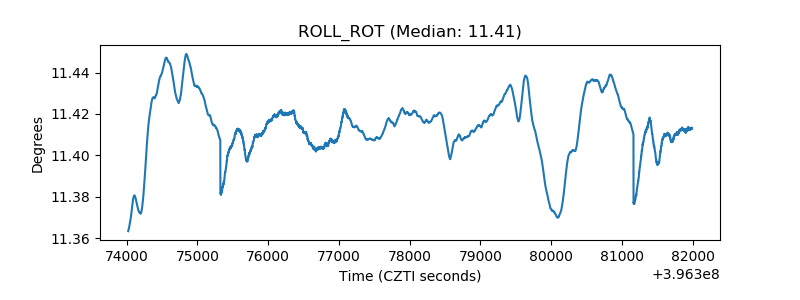 |
| _Roll_DEC | 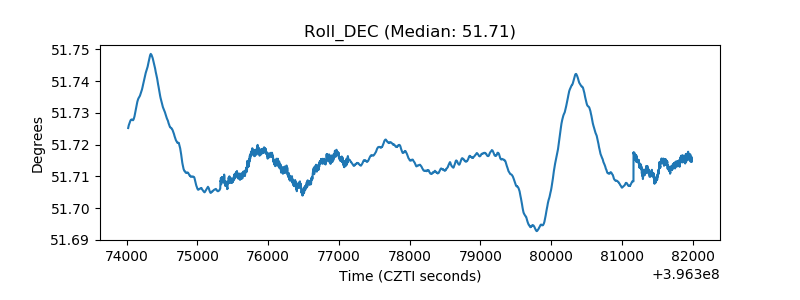 |
| _Roll_RA | 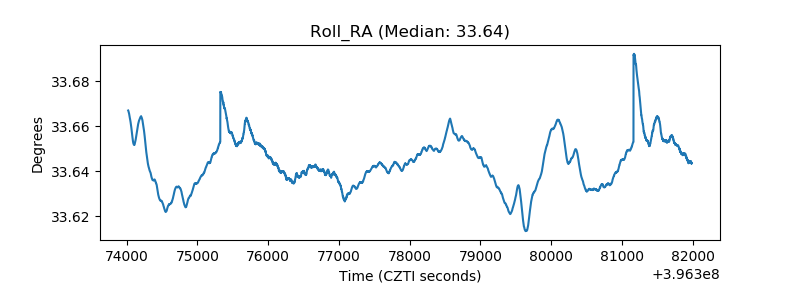 |
| Veto Counter | 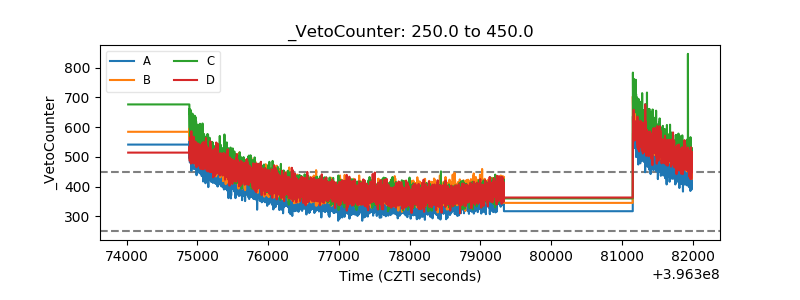 |