| Param | Original file | Final file |
|---|---|---|
| Filename | modeM0/AS1A11_075T01_9000005244_36882cztM0_level2.evt | modeM0/AS1A11_075T01_9000005244_36882cztM0_level2_quad_clean.evt |
| Size (bytes) | 437,414,400 | 63,800,640 |
| Size | 417.2 MB | 60.8 MB |
| Events in quadrant A | 2,704,875 | 535,708 |
| Events in quadrant B | 778,795 | 8,826 |
| Events in quadrant C | 2,908,019 | 546,459 |
| Events in quadrant D | 6,505,837 | 482,681 |
| Mode SS | |||
|---|---|---|---|
| Quadrant | BADHDUFLAG | Total packets | Discarded packets |
| A | 0 | 102 | 0 |
| B | 0 | 102 | 0 |
| C | 0 | 102 | 0 |
| D | 0 | 102 | 0 |
| Mode M0 | |||
|---|---|---|---|
| Quadrant | BADHDUFLAG | Total packets | Discarded packets |
| A | 0 | 11374 | 3 |
| B | 0 | 5178 | 2 |
| C | 0 | 11819 | 2 |
| D | 0 | 22833 | 2 |
| Mode M9 | |||
|---|---|---|---|
| Quadrant | BADHDUFLAG | Total packets | Discarded packets |
| A | 0 | 35 | 0 |
| B | 0 | 35 | 0 |
| C | 0 | 35 | 0 |
| D | 0 | 36 | 0 |
| Quadrant | Total seconds | Saturated seconds | Saturation percentage |
|---|---|---|---|
| A | 5084 | 22 | 0.432730% |
| B | 5084 | 5084 | 100.000000% |
| C | 5084 | 85 | 1.671912% |
| D | 5084 | 892 | 17.545240% |
Noise dominated data is calculated using 1-second bins in cleaned event files. If a bin has >2000 counts, and if more than 50% of those come from <1% of pixels, then it is considered to be noise-dominated and hence unusable.
| Quadrant | # 1 sec bins | Bins with >0 counts | Bins with >2000 counts | High rate bins dominated by noise | Noise dominated (total time) | Noise dominated (detector-on time) | Marked lightcurve |
|---|---|---|---|---|---|---|---|
| A | 7056 | 5085 | 15 | 15 | 0.21% | 0.29% | 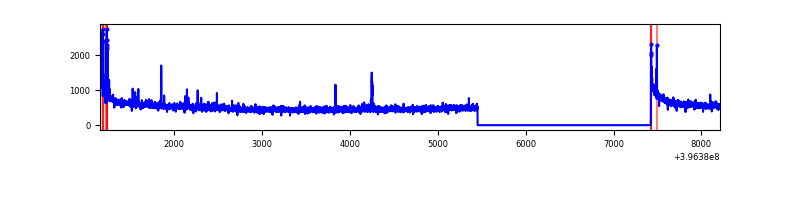 |
| B | 7055 | 5083 | 0 | 0 | 0.00% | 0.00% |  |
| C | 7056 | 5085 | 50 | 50 | 0.71% | 0.98% | 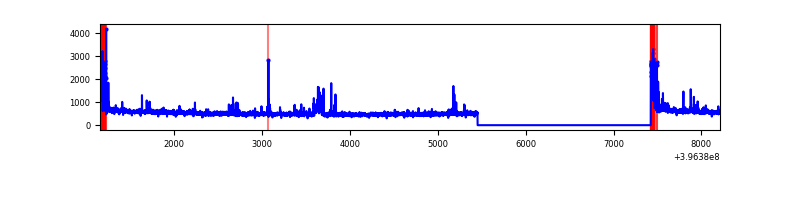 |
| D | 7056 | 5085 | 883 | 883 | 12.51% | 17.36% | 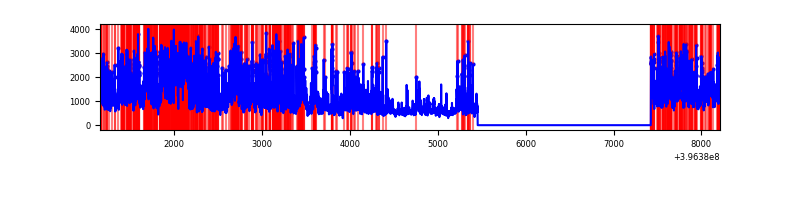 |
Top three noisy pixels from each quadrant. If the there are fewer than three noisy pixels in the level2.evt file, extra rows are filled as -1
| Pixel properties | Quadrant properties | ||||||
|---|---|---|---|---|---|---|---|
| Quadrant | DetID | PixID | Counts | Sigma | Mean | Median | Sigma |
| A | 10 | 83 | 244806 | 1985.19 | 612 | 600 | 123.0 |
| A | 13 | 248 | 49311 | 395.98 | 612 | 600 | 123.0 |
| A | 9 | 143 | 16935 | 132.79 | 612 | 600 | 123.0 |
| B | 12 | 243 | 705197 | 175639.66 | 11 | 11 | 4.0 |
| B | 12 | 144 | 13108 | 3262.05 | 11 | 11 | 4.0 |
| B | 0 | 189 | 2108 | 522.3 | 11 | 11 | 4.0 |
| C | 0 | 10 | 230140 | 1646.5 | 606 | 612 | 139.4 |
| C | 15 | 214 | 214588 | 1534.94 | 606 | 612 | 139.4 |
| C | 0 | 207 | 47668 | 337.55 | 606 | 612 | 139.4 |
| D | 12 | 235 | 3650618 | 26615.6 | 568 | 555 | 137.1 |
| D | 13 | 249 | 230074 | 1673.61 | 568 | 555 | 137.1 |
| D | 2 | 249 | 160943 | 1169.52 | 568 | 555 | 137.1 |
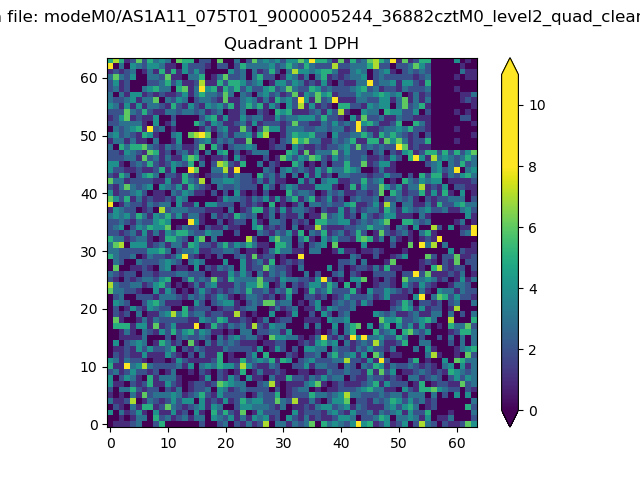
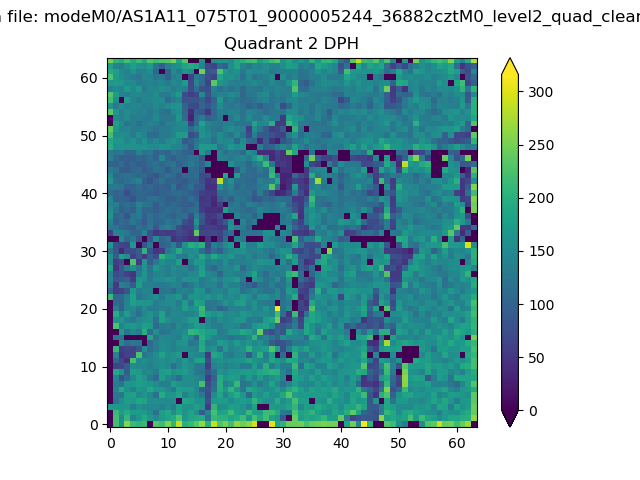
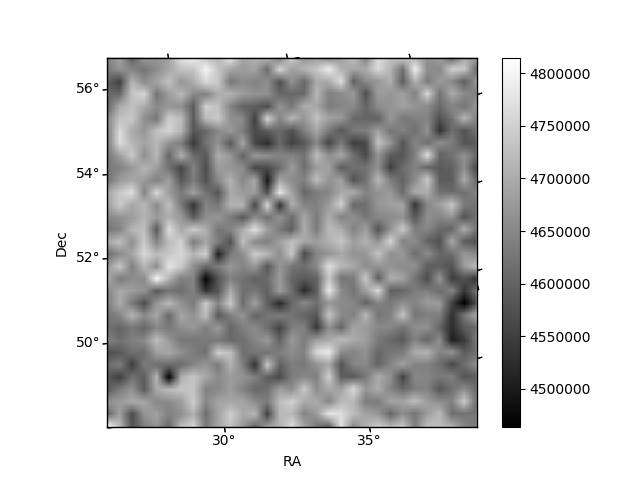
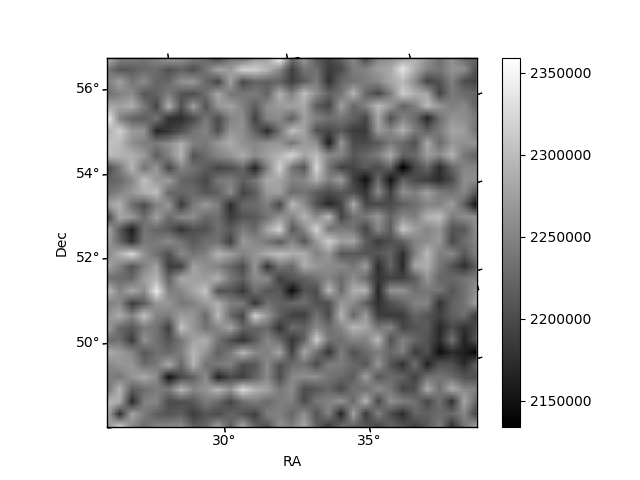
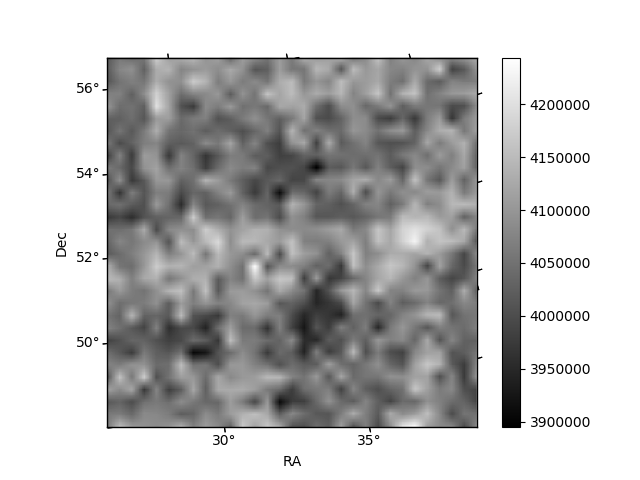
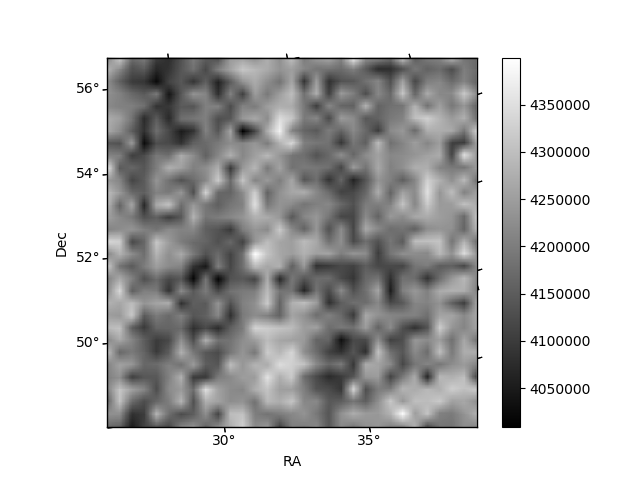
Histogram calculated using DETX and DETY for each event in the final _common_clean file
| Quadrant A | 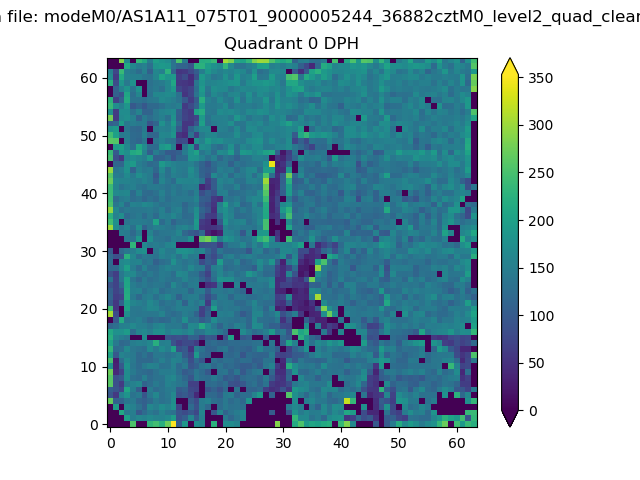 |
 |
Quadrant B |
|---|---|---|---|
| Quadrant D | 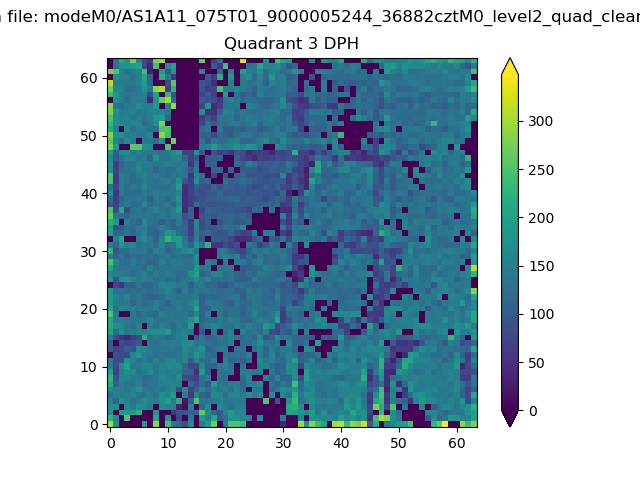 |
 |
Quadrant C |
| Plot type | Count rate plots | Images |
|---|---|---|
| Comparison with Poisson distribution Blue bars denote a histogram of data divided into 1 sec bins. Red curve is a Poisson curve with rate = median count rate of data. |
 |
 |
| Quadrant-wise count rates Data is divided into 100 sec bins |
 |
|
| Module-wise count rates for Quadrant A Data is divided into 100 sec bins |
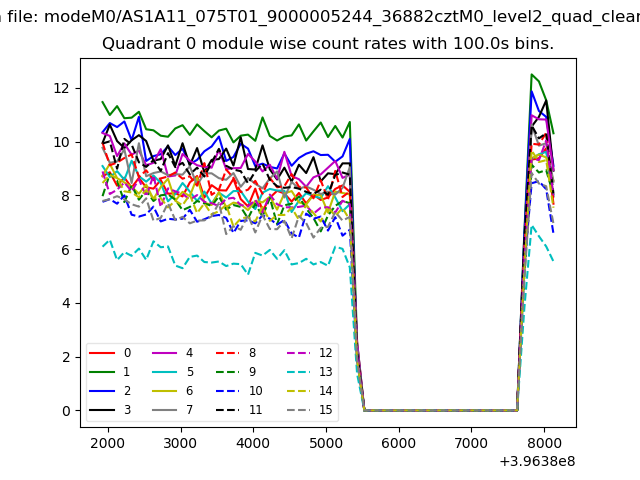 |
 |
| Module-wise count rates for Quadrant B Data is divided into 100 sec bins |
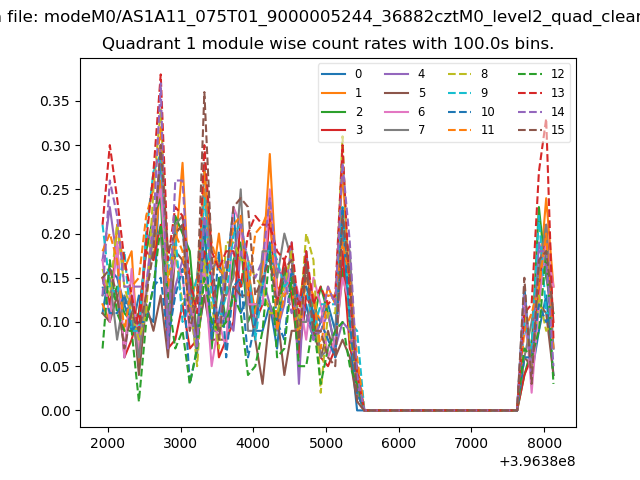 |
 |
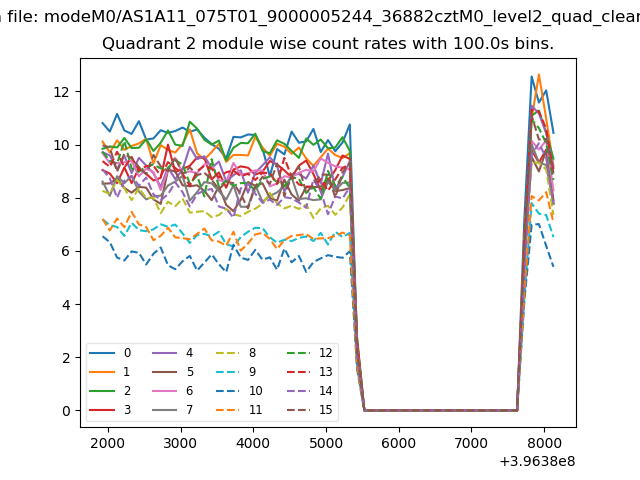
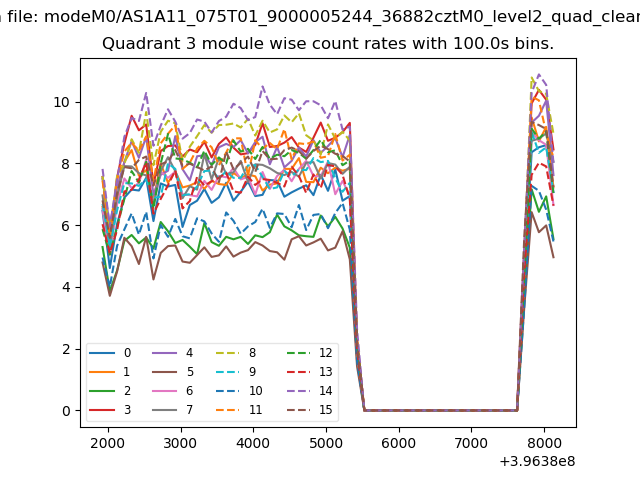
| Module-wise count rates for Quadrant C Data is divided into 100 sec bins |
 |
 |
| Module-wise count rates for Quadrant D Data is divided into 100 sec bins |
 |
 |
| Parameter | Plot |
|---|---|
| CZT HV Monitor | 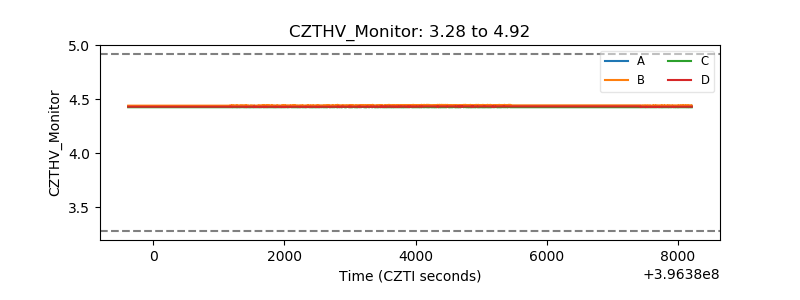 |
| D_VDD | 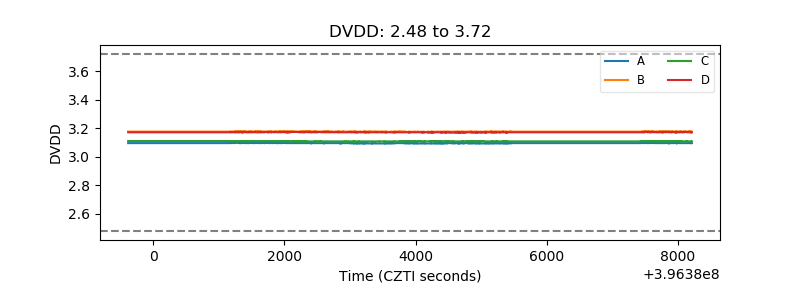 |
| Temperature 1 | 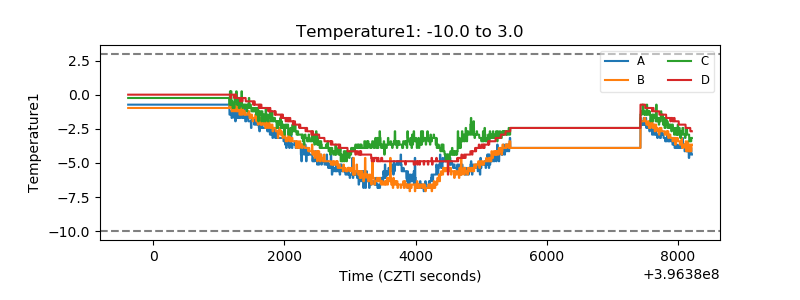 |
| Veto HV Monitor | 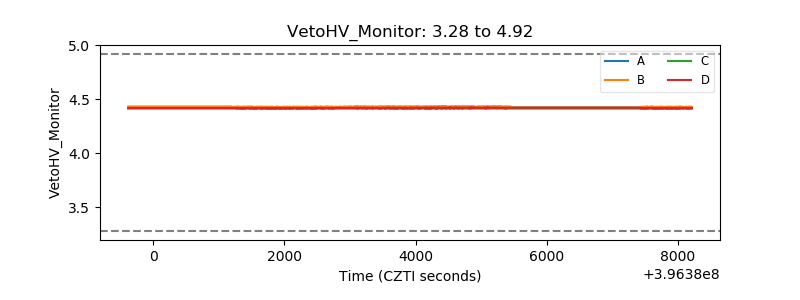 |
| Veto LLD | 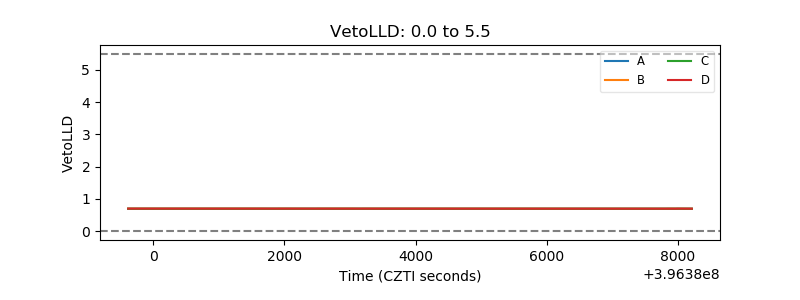 |
| Alpha Counter |  |
| _CPM_Rate | 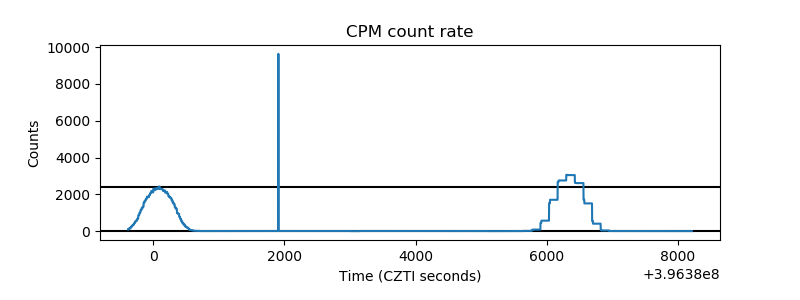 |
| CZT Counter | 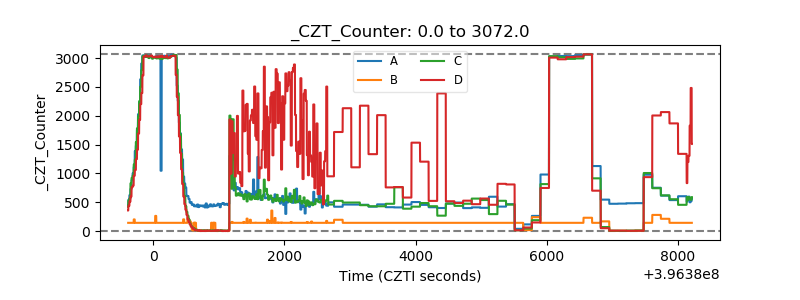 |
| +2.5 Volts monitor |  |
| +5 Volts monitor |  |
| _ROLL_ROT | 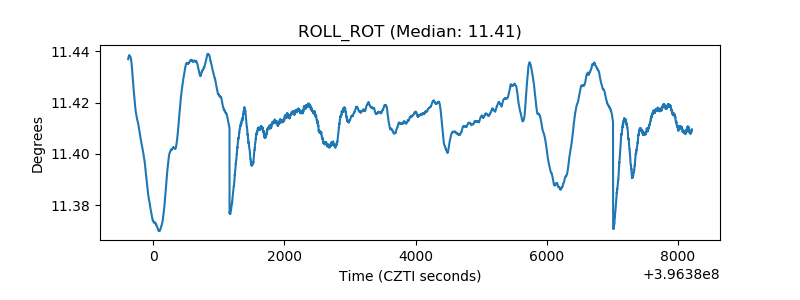 |
| _Roll_DEC | 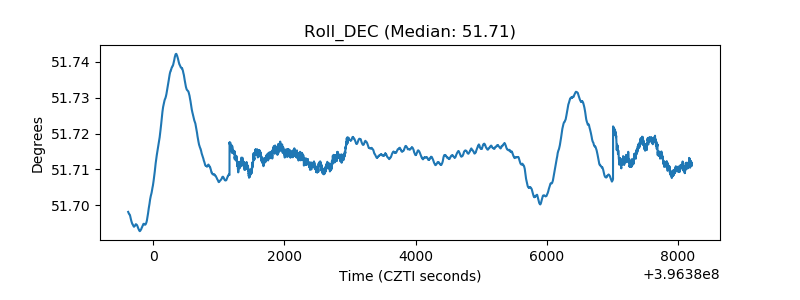 |
| _Roll_RA | 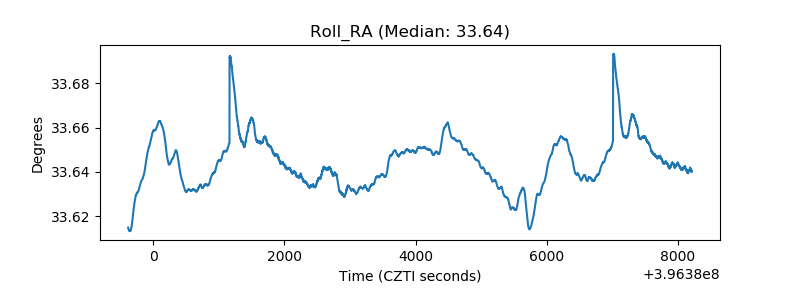 |
| Veto Counter | 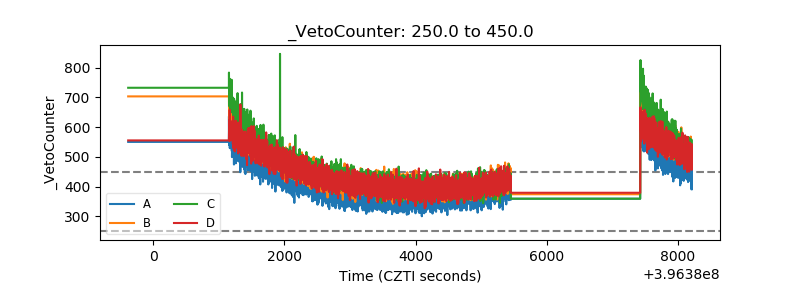 |