| Param | Original file | Final file |
|---|---|---|
| Filename | modeM0/AS1A11_075T01_9000005244_36883cztM0_level2.evt | modeM0/AS1A11_075T01_9000005244_36883cztM0_level2_quad_clean.evt |
| Size (bytes) | 387,172,800 | 75,680,640 |
| Size | 369.2 MB | 72.2 MB |
| Events in quadrant A | 2,632,961 | 653,104 |
| Events in quadrant B | 763,883 | 9,429 |
| Events in quadrant C | 2,856,420 | 670,632 |
| Events in quadrant D | 5,126,816 | 604,742 |
| Mode SS | |||
|---|---|---|---|
| Quadrant | BADHDUFLAG | Total packets | Discarded packets |
| A | 0 | 102 | 0 |
| B | 0 | 102 | 0 |
| C | 0 | 102 | 0 |
| D | 0 | 102 | 0 |
| Mode M0 | |||
|---|---|---|---|
| Quadrant | BADHDUFLAG | Total packets | Discarded packets |
| A | 0 | 10987 | 3 |
| B | 0 | 5107 | 2 |
| C | 0 | 11498 | 2 |
| D | 0 | 18686 | 2 |
| Mode M9 | |||
|---|---|---|---|
| Quadrant | BADHDUFLAG | Total packets | Discarded packets |
| A | 0 | 25 | 0 |
| B | 0 | 25 | 0 |
| C | 0 | 25 | 0 |
| D | 0 | 26 | 0 |
| Quadrant | Total seconds | Saturated seconds | Saturation percentage |
|---|---|---|---|
| A | 5012 | 24 | 0.478851% |
| B | 5012 | 5012 | 100.000000% |
| C | 5012 | 91 | 1.815642% |
| D | 5012 | 472 | 9.417398% |
Noise dominated data is calculated using 1-second bins in cleaned event files. If a bin has >2000 counts, and if more than 50% of those come from <1% of pixels, then it is considered to be noise-dominated and hence unusable.
| Quadrant | # 1 sec bins | Bins with >0 counts | Bins with >2000 counts | High rate bins dominated by noise | Noise dominated (total time) | Noise dominated (detector-on time) | Marked lightcurve |
|---|---|---|---|---|---|---|---|
| A | 7075 | 5013 | 12 | 12 | 0.17% | 0.24% | 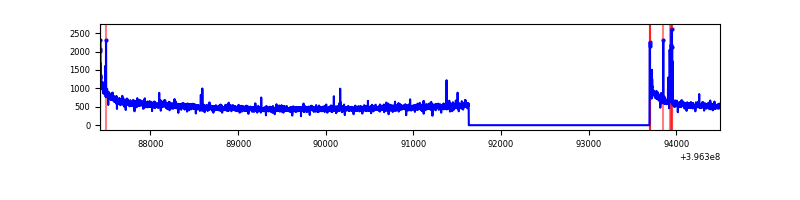 |
| B | 7074 | 5011 | 0 | 0 | 0.00% | 0.00% | 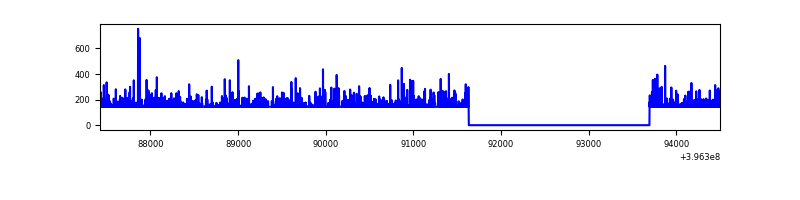 |
| C | 7075 | 5013 | 59 | 59 | 0.83% | 1.18% | 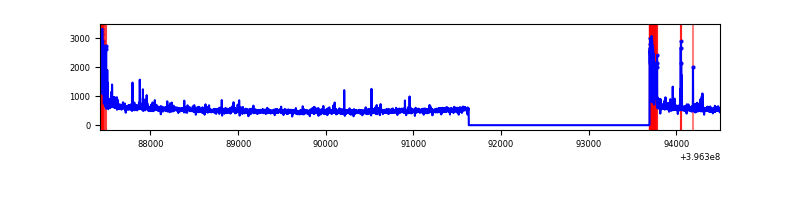 |
| D | 7075 | 5013 | 452 | 452 | 6.39% | 9.02% | 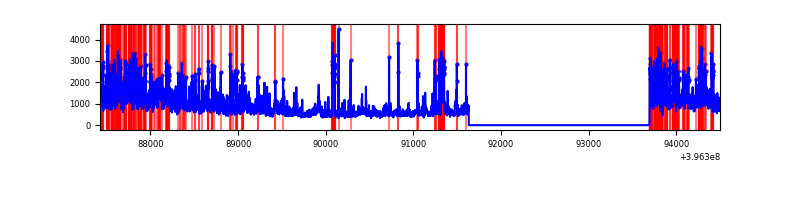 |
Top three noisy pixels from each quadrant. If the there are fewer than three noisy pixels in the level2.evt file, extra rows are filled as -1
| Pixel properties | Quadrant properties | ||||||
|---|---|---|---|---|---|---|---|
| Quadrant | DetID | PixID | Counts | Sigma | Mean | Median | Sigma |
| A | 10 | 83 | 235793 | 1922.39 | 603 | 592 | 122.3 |
| A | 13 | 248 | 40339 | 324.87 | 603 | 592 | 122.3 |
| A | 13 | 6 | 13588 | 106.22 | 603 | 592 | 122.3 |
| B | 12 | 243 | 695332 | 184422.46 | 10 | 10 | 3.8 |
| B | 12 | 144 | 12707 | 3367.67 | 10 | 10 | 3.8 |
| B | 0 | 190 | 5110 | 1352.69 | 10 | 10 | 3.8 |
| C | 0 | 10 | 284359 | 2077.45 | 599 | 606 | 136.6 |
| C | 15 | 214 | 211659 | 1545.19 | 599 | 606 | 136.6 |
| C | 15 | 208 | 17409 | 123.02 | 599 | 606 | 136.6 |
| D | 12 | 235 | 1911584 | 13837.18 | 575 | 563 | 138.1 |
| D | 13 | 171 | 211355 | 1526.29 | 575 | 563 | 138.1 |
| D | 13 | 249 | 208669 | 1506.84 | 575 | 563 | 138.1 |
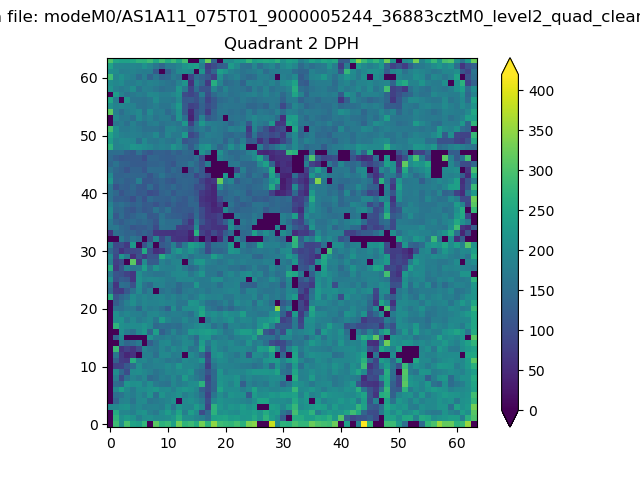
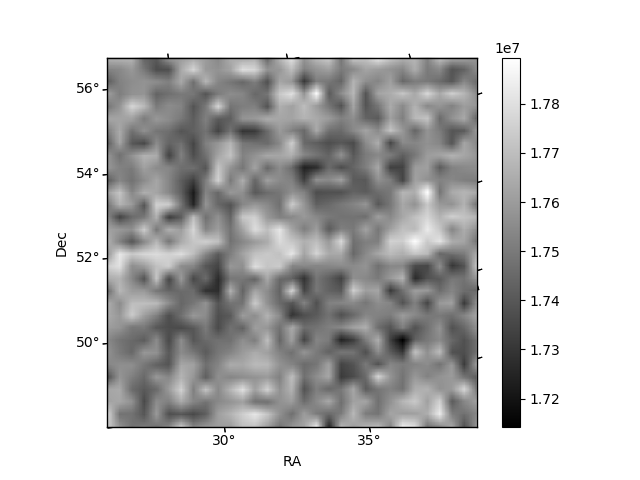
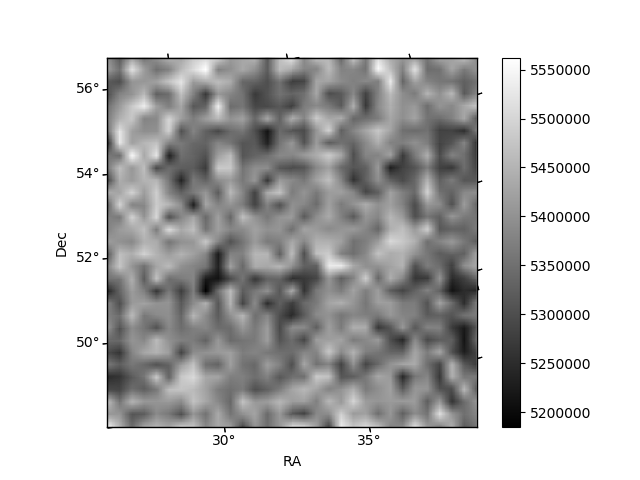
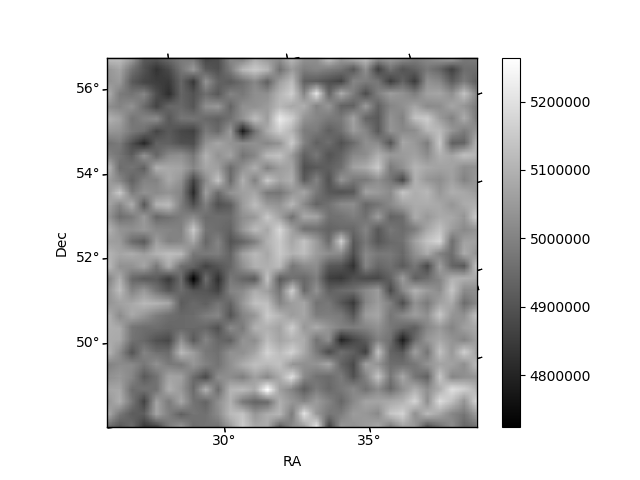
Histogram calculated using DETX and DETY for each event in the final _common_clean file
| Quadrant A | 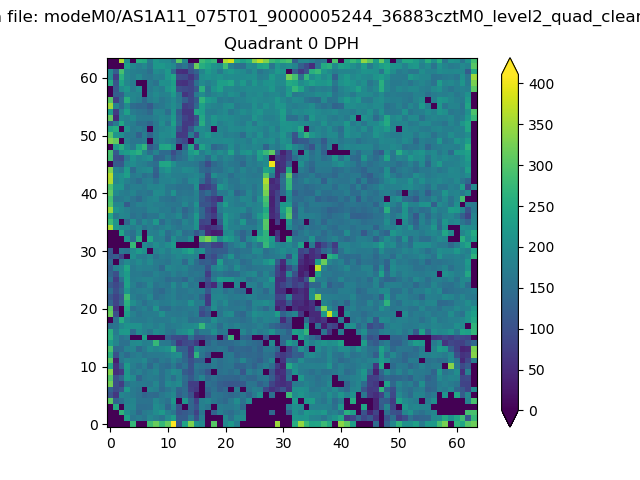 |
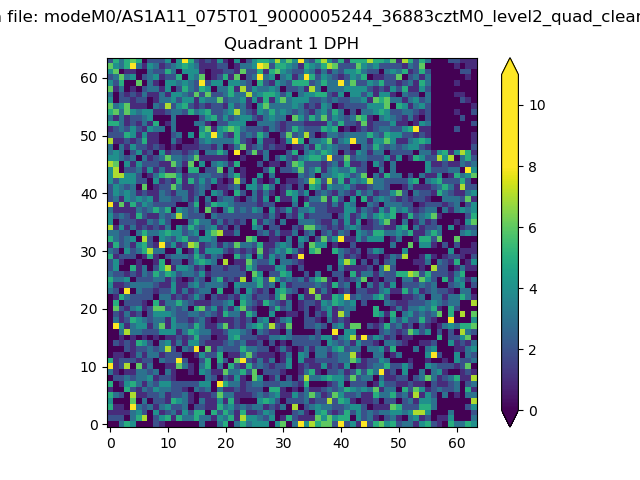 |
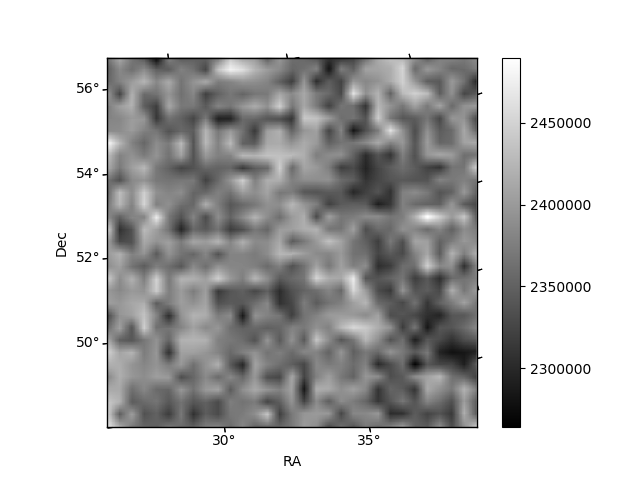
Quadrant B |
|---|---|---|---|
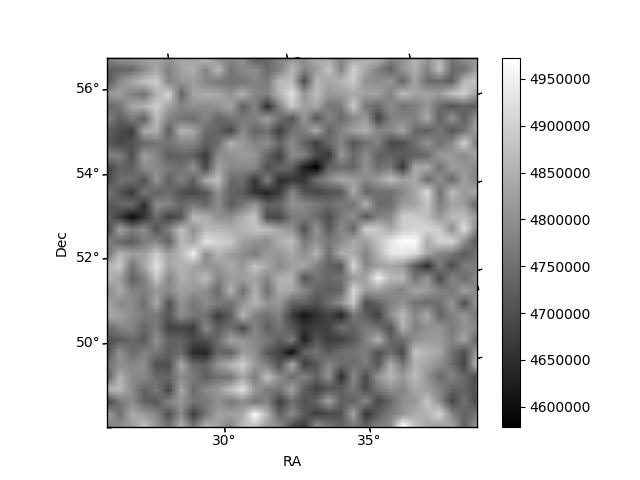
| Quadrant D | 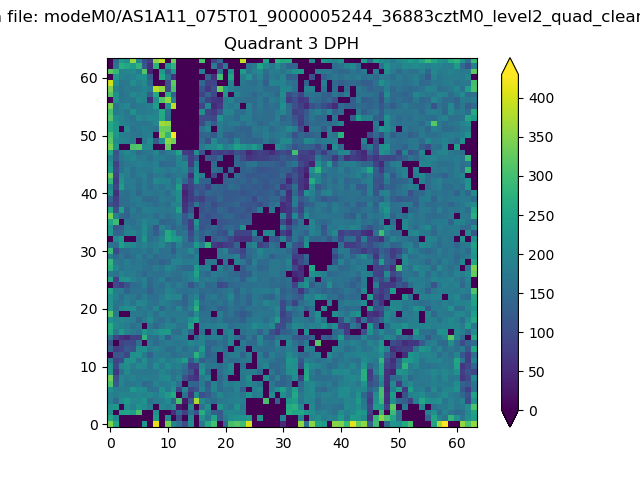 |
 |
Quadrant C |
| Plot type | Count rate plots | Images |
|---|---|---|
| Comparison with Poisson distribution Blue bars denote a histogram of data divided into 1 sec bins. Red curve is a Poisson curve with rate = median count rate of data. |
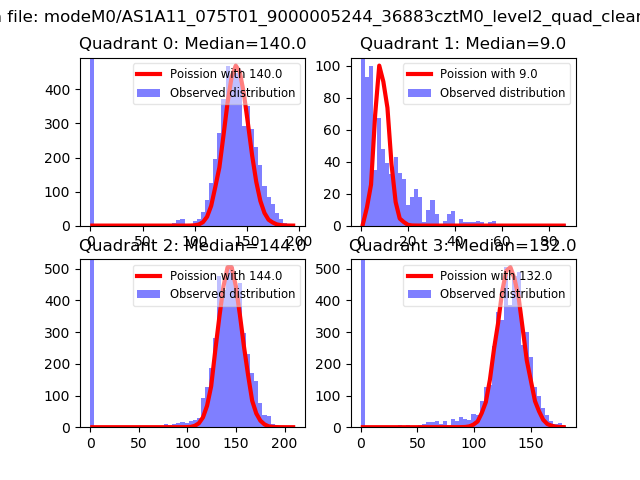 |
 |
| Quadrant-wise count rates Data is divided into 100 sec bins |
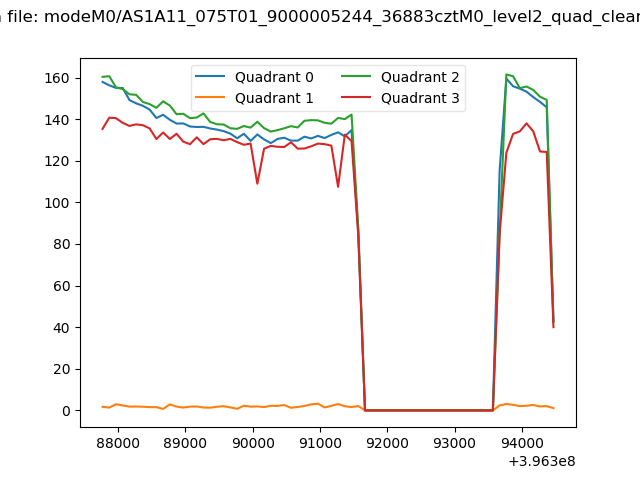 |
|
| Module-wise count rates for Quadrant A Data is divided into 100 sec bins |
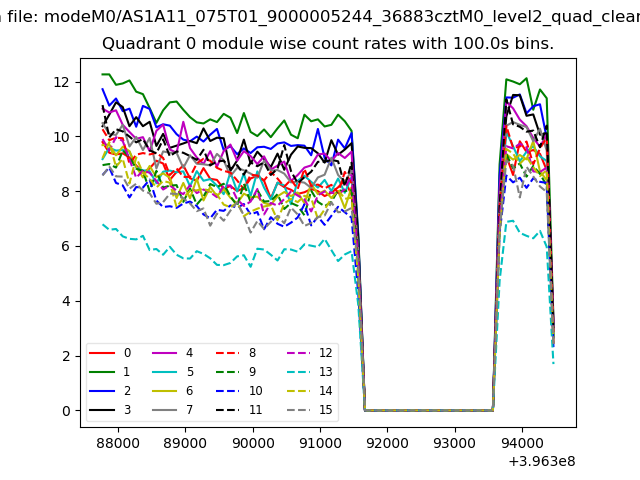 |
 |
| Module-wise count rates for Quadrant B Data is divided into 100 sec bins |
 |
 |
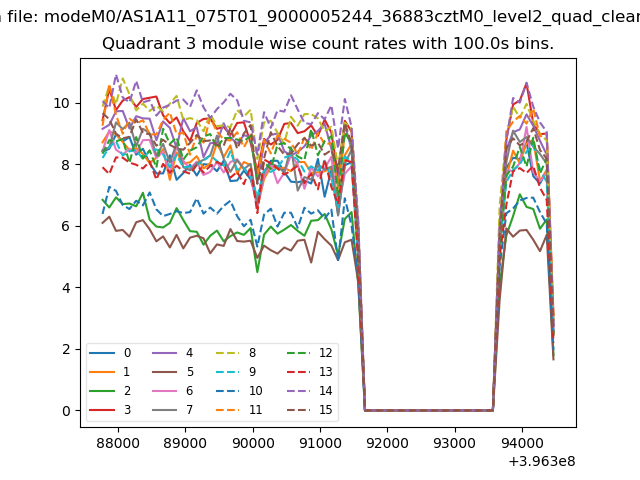
| Module-wise count rates for Quadrant C Data is divided into 100 sec bins |
 |
 |
| Module-wise count rates for Quadrant D Data is divided into 100 sec bins |
 |
 |
| Parameter | Plot |
|---|---|
| CZT HV Monitor |  |
| D_VDD | 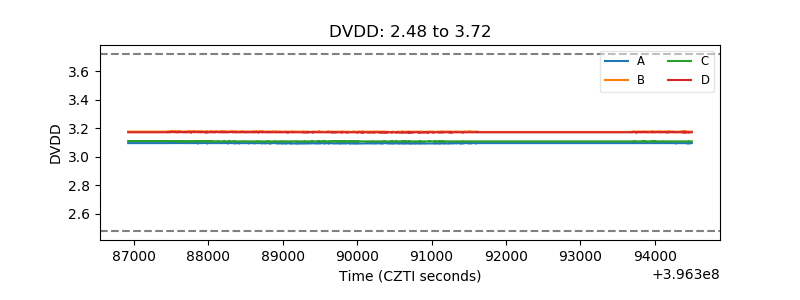 |
| Temperature 1 | 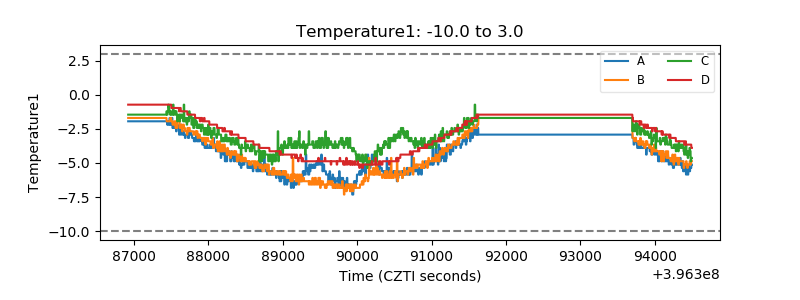 |
| Veto HV Monitor |  |
| Veto LLD | 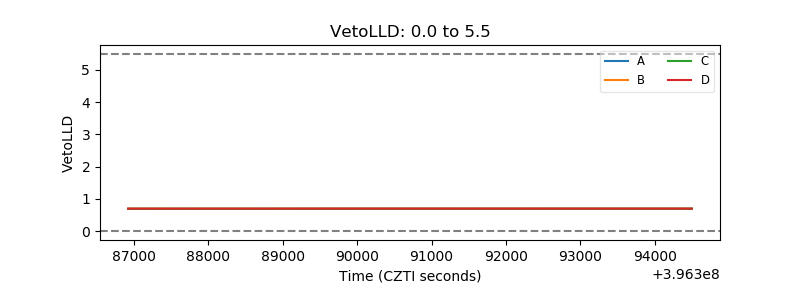 |
| Alpha Counter | 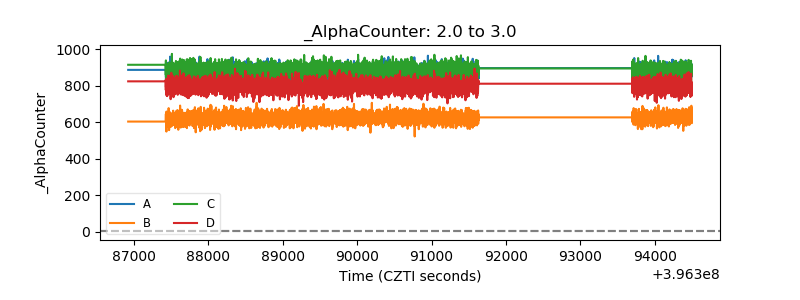 |
| _CPM_Rate | 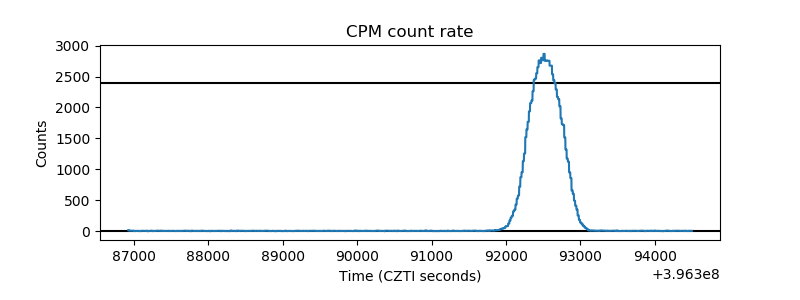 |
| CZT Counter | 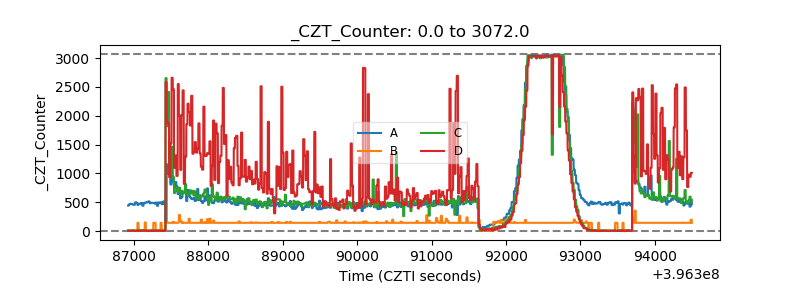 |
| +2.5 Volts monitor | 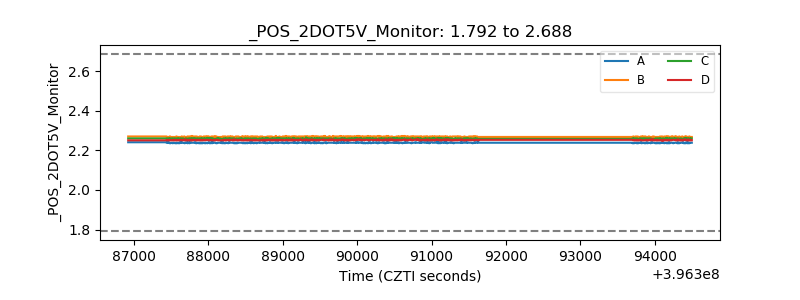 |
| +5 Volts monitor |  |
| _ROLL_ROT |  |
| _Roll_DEC | 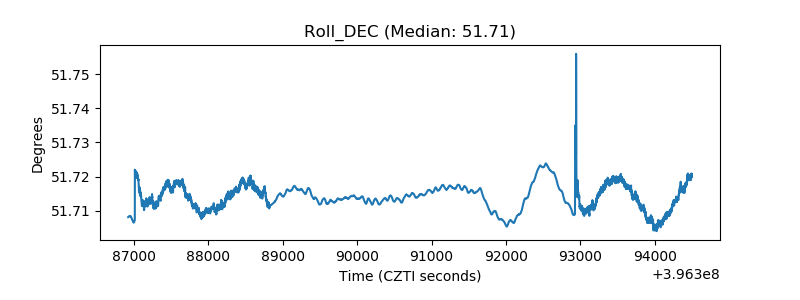 |
| _Roll_RA | 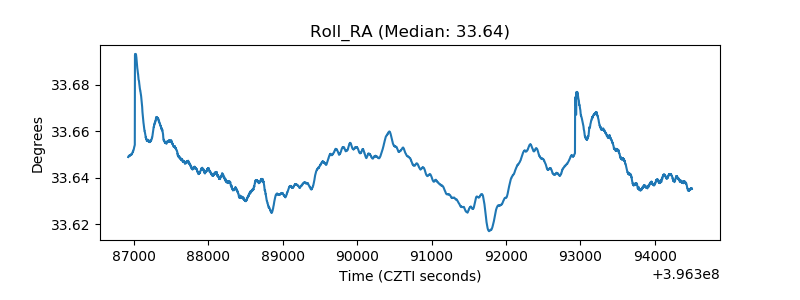 |
| Veto Counter |  |