| Param | Original file | Final file |
|---|---|---|
| Filename | modeM0/AS1A11_075T01_9000005244_36884cztM0_level2.evt | modeM0/AS1A11_075T01_9000005244_36884cztM0_level2_quad_clean.evt |
| Size (bytes) | 338,437,440 | 71,199,360 |
| Size | 322.8 MB | 67.9 MB |
| Events in quadrant A | 2,434,016 | 609,287 |
| Events in quadrant B | 731,963 | 9,655 |
| Events in quadrant C | 2,733,221 | 622,692 |
| Events in quadrant D | 4,018,154 | 574,645 |
| Mode SS | |||
|---|---|---|---|
| Quadrant | BADHDUFLAG | Total packets | Discarded packets |
| A | 0 | 100 | 0 |
| B | 0 | 100 | 0 |
| C | 0 | 100 | 0 |
| D | 0 | 100 | 0 |
| Mode M0 | |||
|---|---|---|---|
| Quadrant | BADHDUFLAG | Total packets | Discarded packets |
| A | 0 | 10295 | 3 |
| B | 0 | 4891 | 2 |
| C | 0 | 10964 | 2 |
| D | 0 | 15271 | 2 |
| Mode M9 | |||
|---|---|---|---|
| Quadrant | BADHDUFLAG | Total packets | Discarded packets |
| A | 0 | 34 | 0 |
| B | 0 | 34 | 0 |
| C | 0 | 34 | 0 |
| D | 0 | 35 | 0 |
| Quadrant | Total seconds | Saturated seconds | Saturation percentage |
|---|---|---|---|
| A | 4801 | 15 | 0.312435% |
| B | 4801 | 4801 | 100.000000% |
| C | 4801 | 124 | 2.582795% |
| D | 4801 | 204 | 4.249115% |
Noise dominated data is calculated using 1-second bins in cleaned event files. If a bin has >2000 counts, and if more than 50% of those come from <1% of pixels, then it is considered to be noise-dominated and hence unusable.
| Quadrant | # 1 sec bins | Bins with >0 counts | Bins with >2000 counts | High rate bins dominated by noise | Noise dominated (total time) | Noise dominated (detector-on time) | Marked lightcurve |
|---|---|---|---|---|---|---|---|
| A | 6924 | 4802 | 10 | 10 | 0.14% | 0.21% | 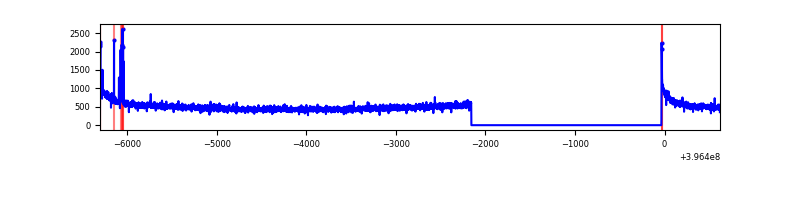 |
| B | 6923 | 4800 | 0 | 0 | 0.00% | 0.00% | 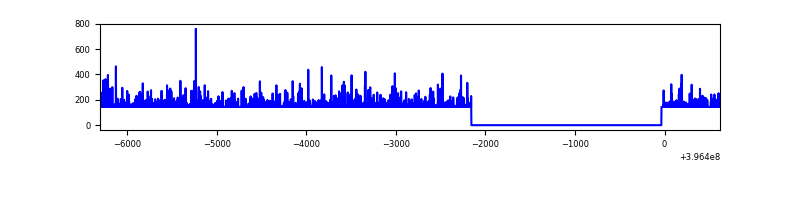 |
| C | 6924 | 4802 | 83 | 83 | 1.20% | 1.73% | 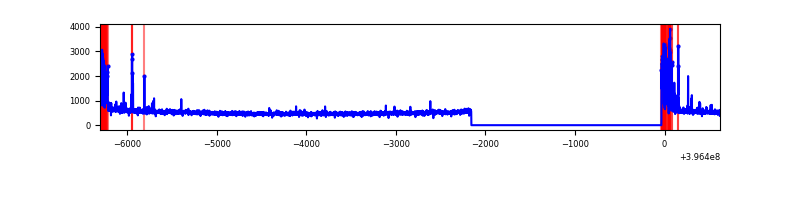 |
| D | 6924 | 4802 | 199 | 199 | 2.87% | 4.14% | 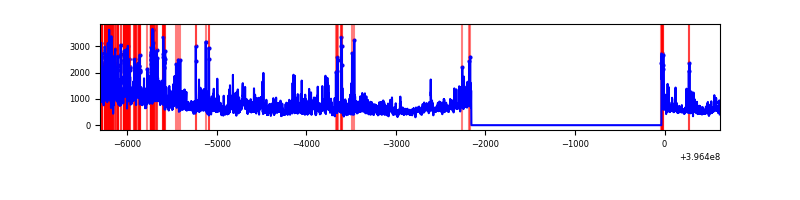 |
Top three noisy pixels from each quadrant. If the there are fewer than three noisy pixels in the level2.evt file, extra rows are filled as -1
| Pixel properties | Quadrant properties | ||||||
|---|---|---|---|---|---|---|---|
| Quadrant | DetID | PixID | Counts | Sigma | Mean | Median | Sigma |
| A | 10 | 83 | 220216 | 1960.44 | 559 | 550 | 112.0 |
| A | 13 | 248 | 30667 | 268.78 | 559 | 550 | 112.0 |
| A | 13 | 6 | 12704 | 108.47 | 559 | 550 | 112.0 |
| B | 12 | 243 | 666046 | 178429.17 | 10 | 10 | 3.7 |
| B | 12 | 144 | 12392 | 3317.1 | 10 | 10 | 3.7 |
| B | 0 | 190 | 4960 | 1326.09 | 10 | 10 | 3.7 |
| C | 0 | 10 | 339222 | 2682.13 | 553 | 560 | 126.3 |
| C | 15 | 214 | 202215 | 1597.06 | 553 | 560 | 126.3 |
| C | 3 | 233 | 18504 | 142.11 | 553 | 560 | 126.3 |
| D | 12 | 235 | 1397361 | 10758.88 | 541 | 528 | 129.8 |
| D | 13 | 171 | 191382 | 1470.02 | 541 | 528 | 129.8 |
| D | 13 | 249 | 108398 | 830.85 | 541 | 528 | 129.8 |
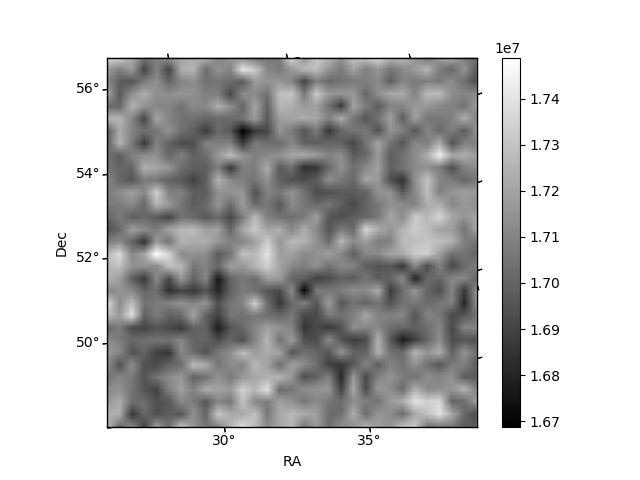
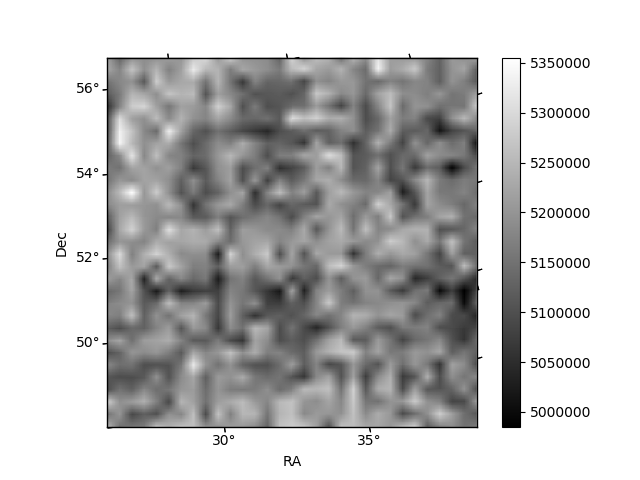
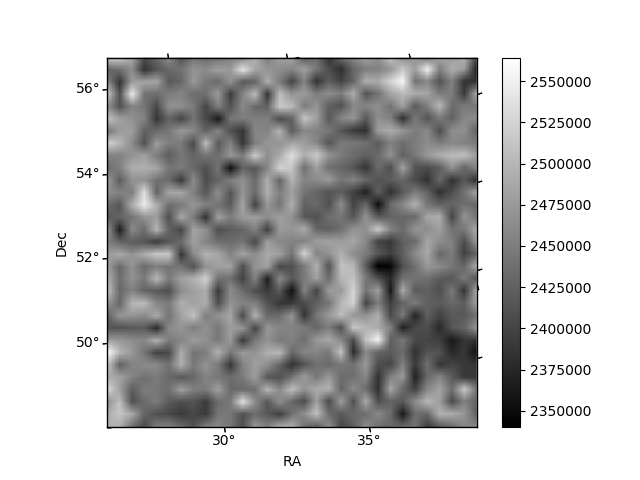
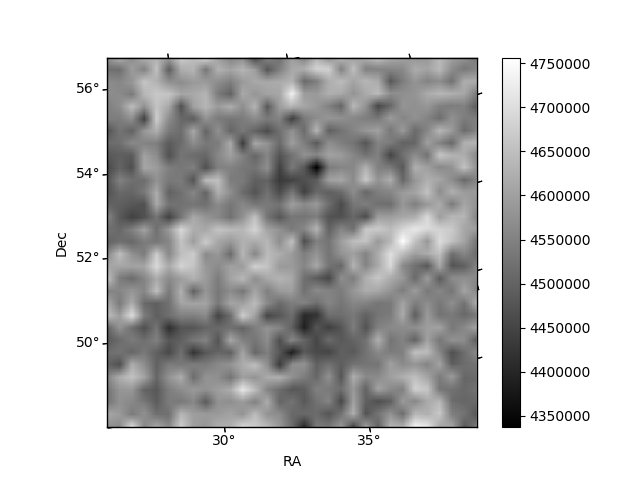
Histogram calculated using DETX and DETY for each event in the final _common_clean file
| Quadrant A | 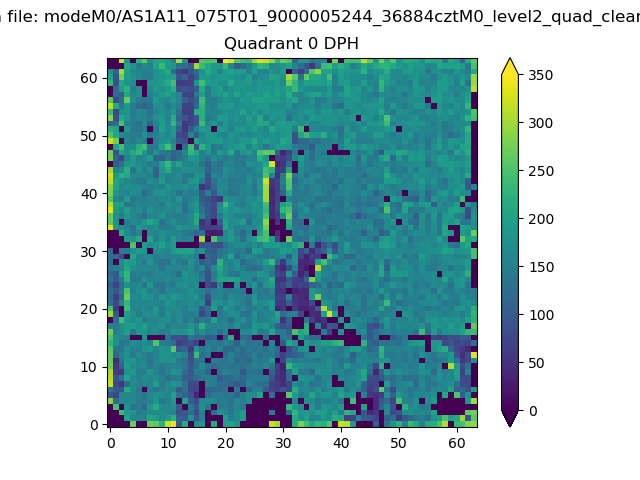 |
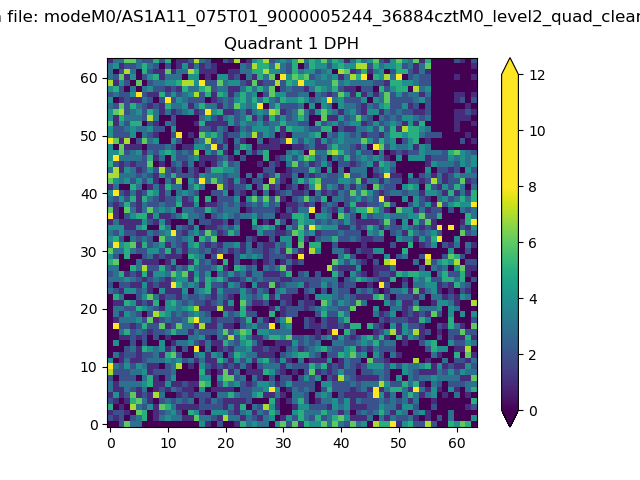 |
Quadrant B |
|---|---|---|---|
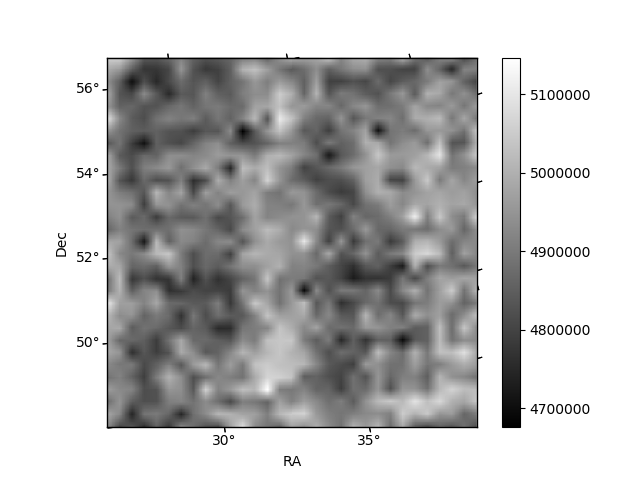
| Quadrant D | 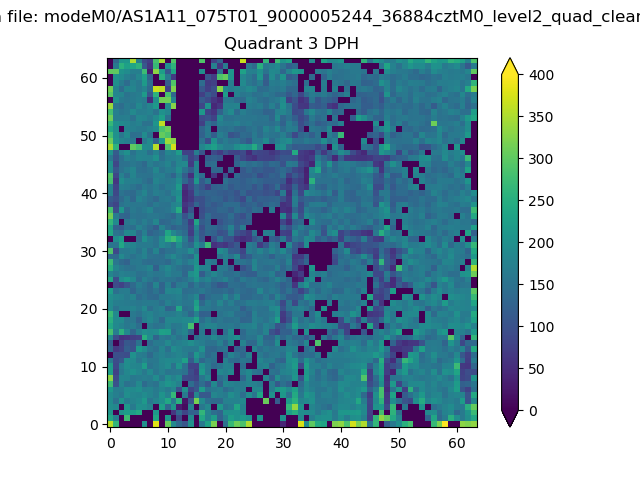 |
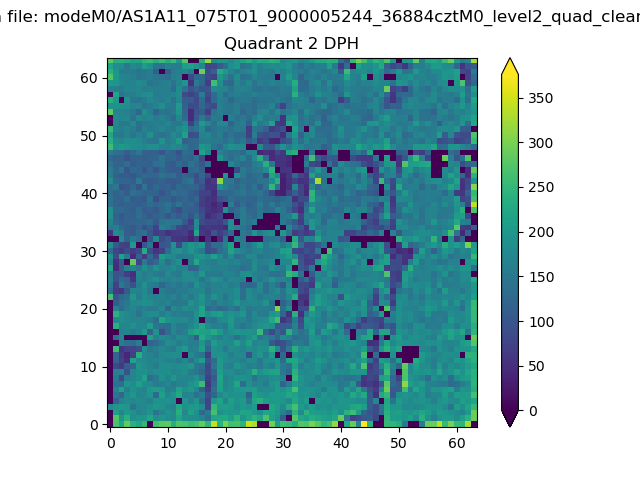 |
Quadrant C |
| Plot type | Count rate plots | Images |
|---|---|---|
| Comparison with Poisson distribution Blue bars denote a histogram of data divided into 1 sec bins. Red curve is a Poisson curve with rate = median count rate of data. |
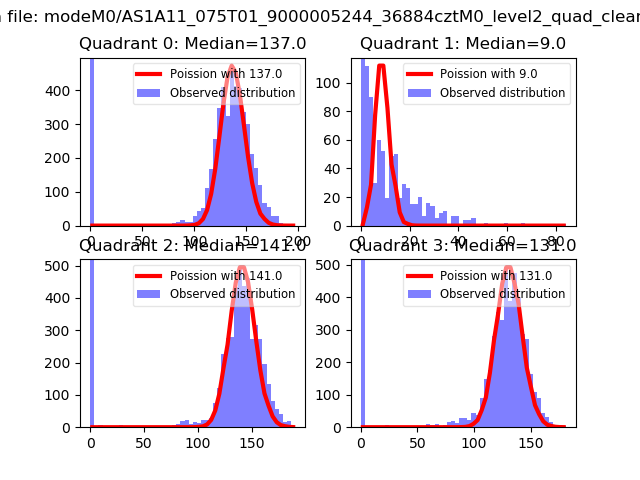 |
 |
| Quadrant-wise count rates Data is divided into 100 sec bins |
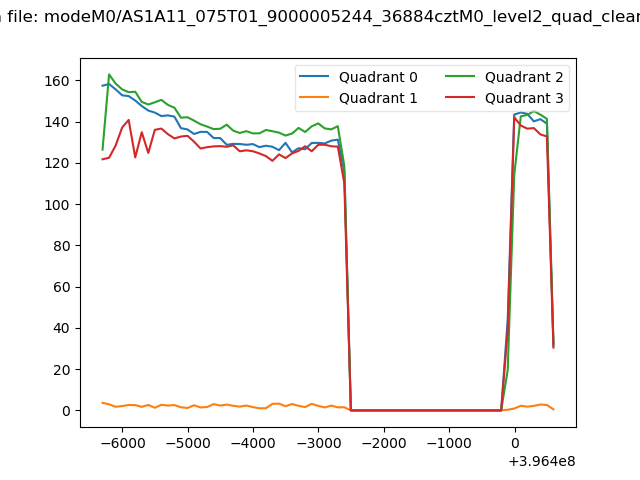 |
|
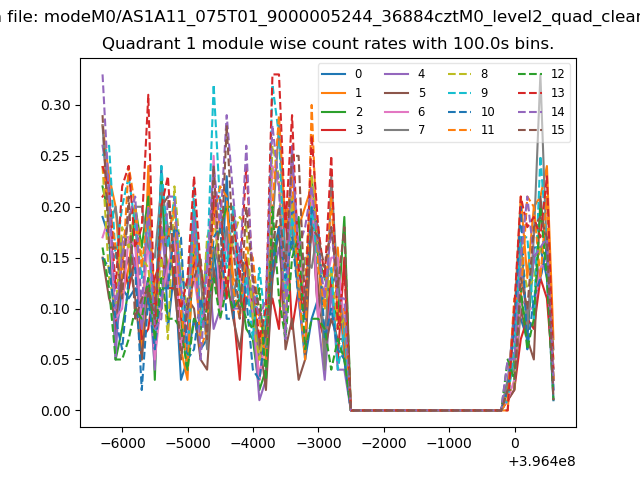
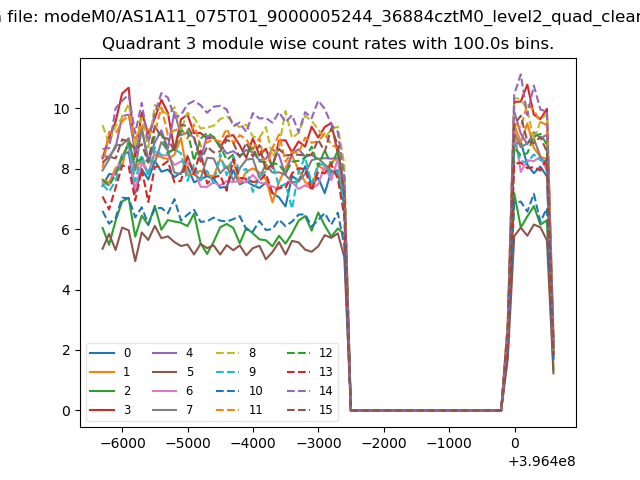
| Module-wise count rates for Quadrant A Data is divided into 100 sec bins |
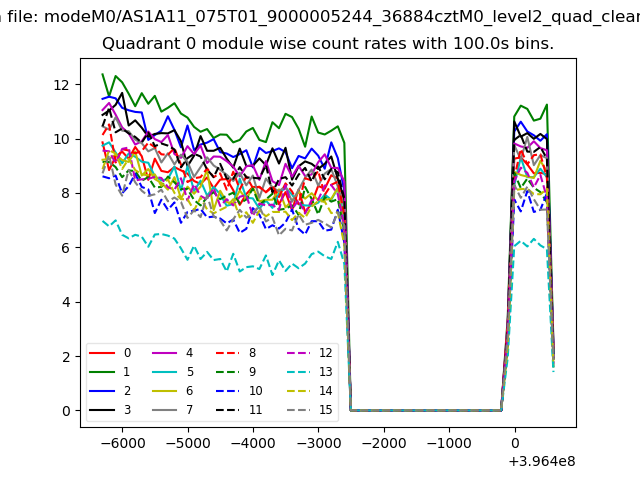 |
 |
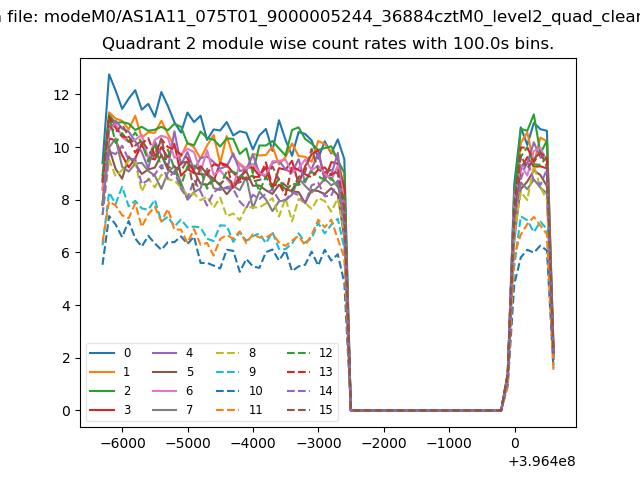
| Module-wise count rates for Quadrant B Data is divided into 100 sec bins |
 |
 |
| Module-wise count rates for Quadrant C Data is divided into 100 sec bins |
 |
 |
| Module-wise count rates for Quadrant D Data is divided into 100 sec bins |
 |
 |
| Parameter | Plot |
|---|---|
| CZT HV Monitor | 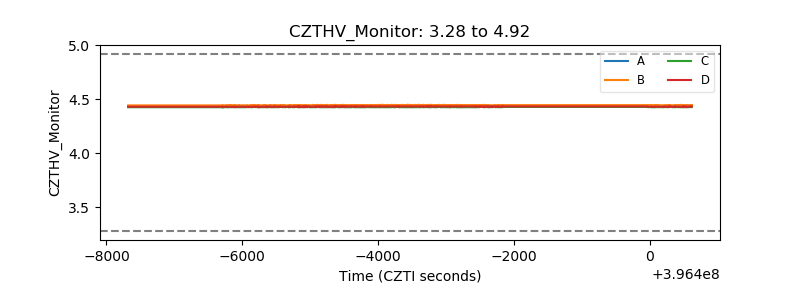 |
| D_VDD |  |
| Temperature 1 | 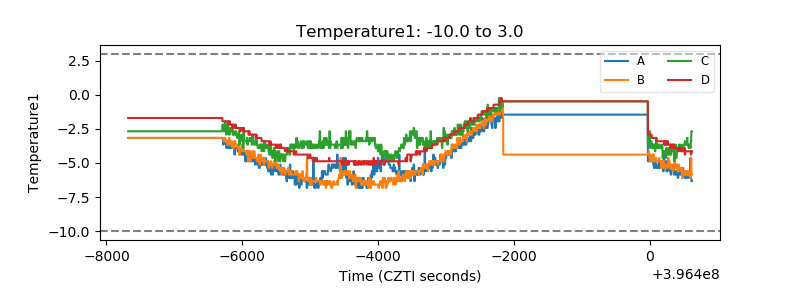 |
| Veto HV Monitor | 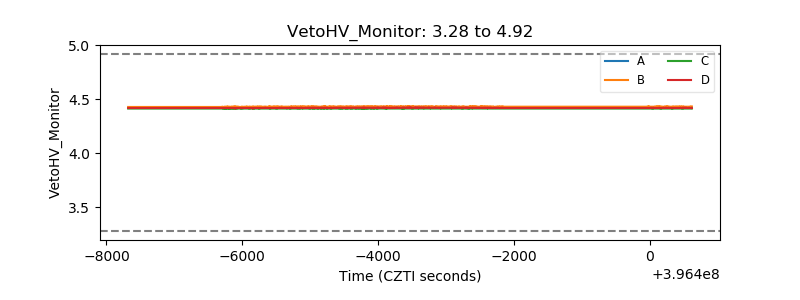 |
| Veto LLD | 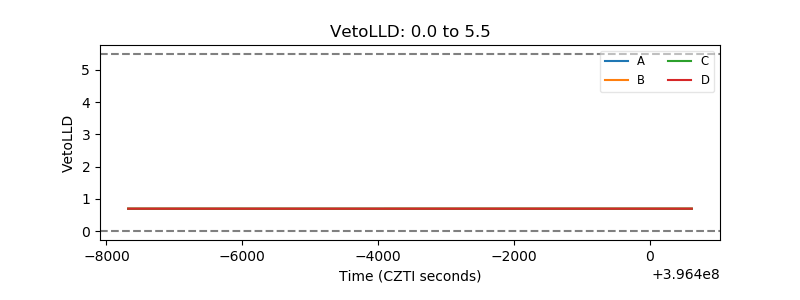 |
| Alpha Counter | 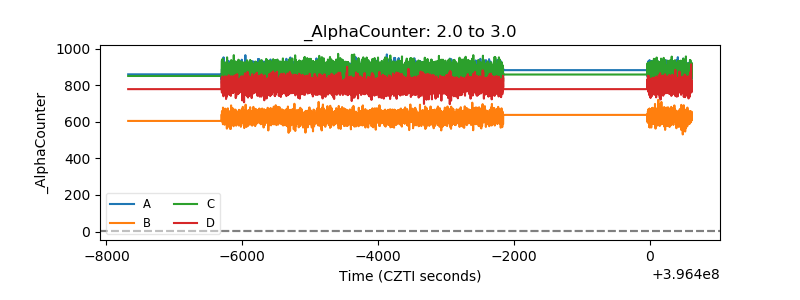 |
| _CPM_Rate | 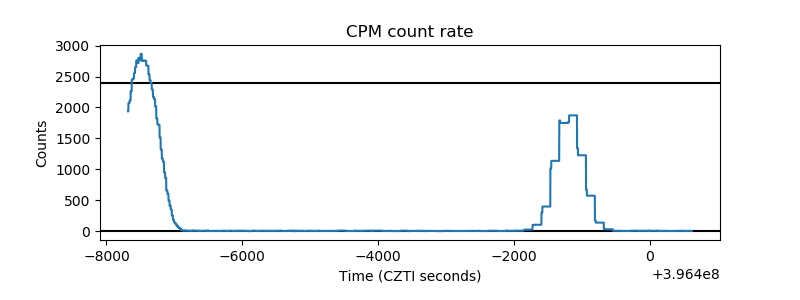 |
| CZT Counter | 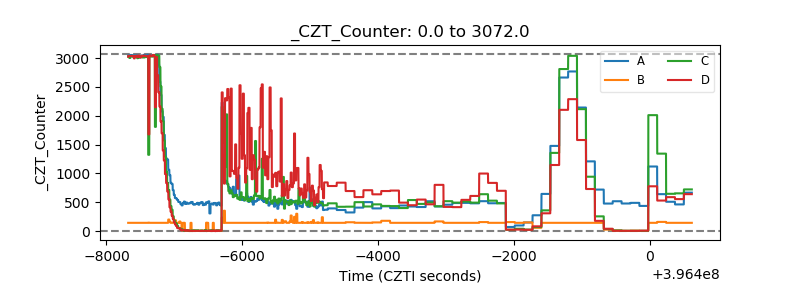 |
| +2.5 Volts monitor |  |
| +5 Volts monitor |  |
| _ROLL_ROT | 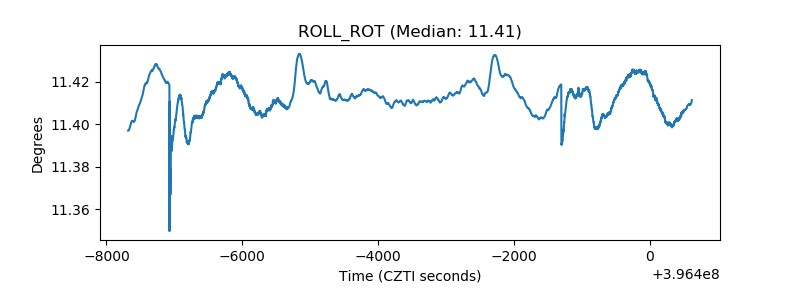 |
| _Roll_DEC | 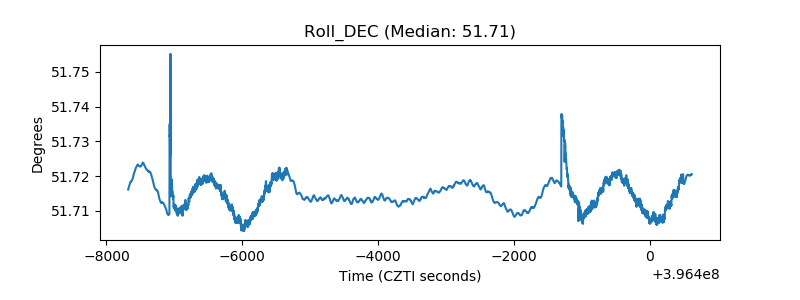 |
| _Roll_RA | 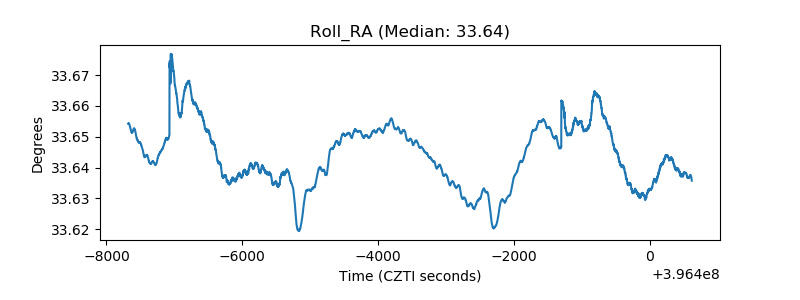 |
| Veto Counter | 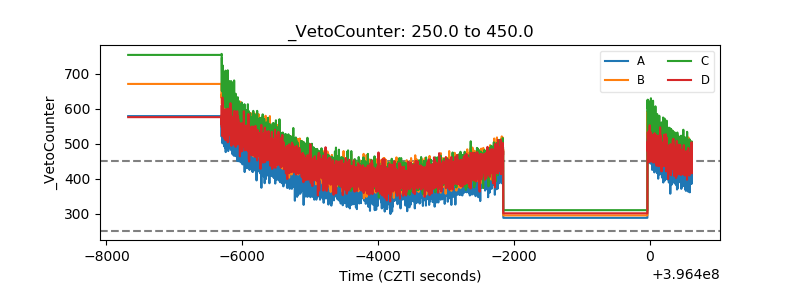 |