| Param | Original file | Final file |
|---|---|---|
| Filename | modeM0/AS1A11_075T01_9000005244_36885cztM0_level2.evt | modeM0/AS1A11_075T01_9000005244_36885cztM0_level2_quad_clean.evt |
| Size (bytes) | 313,848,000 | 65,030,400 |
| Size | 299.3 MB | 62.0 MB |
| Events in quadrant A | 2,383,365 | 538,826 |
| Events in quadrant B | 753,115 | 7,964 |
| Events in quadrant C | 2,746,918 | 551,326 |
| Events in quadrant D | 3,278,262 | 521,013 |
| Mode SS | |||
|---|---|---|---|
| Quadrant | BADHDUFLAG | Total packets | Discarded packets |
| A | 0 | 102 | 0 |
| B | 0 | 102 | 0 |
| C | 0 | 102 | 0 |
| D | 0 | 102 | 0 |
| Mode M0 | |||
|---|---|---|---|
| Quadrant | BADHDUFLAG | Total packets | Discarded packets |
| A | 0 | 10379 | 3 |
| B | 0 | 5027 | 2 |
| C | 0 | 11272 | 2 |
| D | 0 | 13102 | 2 |
| Mode M9 | |||
|---|---|---|---|
| Quadrant | BADHDUFLAG | Total packets | Discarded packets |
| A | 0 | 43 | 0 |
| B | 0 | 43 | 0 |
| C | 0 | 43 | 0 |
| D | 0 | 43 | 0 |
| Quadrant | Total seconds | Saturated seconds | Saturation percentage |
|---|---|---|---|
| A | 4964 | 7 | 0.141015% |
| B | 4964 | 4964 | 100.000000% |
| C | 4964 | 112 | 2.256245% |
| D | 4964 | 77 | 1.551168% |
Noise dominated data is calculated using 1-second bins in cleaned event files. If a bin has >2000 counts, and if more than 50% of those come from <1% of pixels, then it is considered to be noise-dominated and hence unusable.
| Quadrant | # 1 sec bins | Bins with >0 counts | Bins with >2000 counts | High rate bins dominated by noise | Noise dominated (total time) | Noise dominated (detector-on time) | Marked lightcurve |
|---|---|---|---|---|---|---|---|
| A | 9210 | 4966 | 3 | 3 | 0.03% | 0.06% | 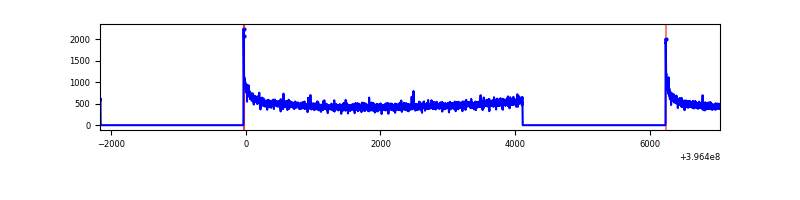 |
| B | 9209 | 4963 | 0 | 0 | 0.00% | 0.00% | 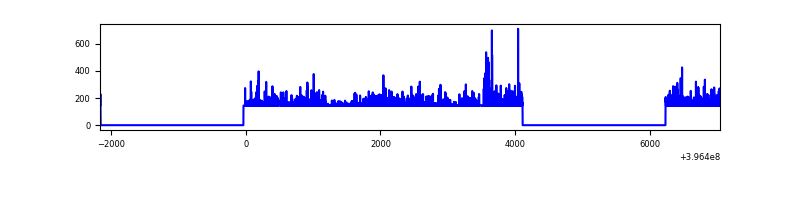 |
| C | 9210 | 4966 | 75 | 75 | 0.81% | 1.51% | 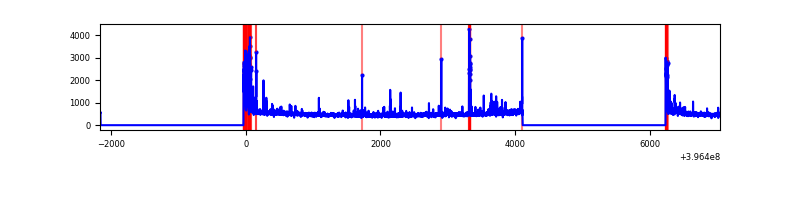 |
| D | 9210 | 4966 | 81 | 81 | 0.88% | 1.63% | 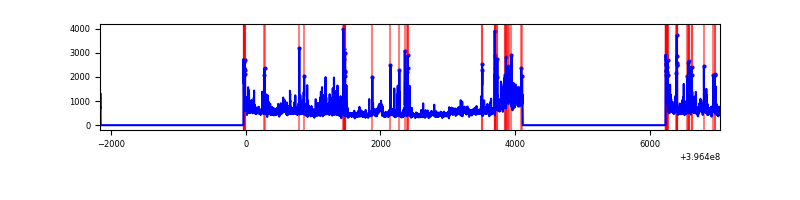 |
Top three noisy pixels from each quadrant. If the there are fewer than three noisy pixels in the level2.evt file, extra rows are filled as -1
| Pixel properties | Quadrant properties | ||||||
|---|---|---|---|---|---|---|---|
| Quadrant | DetID | PixID | Counts | Sigma | Mean | Median | Sigma |
| A | 10 | 83 | 218254 | 1941.02 | 554 | 544 | 112.2 |
| A | 13 | 6 | 16368 | 141.08 | 554 | 544 | 112.2 |
| A | 13 | 254 | 7930 | 65.85 | 554 | 544 | 112.2 |
| B | 12 | 243 | 689688 | 187796.19 | 10 | 10 | 3.7 |
| B | 12 | 144 | 12244 | 3331.26 | 10 | 10 | 3.7 |
| B | 5 | 172 | 3522 | 956.3 | 10 | 10 | 3.7 |
| C | 0 | 10 | 293051 | 2322.96 | 545 | 552 | 125.9 |
| C | 15 | 214 | 209559 | 1659.89 | 545 | 552 | 125.9 |
| C | 15 | 159 | 82634 | 651.88 | 545 | 552 | 125.9 |
| D | 12 | 235 | 791346 | 6072.45 | 538 | 523 | 130.2 |
| D | 2 | 250 | 98331 | 751.03 | 538 | 523 | 130.2 |
| D | 13 | 249 | 97717 | 746.32 | 538 | 523 | 130.2 |
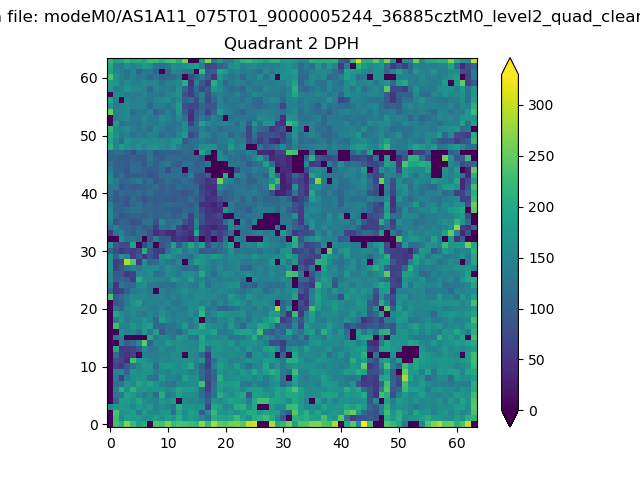
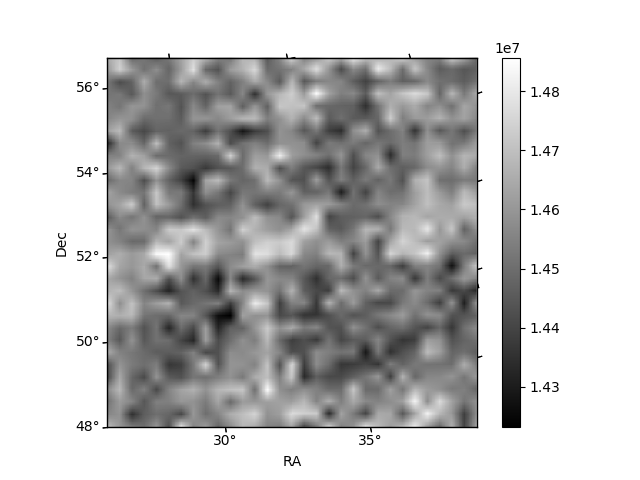
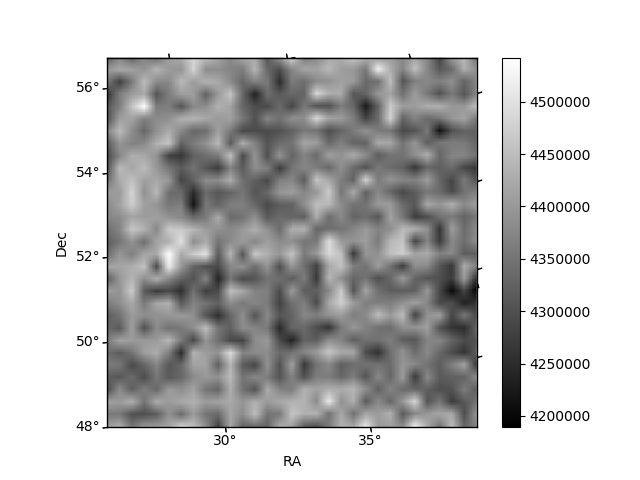
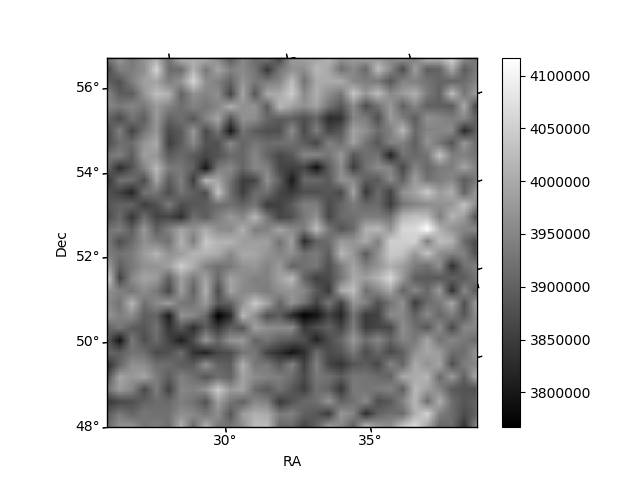
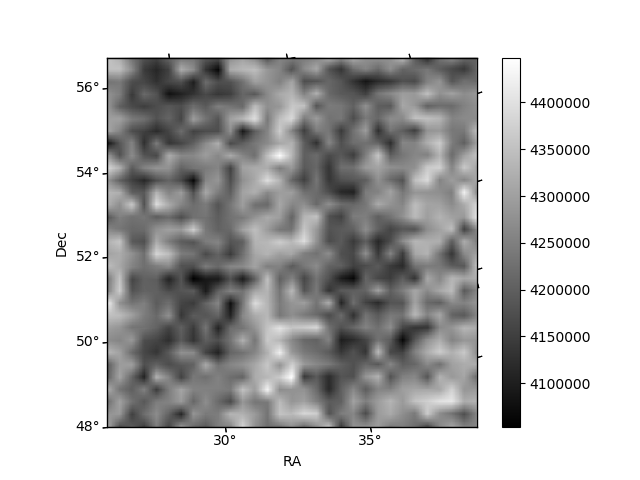
Histogram calculated using DETX and DETY for each event in the final _common_clean file
| Quadrant A | 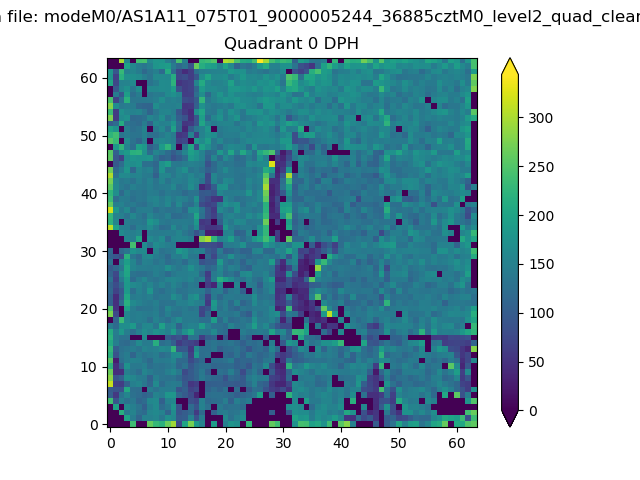 |
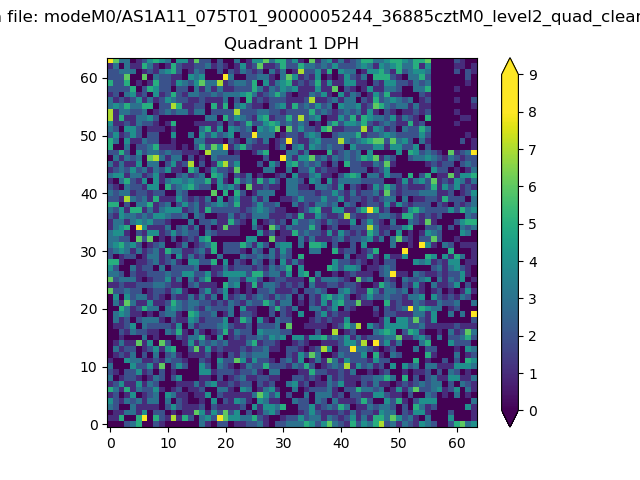 |
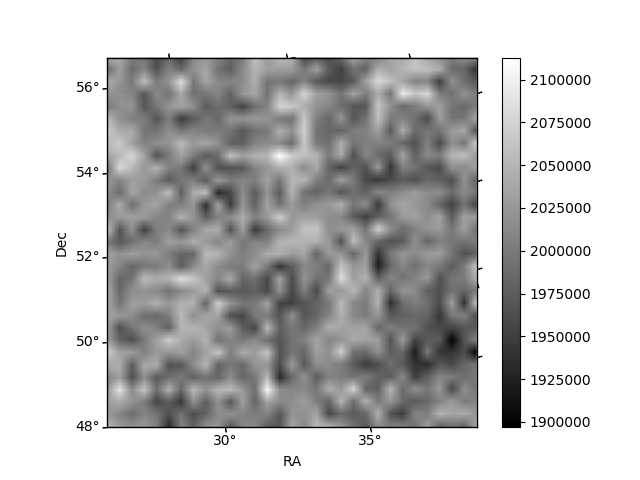
Quadrant B |
|---|---|---|---|
| Quadrant D | 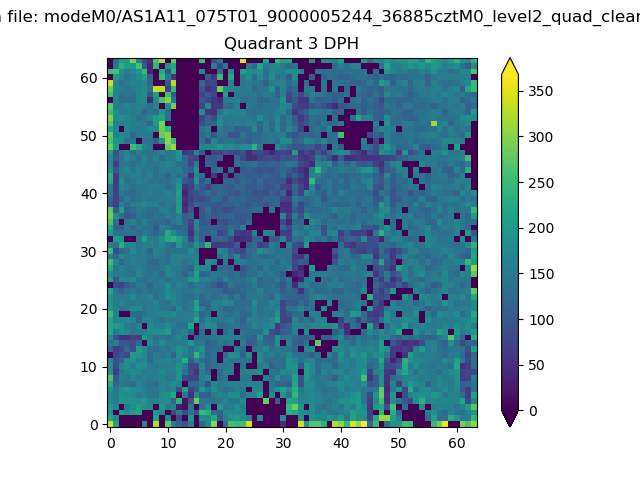 |
 |
Quadrant C |
| Plot type | Count rate plots | Images |
|---|---|---|
| Comparison with Poisson distribution Blue bars denote a histogram of data divided into 1 sec bins. Red curve is a Poisson curve with rate = median count rate of data. |
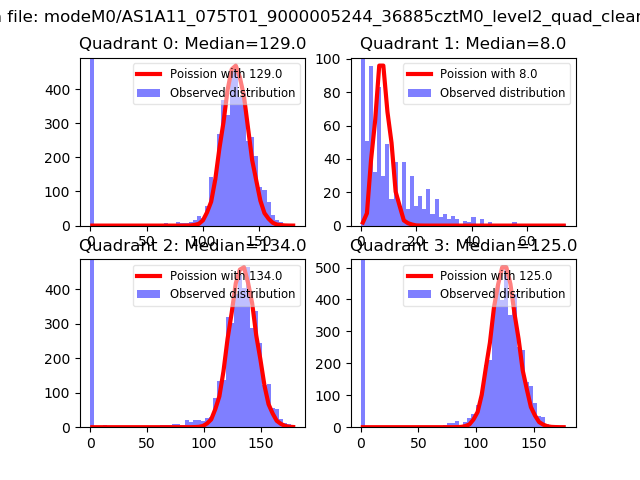 |
 |
| Quadrant-wise count rates Data is divided into 100 sec bins |
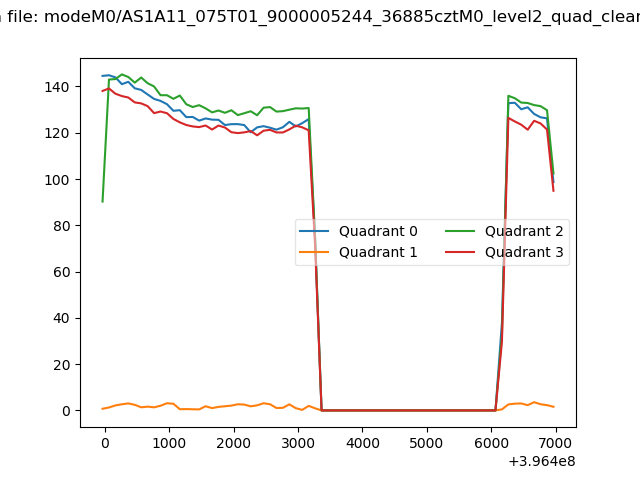 |
|
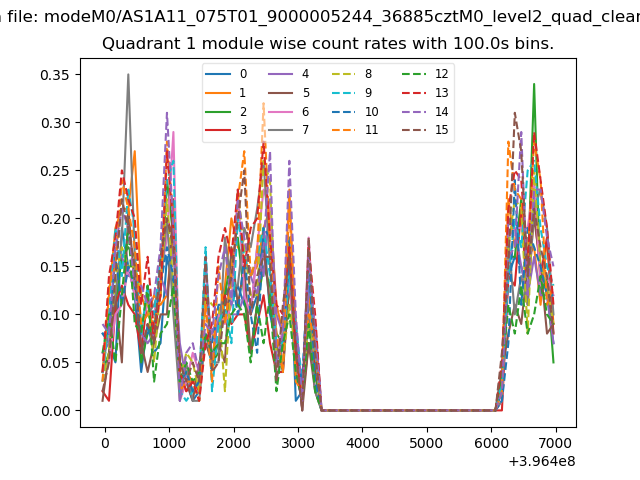
| Module-wise count rates for Quadrant A Data is divided into 100 sec bins |
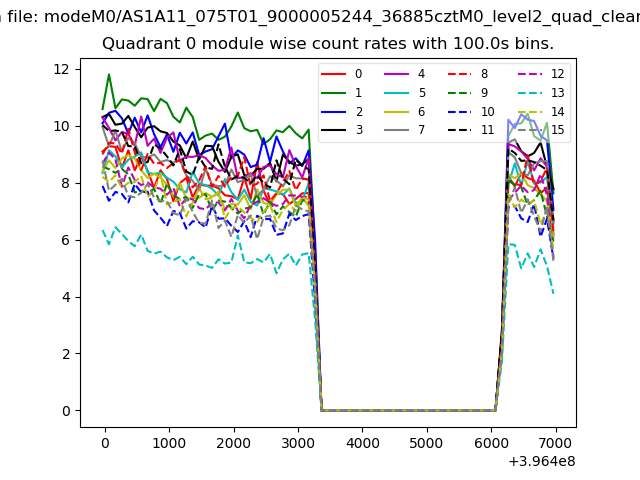 |
 |
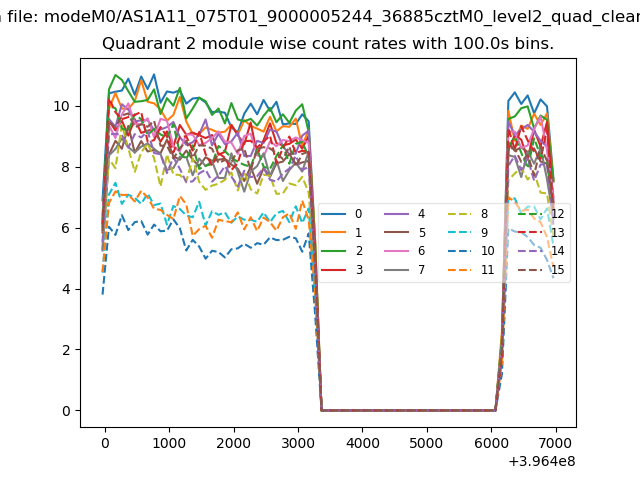
| Module-wise count rates for Quadrant B Data is divided into 100 sec bins |
 |
 |
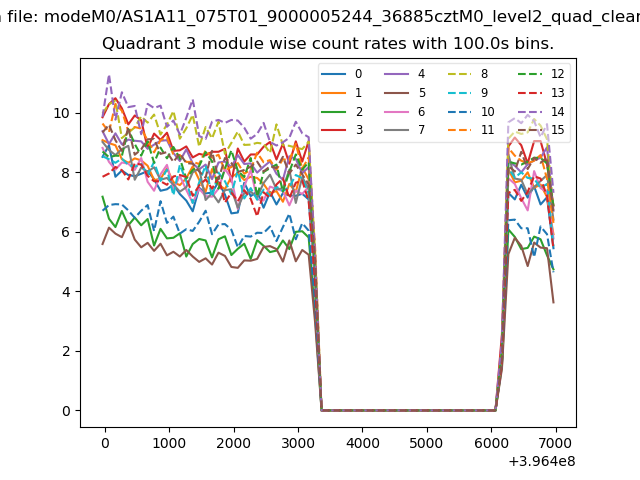
| Module-wise count rates for Quadrant C Data is divided into 100 sec bins |
 |
 |
| Module-wise count rates for Quadrant D Data is divided into 100 sec bins |
 |
 |
| Parameter | Plot |
|---|---|
| CZT HV Monitor | 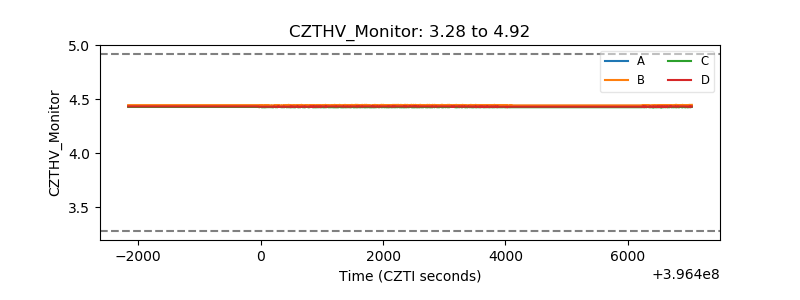 |
| D_VDD | 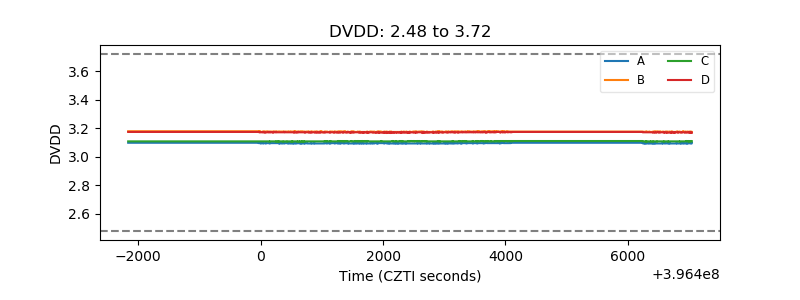 |
| Temperature 1 | 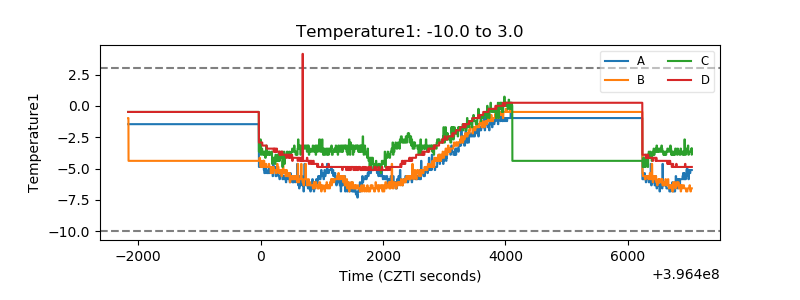 |
| Veto HV Monitor | 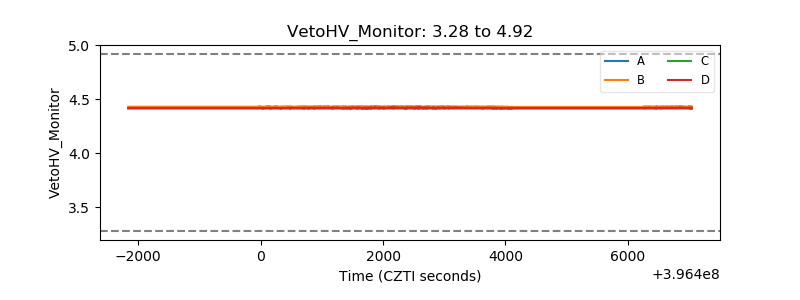 |
| Veto LLD | 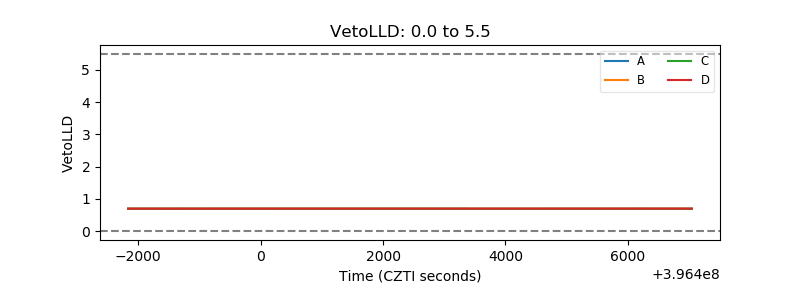 |
| Alpha Counter | 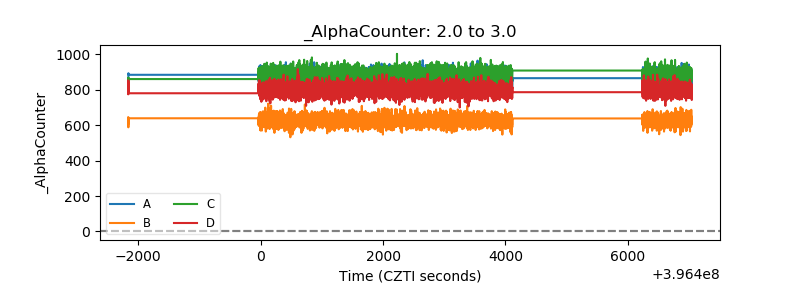 |
| _CPM_Rate | 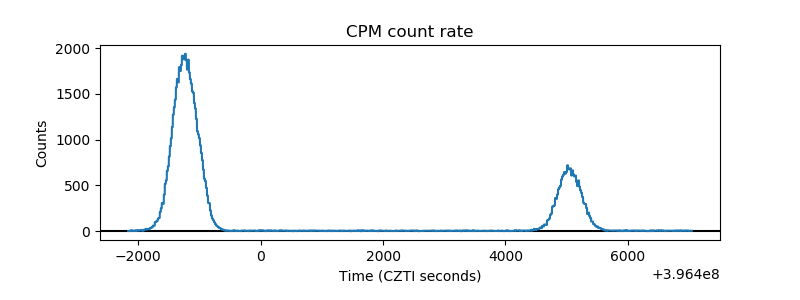 |
| CZT Counter | 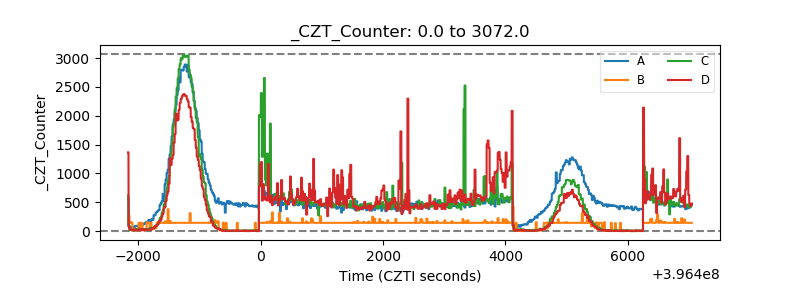 |
| +2.5 Volts monitor |  |
| +5 Volts monitor |  |
| _ROLL_ROT | 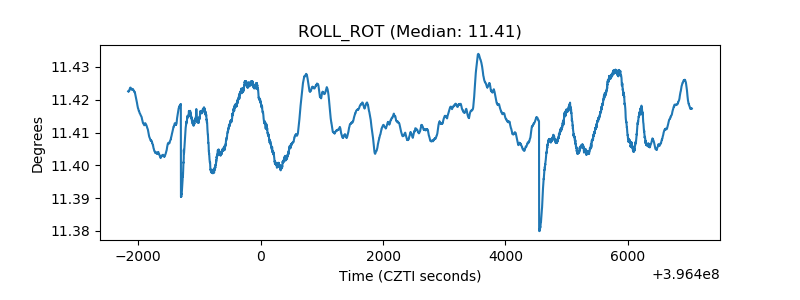 |
| _Roll_DEC | 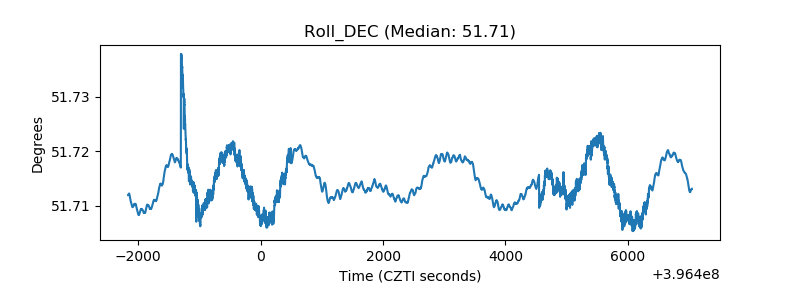 |
| _Roll_RA | 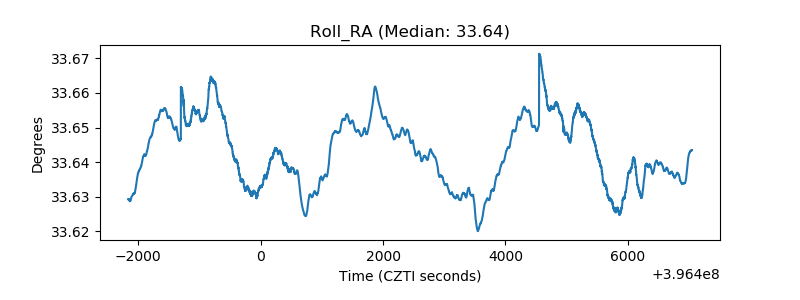 |
| Veto Counter | 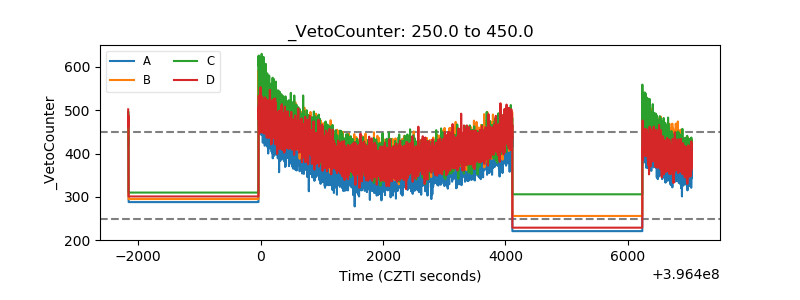 |