| Param | Original file | Final file |
|---|---|---|
| Filename | modeM0/AS1A11_075T01_9000005244_36887cztM0_level2.evt | modeM0/AS1A11_075T01_9000005244_36887cztM0_level2_quad_clean.evt |
| Size (bytes) | 364,014,720 | 54,855,360 |
| Size | 347.2 MB | 52.3 MB |
| Events in quadrant A | 2,821,802 | 419,640 |
| Events in quadrant B | 848,071 | 7,852 |
| Events in quadrant C | 3,052,099 | 428,661 |
| Events in quadrant D | 3,916,982 | 412,635 |
| Mode SS | |||
|---|---|---|---|
| Quadrant | BADHDUFLAG | Total packets | Discarded packets |
| A | 0 | 114 | 0 |
| B | 0 | 114 | 0 |
| C | 0 | 114 | 0 |
| D | 0 | 114 | 0 |
| Mode M0 | |||
|---|---|---|---|
| Quadrant | BADHDUFLAG | Total packets | Discarded packets |
| A | 0 | 12158 | 3 |
| B | 0 | 5649 | 2 |
| C | 0 | 12655 | 2 |
| D | 0 | 15697 | 2 |
| Mode M9 | |||
|---|---|---|---|
| Quadrant | BADHDUFLAG | Total packets | Discarded packets |
| A | 0 | 31 | 0 |
| B | 0 | 31 | 0 |
| C | 0 | 31 | 0 |
| D | 0 | 32 | 0 |
| Quadrant | Total seconds | Saturated seconds | Saturation percentage |
|---|---|---|---|
| A | 5575 | 48 | 0.860987% |
| B | 5575 | 5575 | 100.000000% |
| C | 5575 | 88 | 1.578475% |
| D | 5575 | 260 | 4.663677% |
Noise dominated data is calculated using 1-second bins in cleaned event files. If a bin has >2000 counts, and if more than 50% of those come from <1% of pixels, then it is considered to be noise-dominated and hence unusable.
| Quadrant | # 1 sec bins | Bins with >0 counts | Bins with >2000 counts | High rate bins dominated by noise | Noise dominated (total time) | Noise dominated (detector-on time) | Marked lightcurve |
|---|---|---|---|---|---|---|---|
| A | 7248 | 5576 | 35 | 35 | 0.48% | 0.63% | 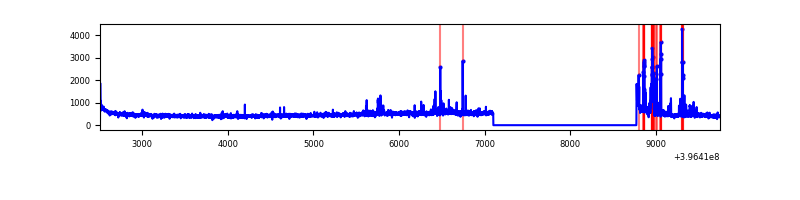 |
| B | 7247 | 5574 | 0 | 0 | 0.00% | 0.00% | 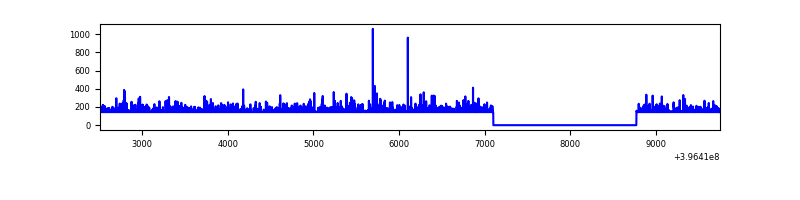 |
| C | 7248 | 5576 | 70 | 70 | 0.97% | 1.26% | 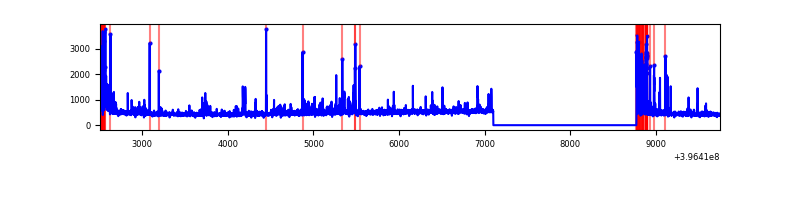 |
| D | 7248 | 5576 | 187 | 187 | 2.58% | 3.35% | 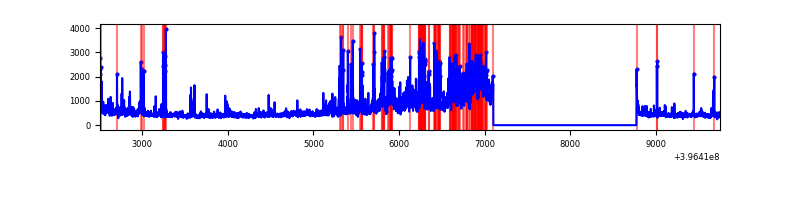 |
Top three noisy pixels from each quadrant. If the there are fewer than three noisy pixels in the level2.evt file, extra rows are filled as -1
| Pixel properties | Quadrant properties | ||||||
|---|---|---|---|---|---|---|---|
| Quadrant | DetID | PixID | Counts | Sigma | Mean | Median | Sigma |
| A | 10 | 83 | 236717 | 1930.56 | 602 | 590 | 122.3 |
| A | 9 | 143 | 182153 | 1484.45 | 602 | 590 | 122.3 |
| A | 13 | 248 | 20721 | 164.59 | 602 | 590 | 122.3 |
| B | 12 | 243 | 773870 | 177399.54 | 12 | 12 | 4.4 |
| B | 12 | 144 | 14218 | 3256.59 | 12 | 12 | 4.4 |
| B | 0 | 229 | 2323 | 529.77 | 12 | 12 | 4.4 |
| C | 0 | 10 | 372852 | 2754.18 | 585 | 589 | 135.2 |
| C | 15 | 214 | 240901 | 1777.94 | 585 | 589 | 135.2 |
| C | 0 | 207 | 135858 | 1000.78 | 585 | 589 | 135.2 |
| D | 12 | 235 | 959218 | 6758.83 | 578 | 562 | 141.8 |
| D | 12 | 233 | 231386 | 1627.38 | 578 | 562 | 141.8 |
| D | 13 | 249 | 147051 | 1032.79 | 578 | 562 | 141.8 |
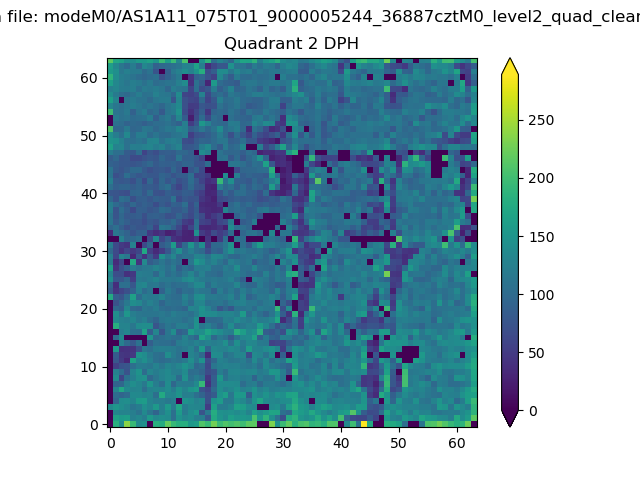
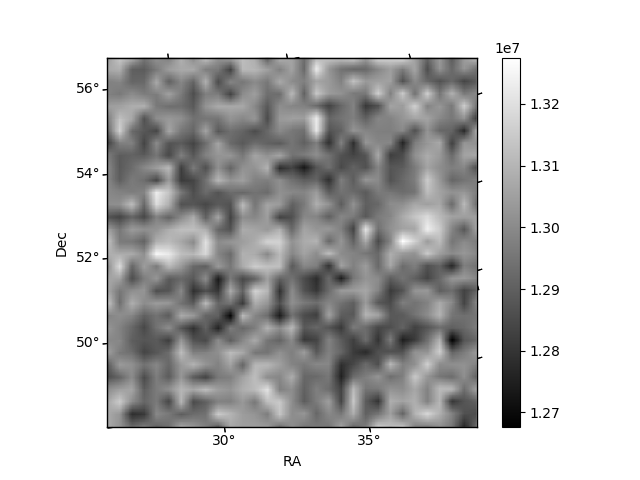
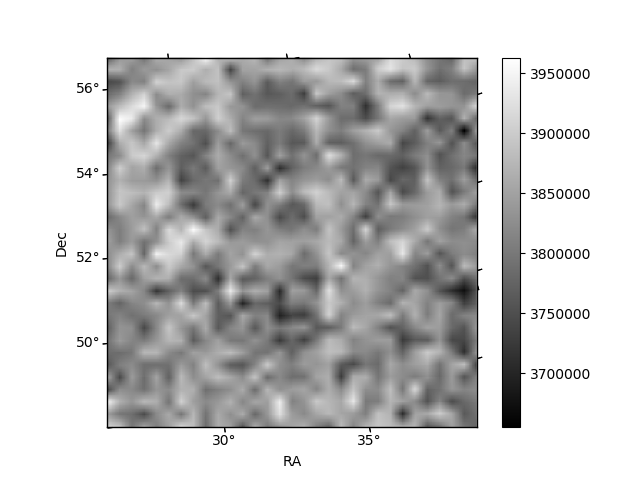
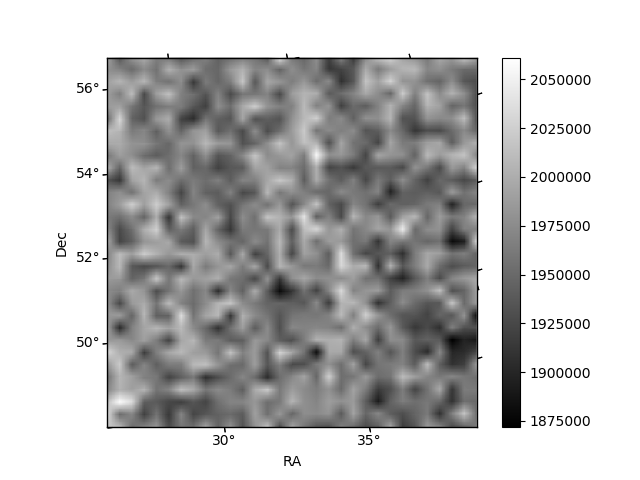
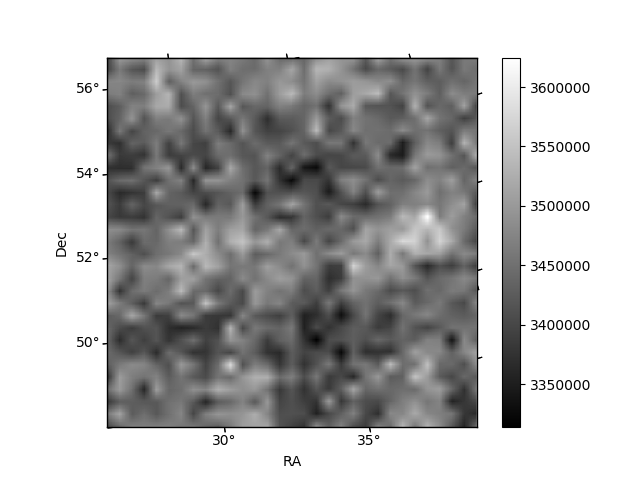
Histogram calculated using DETX and DETY for each event in the final _common_clean file
| Quadrant A | 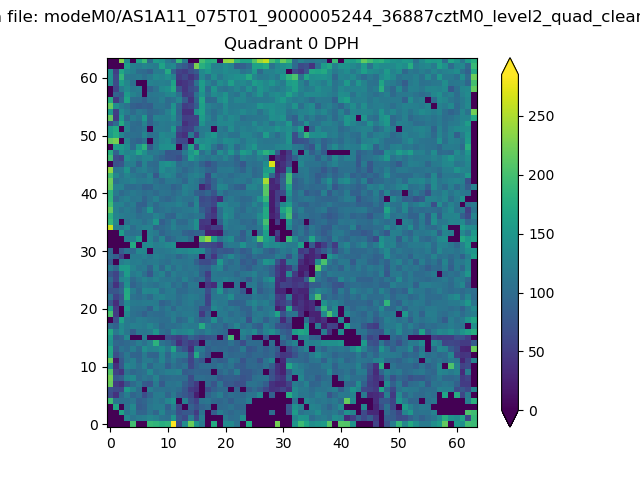 |
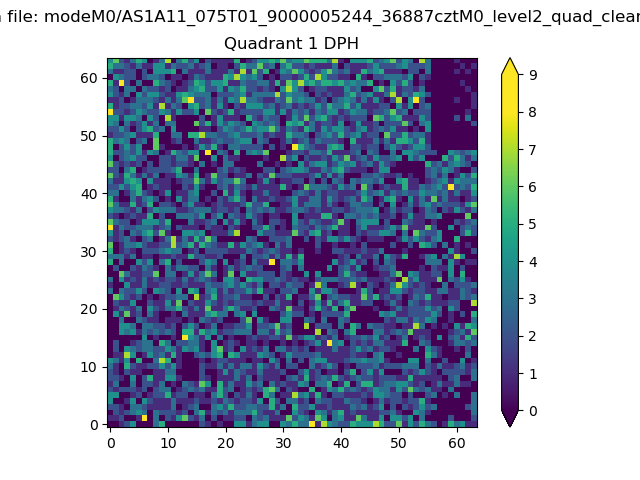 |
Quadrant B |
|---|---|---|---|
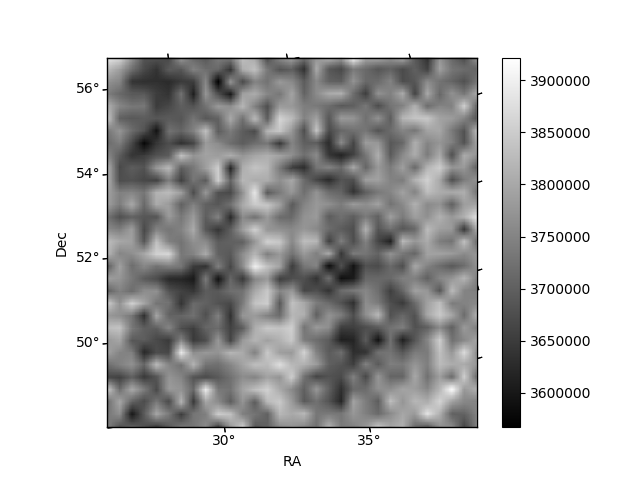
| Quadrant D | 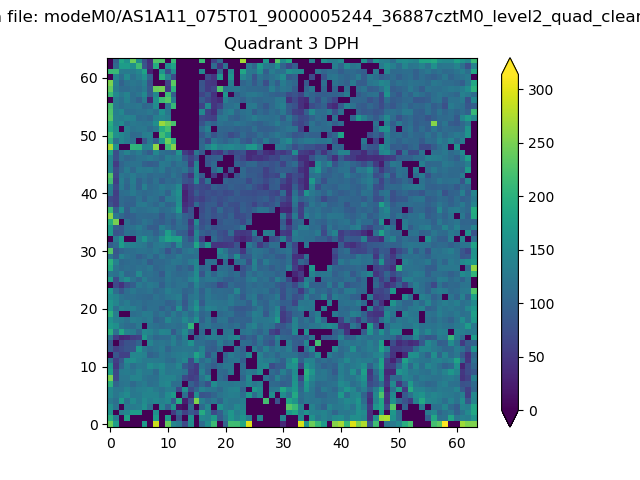 |
 |
Quadrant C |
| Plot type | Count rate plots | Images |
|---|---|---|
| Comparison with Poisson distribution Blue bars denote a histogram of data divided into 1 sec bins. Red curve is a Poisson curve with rate = median count rate of data. |
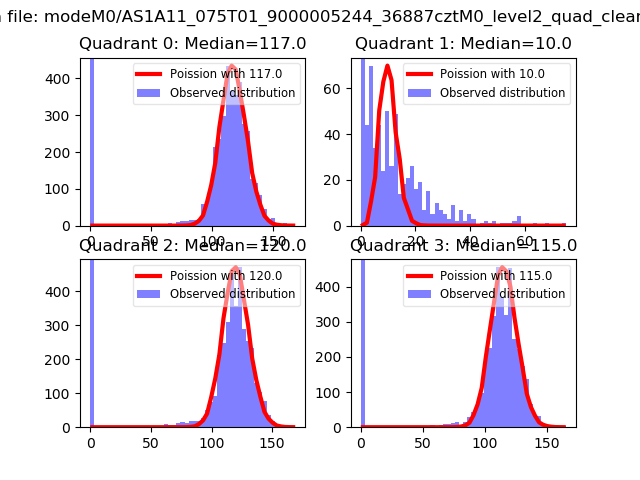 |
 |
| Quadrant-wise count rates Data is divided into 100 sec bins |
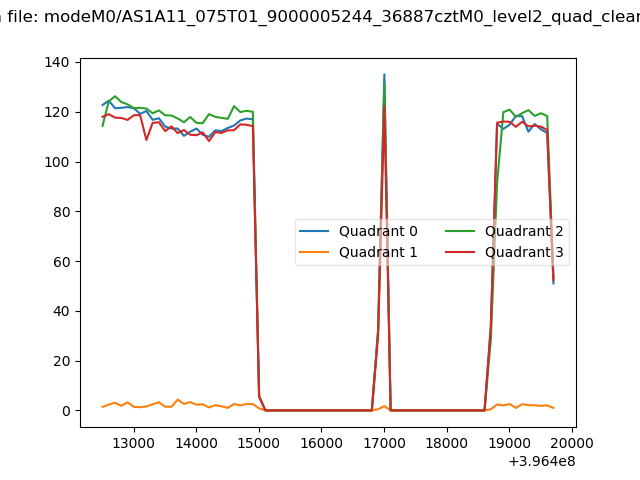 |
|
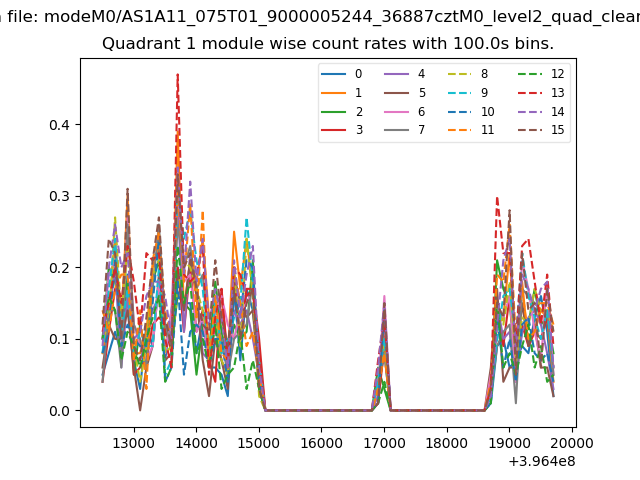
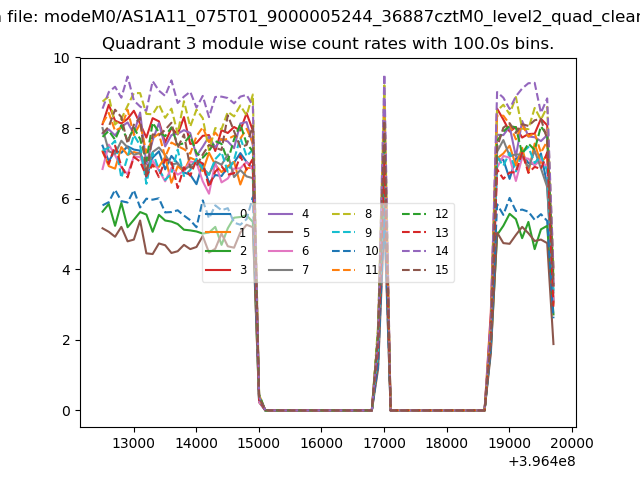
| Module-wise count rates for Quadrant A Data is divided into 100 sec bins |
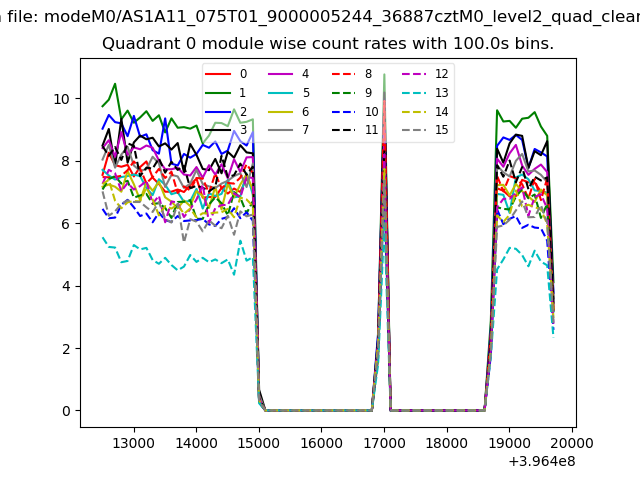 |
 |
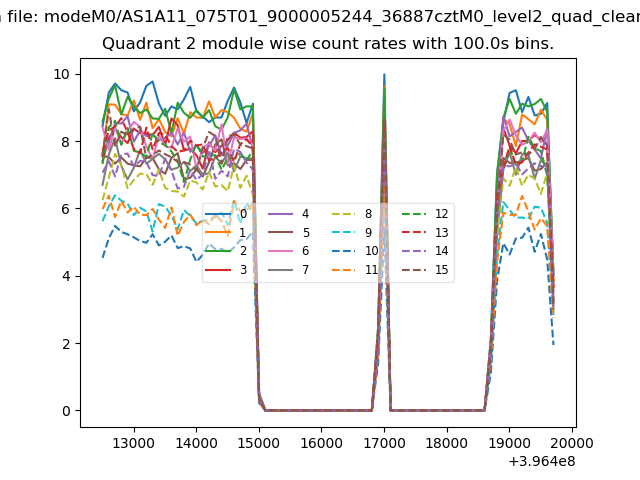
| Module-wise count rates for Quadrant B Data is divided into 100 sec bins |
 |
 |
| Module-wise count rates for Quadrant C Data is divided into 100 sec bins |
 |
 |
| Module-wise count rates for Quadrant D Data is divided into 100 sec bins |
 |
 |
| Parameter | Plot |
|---|---|
| CZT HV Monitor | 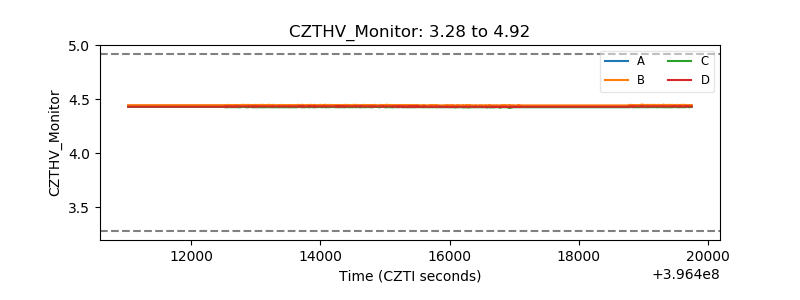 |
| D_VDD | 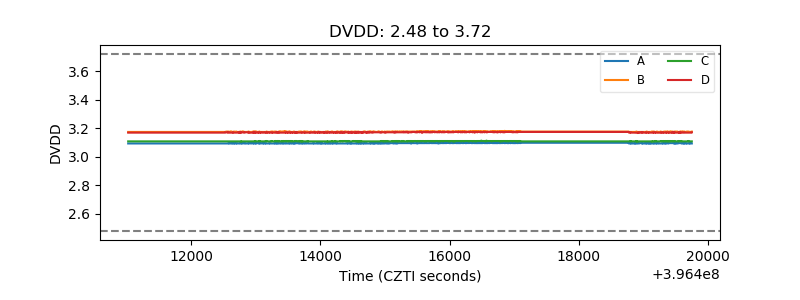 |
| Temperature 1 | 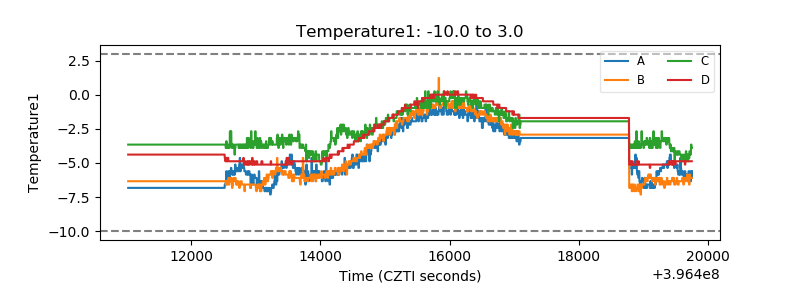 |
| Veto HV Monitor | 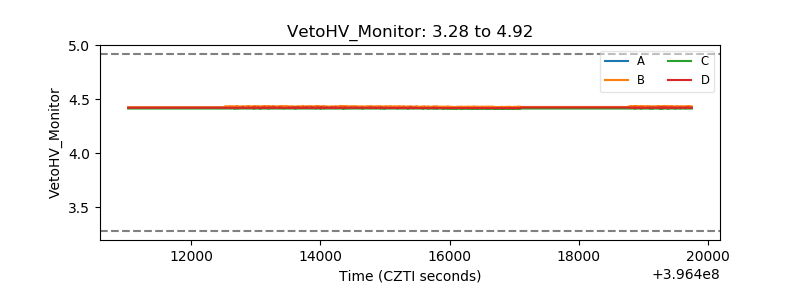 |
| Veto LLD | 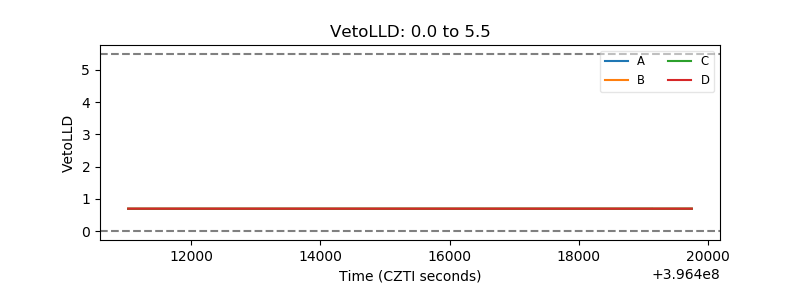 |
| Alpha Counter | 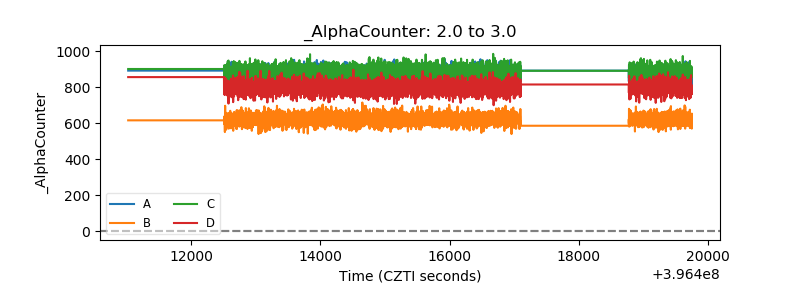 |
| _CPM_Rate | 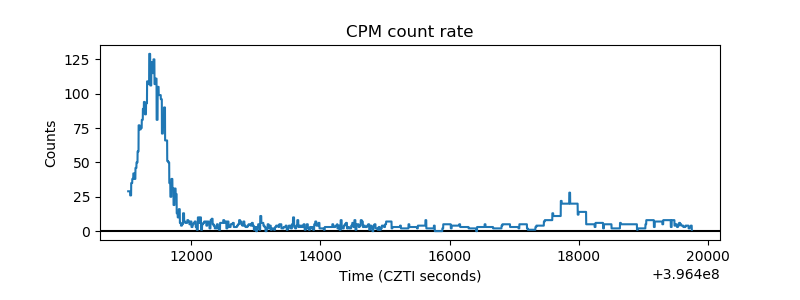 |
| CZT Counter | 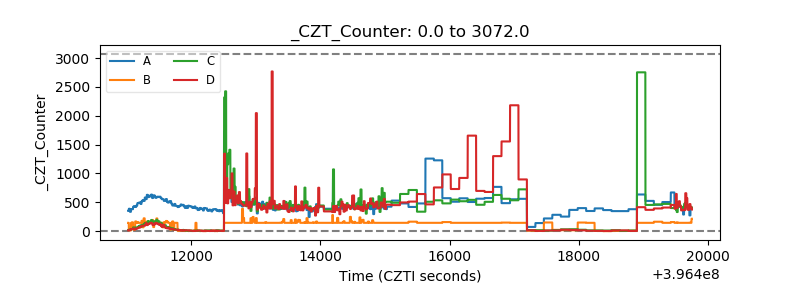 |
| +2.5 Volts monitor |  |
| +5 Volts monitor |  |
| _ROLL_ROT | 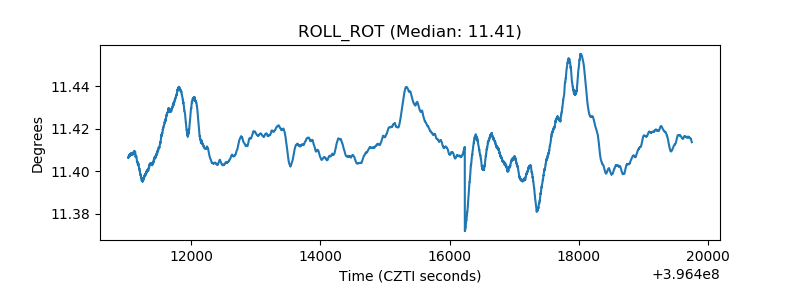 |
| _Roll_DEC | 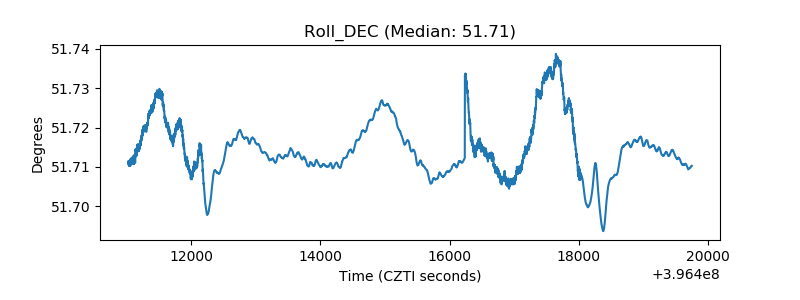 |
| _Roll_RA | 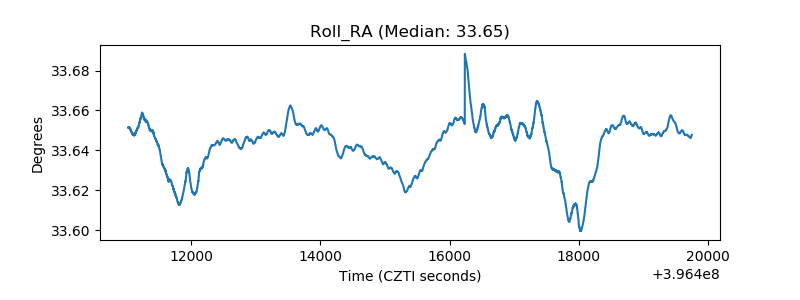 |
| Veto Counter | 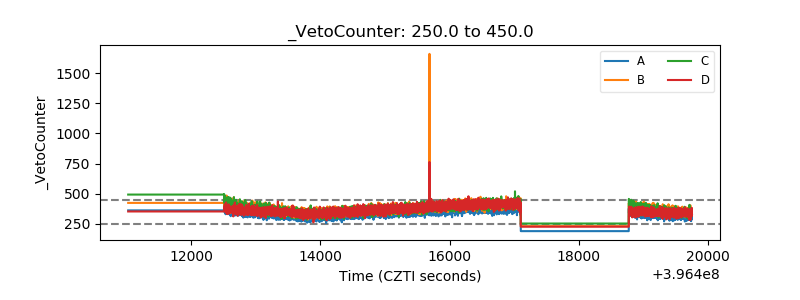 |