| Param | Original file | Final file |
|---|---|---|
| Filename | modeM0/AS1A11_075T01_9000005244_36892cztM0_level2.evt | modeM0/AS1A11_075T01_9000005244_36892cztM0_level2_quad_clean.evt |
| Size (bytes) | 869,232,960 | 107,640,000 |
| Size | 829.0 MB | 102.7 MB |
| Events in quadrant A | 6,045,557 | 801,768 |
| Events in quadrant B | 1,921,098 | 13,718 |
| Events in quadrant C | 6,081,020 | 811,030 |
| Events in quadrant D | 11,414,133 | 760,624 |
| Mode SS | |||
|---|---|---|---|
| Quadrant | BADHDUFLAG | Total packets | Discarded packets |
| A | 0 | 256 | 0 |
| B | 0 | 256 | 0 |
| C | 0 | 256 | 0 |
| D | 0 | 256 | 0 |
| Mode M0 | |||
|---|---|---|---|
| Quadrant | BADHDUFLAG | Total packets | Discarded packets |
| A | 0 | 25918 | 3 |
| B | 0 | 12775 | 3 |
| C | 0 | 25725 | 3 |
| D | 0 | 42615 | 3 |
| Mode M9 | |||
|---|---|---|---|
| Quadrant | BADHDUFLAG | Total packets | Discarded packets |
| A | 0 | 29 | 0 |
| B | 0 | 29 | 0 |
| C | 0 | 29 | 0 |
| D | 0 | 30 | 0 |
| Quadrant | Total seconds | Saturated seconds | Saturation percentage |
|---|---|---|---|
| A | 12567 | 27 | 0.214848% |
| B | 12567 | 12567 | 100.000000% |
| C | 12567 | 29 | 0.230763% |
| D | 12567 | 1078 | 8.578022% |
Noise dominated data is calculated using 1-second bins in cleaned event files. If a bin has >2000 counts, and if more than 50% of those come from <1% of pixels, then it is considered to be noise-dominated and hence unusable.
| Quadrant | # 1 sec bins | Bins with >0 counts | Bins with >2000 counts | High rate bins dominated by noise | Noise dominated (total time) | Noise dominated (detector-on time) | Marked lightcurve |
|---|---|---|---|---|---|---|---|
| A | 15313 | 12569 | 9 | 9 | 0.06% | 0.07% | 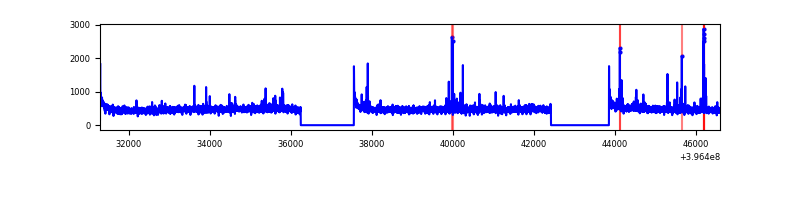 |
| B | 15312 | 12566 | 1 | 1 | 0.01% | 0.01% | 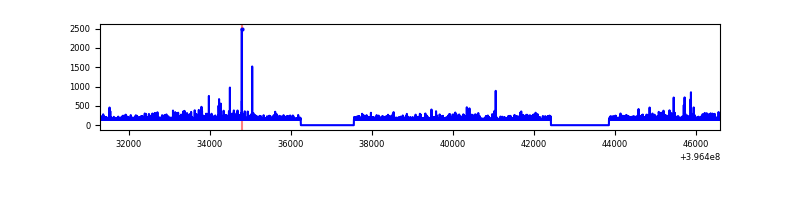 |
| C | 15313 | 12569 | 22 | 22 | 0.14% | 0.18% | 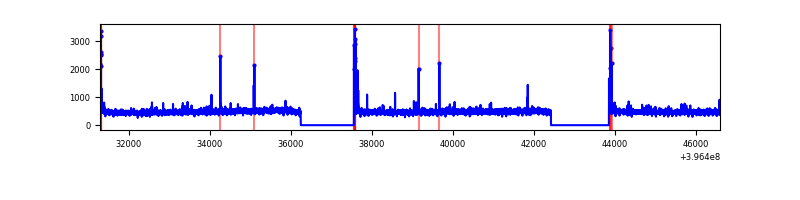 |
| D | 15313 | 12569 | 965 | 965 | 6.30% | 7.68% | 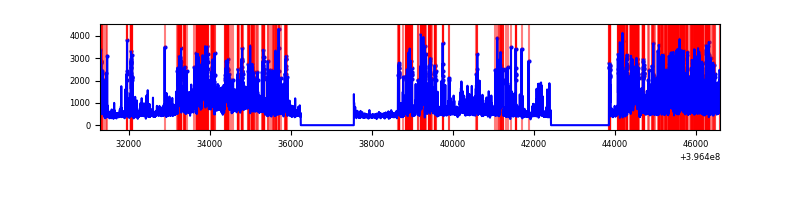 |
Top three noisy pixels from each quadrant. If the there are fewer than three noisy pixels in the level2.evt file, extra rows are filled as -1
| Pixel properties | Quadrant properties | ||||||
|---|---|---|---|---|---|---|---|
| Quadrant | DetID | PixID | Counts | Sigma | Mean | Median | Sigma |
| A | 10 | 83 | 473219 | 1668.81 | 1400 | 1371 | 282.7 |
| A | 9 | 143 | 63934 | 221.27 | 1400 | 1371 | 282.7 |
| A | 13 | 248 | 53157 | 183.15 | 1400 | 1371 | 282.7 |
| B | 12 | 243 | 1741186 | 226311.02 | 29 | 28 | 7.7 |
| B | 12 | 144 | 33363 | 4332.79 | 29 | 28 | 7.7 |
| B | 0 | 229 | 11333 | 1469.39 | 29 | 28 | 7.7 |
| C | 15 | 214 | 544390 | 1715.44 | 1363 | 1375 | 316.5 |
| C | 0 | 10 | 198348 | 622.26 | 1363 | 1375 | 316.5 |
| C | 13 | 61 | 9133 | 24.51 | 1363 | 1375 | 316.5 |
| D | 12 | 235 | 3680879 | 11346.24 | 1325 | 1288 | 324.3 |
| D | 13 | 249 | 897982 | 2765.01 | 1325 | 1288 | 324.3 |
| D | 10 | 253 | 597805 | 1839.39 | 1325 | 1288 | 324.3 |
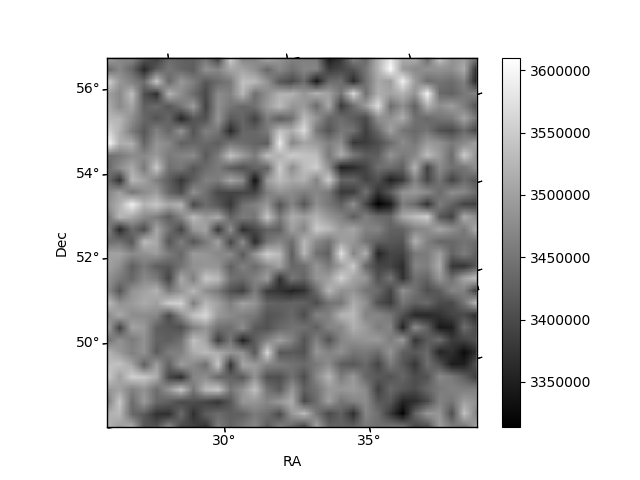
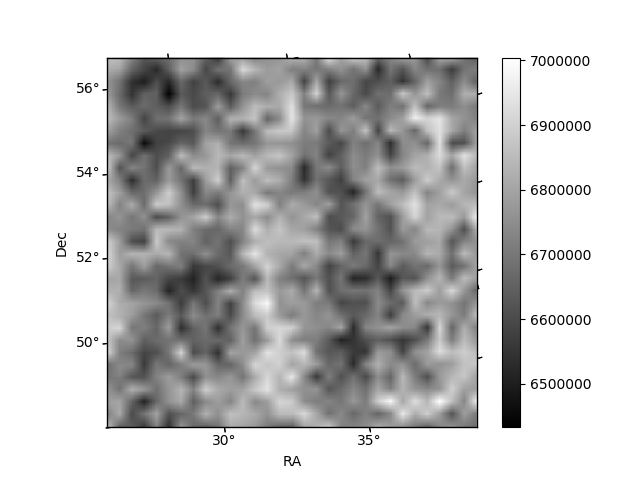
Histogram calculated using DETX and DETY for each event in the final _common_clean file
| Quadrant A | 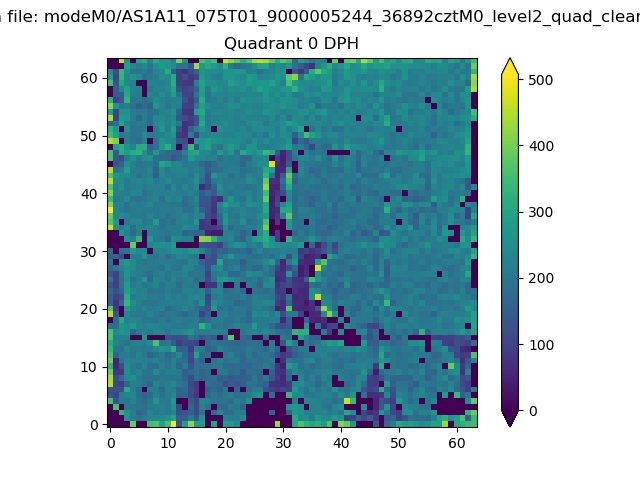 |
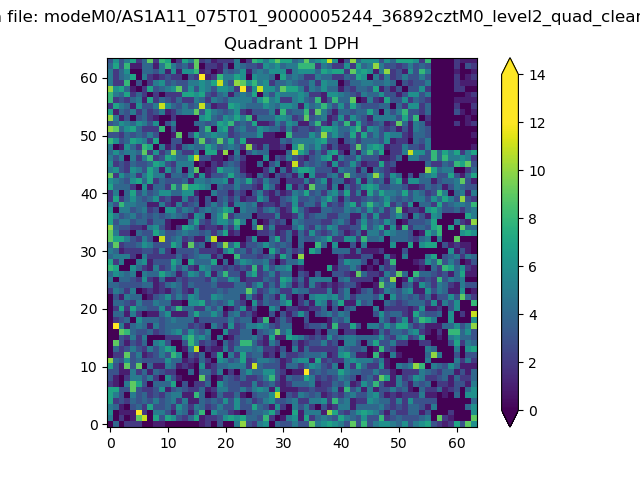 |
Quadrant B |
|---|---|---|---|
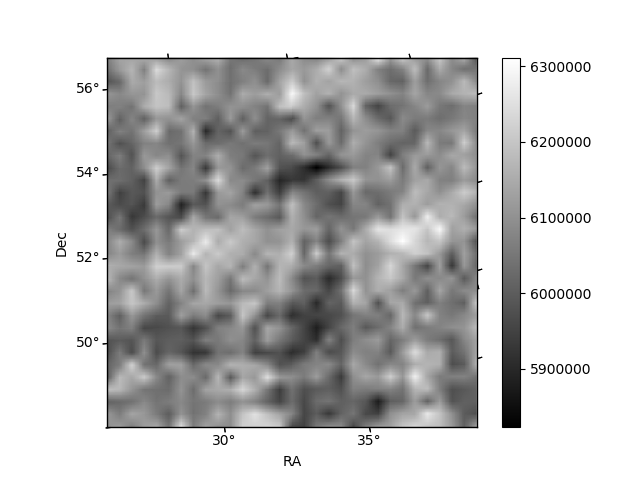
| Quadrant D | 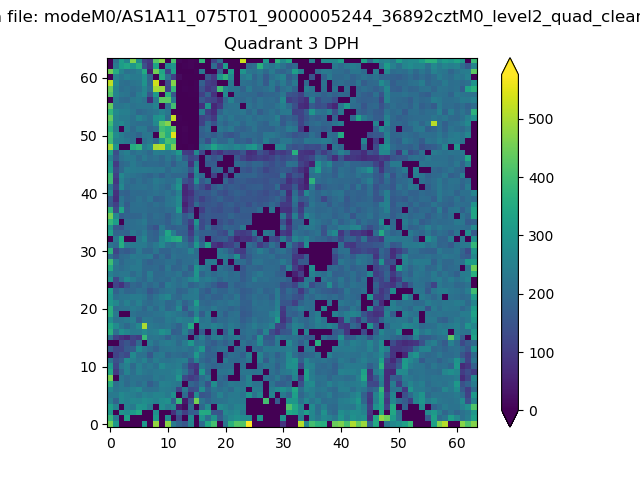 |
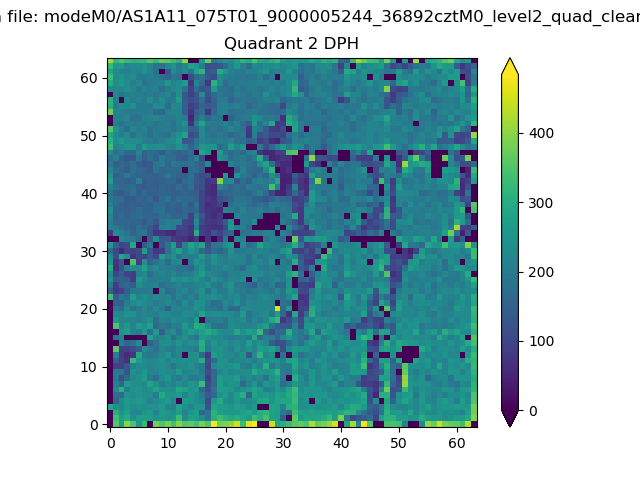 |
Quadrant C |
| Plot type | Count rate plots | Images |
|---|---|---|
| Comparison with Poisson distribution Blue bars denote a histogram of data divided into 1 sec bins. Red curve is a Poisson curve with rate = median count rate of data. |
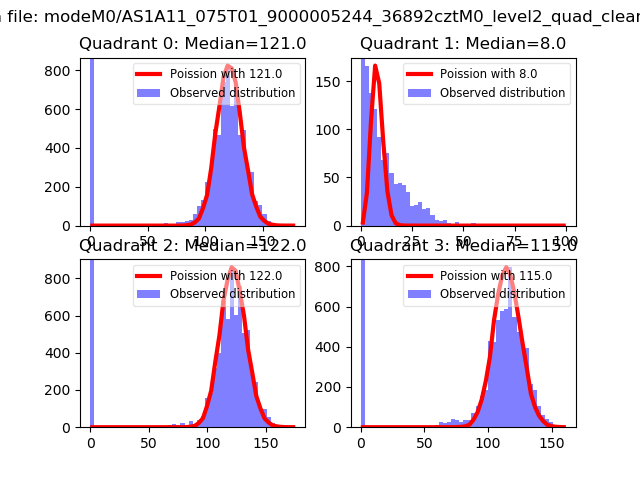 |
 |
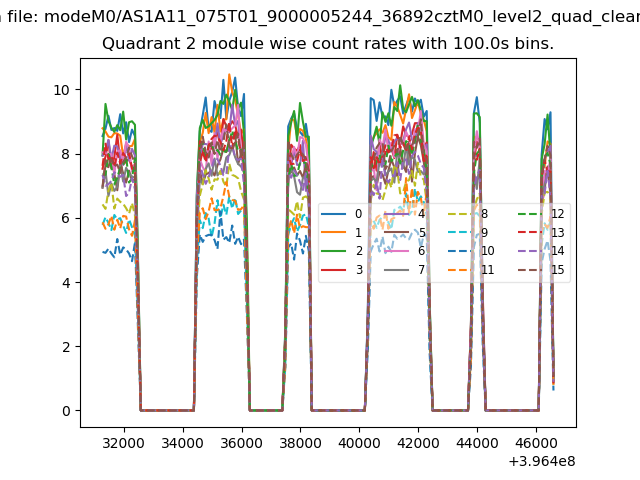
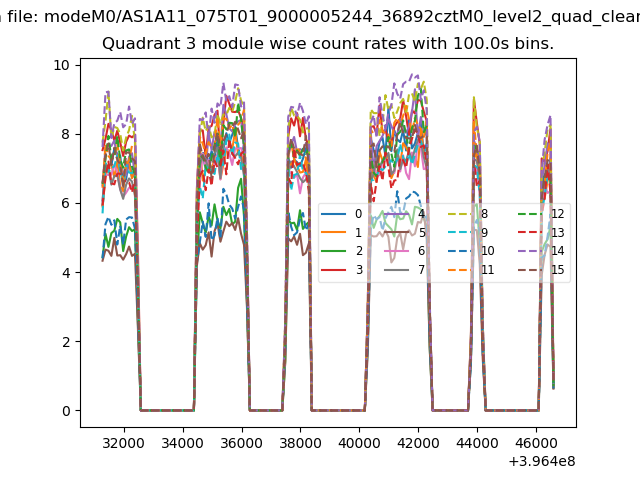
| Quadrant-wise count rates Data is divided into 100 sec bins |
 |
|
| Module-wise count rates for Quadrant A Data is divided into 100 sec bins |
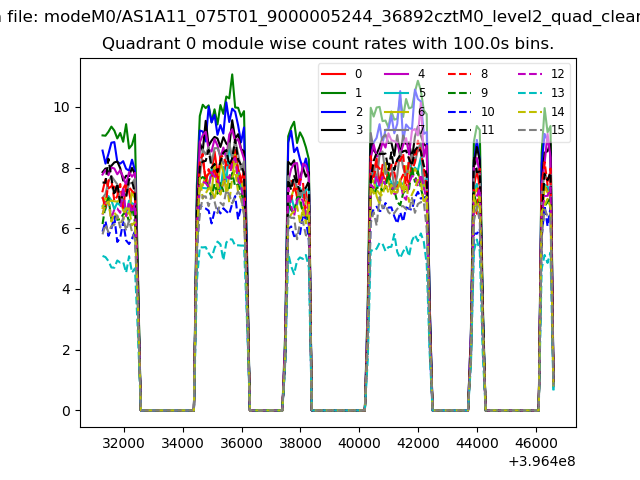 |
 |
| Module-wise count rates for Quadrant B Data is divided into 100 sec bins |
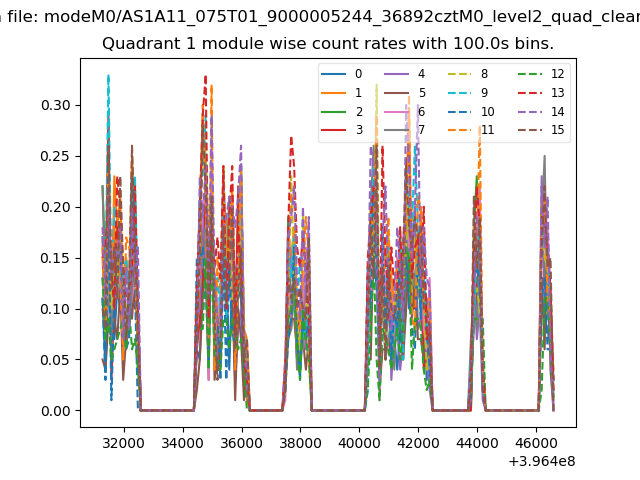 |
 |
| Module-wise count rates for Quadrant C Data is divided into 100 sec bins |
 |
 |
| Module-wise count rates for Quadrant D Data is divided into 100 sec bins |
 |
 |
| Parameter | Plot |
|---|---|
| CZT HV Monitor | 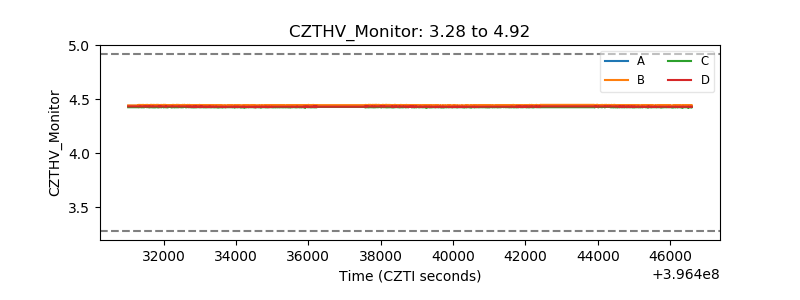 |
| D_VDD | 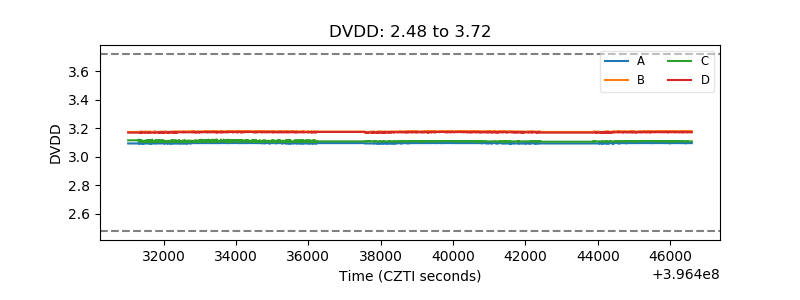 |
| Temperature 1 | 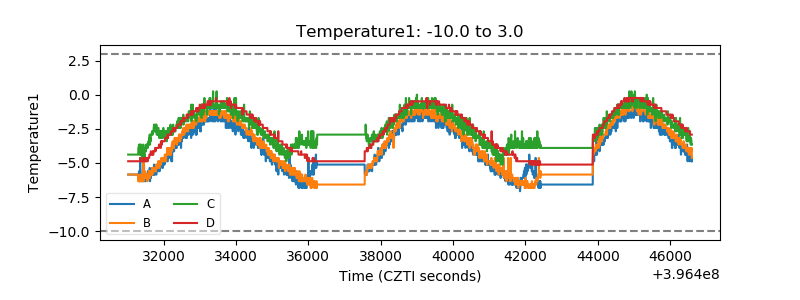 |
| Veto HV Monitor |  |
| Veto LLD | 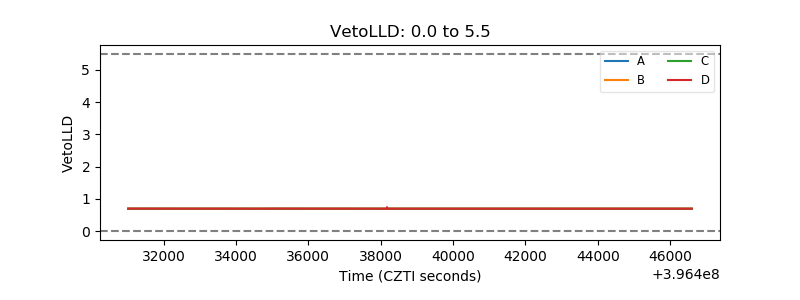 |
| Alpha Counter |  |
| _CPM_Rate | 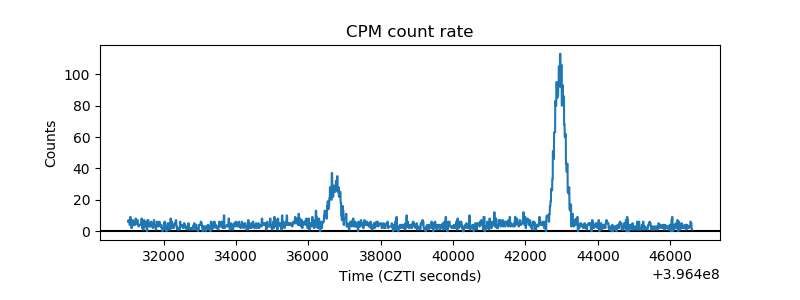 |
| CZT Counter | 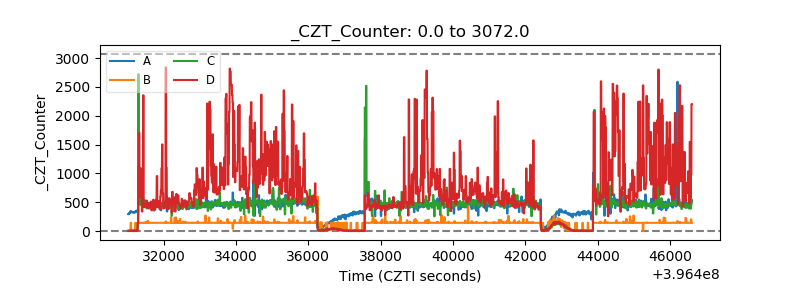 |
| +2.5 Volts monitor |  |
| +5 Volts monitor |  |
| _ROLL_ROT | 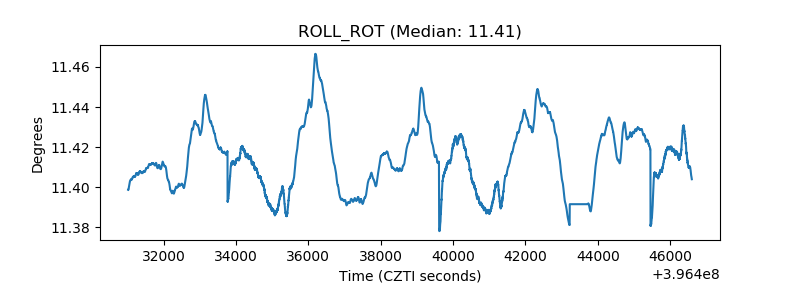 |
| _Roll_DEC | 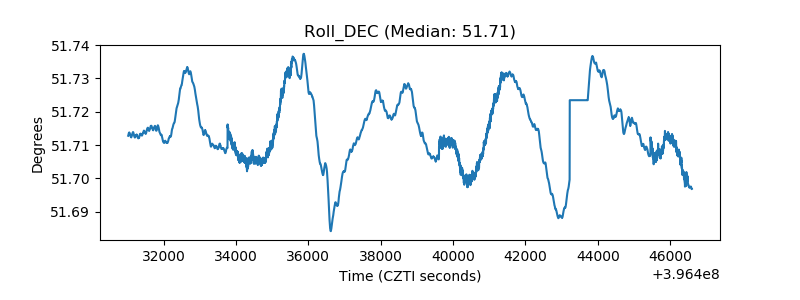 |
| _Roll_RA | 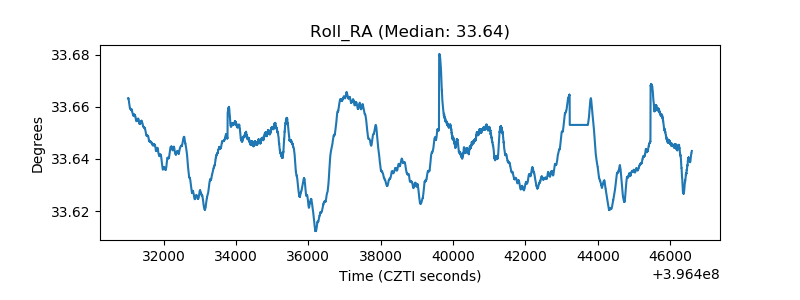 |
| Veto Counter | 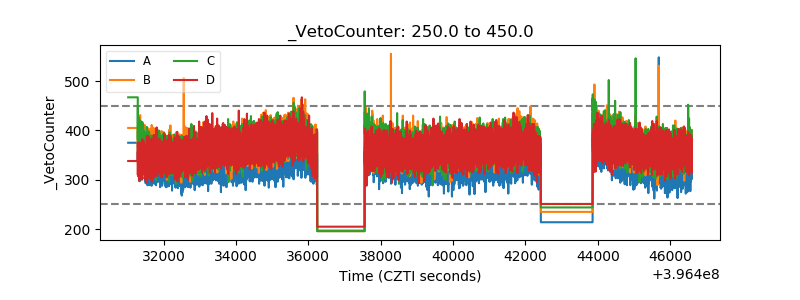 |