| Param | Original file | Final file |
|---|---|---|
| Filename | modeM0/AS1C07_010T01_9000005246cztM0_level2.fits | modeM0/AS1C07_010T01_9000005246cztM0_level2_quad_clean.evt |
| Size (bytes) | 1,135,082,880 | 1,095,929,280 |
| Size | 1.1 GB | 1.0 GB |
| Events in quadrant A | 7,565,256 | 7,867,983 |
| Events in quadrant B | 1,285,804 | 1,609,984 |
| Events in quadrant C | 10,391,393 | 8,233,465 |
| Events in quadrant D | 5,960,199 | 6,365,029 |
| Mode SS | |||
|---|---|---|---|
| Quadrant | BADHDUFLAG | Total packets | Discarded packets |
| A | 0 | 2660 | 0 |
| B | 0 | 2731 | 0 |
| C | 0 | 2728 | 0 |
| D | 0 | 2725 | 0 |
| Mode M9 | |||
|---|---|---|---|
| Quadrant | BADHDUFLAG | Total packets | Discarded packets |
| A | 0 | 527 | 0 |
| B | 0 | 542 | 0 |
| C | 0 | 527 | 0 |
| D | 0 | 542 | 0 |
| Mode M0 | |||
|---|---|---|---|
| Quadrant | BADHDUFLAG | Total packets | Discarded packets |
| A | 0 | 281403 | 0 |
| B | 0 | 161038 | 0 |
| C | 0 | 278364 | 0 |
| D | 0 | 339001 | 0 |
| Quadrant | Total seconds | Saturated seconds | Saturation percentage |
|---|---|---|---|
| A | 132907 | 600 | 0.451443% |
| B | 133714 | 113211 | 84.666527% |
| C | 132884 | 604 | 0.454532% |
| D | 132783 | 5357 | 4.034402% |
Noise dominated data is calculated using 1-second bins in cleaned event files. If a bin has >2000 counts, and if more than 50% of those come from <1% of pixels, then it is considered to be noise-dominated and hence unusable.
| Quadrant | # 1 sec bins | Bins with >0 counts | Bins with >2000 counts | High rate bins dominated by noise | Noise dominated (total time) | Noise dominated (detector-on time) | Marked lightcurve |
|---|---|---|---|---|---|---|---|
| A | 203199 | 135728 | 0 | 0 | 0.00% | 0.00% | 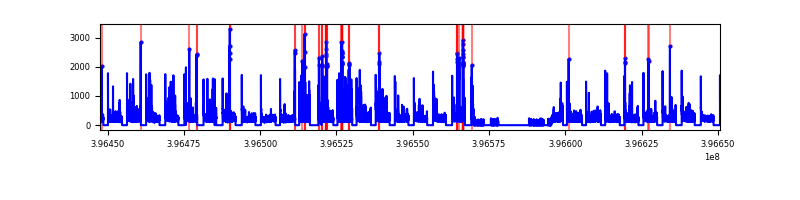 |
| B | 203174 | 34577 | 0 | 0 | 0.00% | 0.00% |  |
| C | 203199 | 135723 | 0 | 0 | 0.00% | 0.00% | 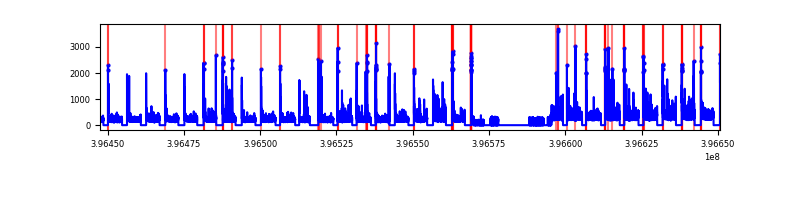 |
| D | 203199 | 135253 | 0 | 0 | 0.00% | 0.00% | 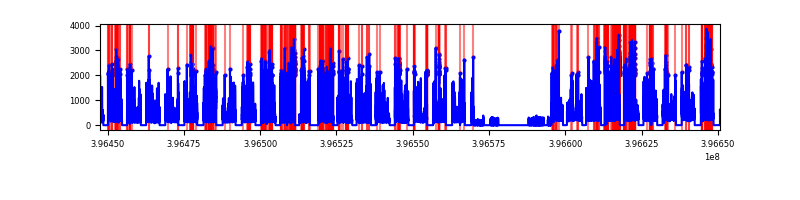 |
Top three noisy pixels from each quadrant. If the there are fewer than three noisy pixels in the level2.evt file, extra rows are filled as -1
| Pixel properties | Quadrant properties | ||||||
|---|---|---|---|---|---|---|---|
| Quadrant | DetID | PixID | Counts | Sigma | Mean | Median | Sigma |
| A | 0 | 29 | 6218 | 9.03 | 1977 | 1857 | 482.8 |
| A | 7 | 110 | 6127 | 8.84 | 1977 | 1857 | 482.8 |
| A | 9 | 19 | 6085 | 8.76 | 1977 | 1857 | 482.8 |
| B | 2 | 9 | 1106 | 11.03 | 341 | 326 | 70.7 |
| B | 3 | 80 | 959 | 8.95 | 341 | 326 | 70.7 |
| B | 3 | 17 | 908 | 8.23 | 341 | 326 | 70.7 |
| C | 3 | 203 | 7222 | 6.92 | 2765 | 2673 | 657.7 |
| C | 1 | 81 | 6864 | 6.37 | 2765 | 2673 | 657.7 |
| C | 3 | 202 | 6692 | 6.11 | 2765 | 2673 | 657.7 |
| D | 7 | 3 | 4300 | 6.27 | 1705 | 1567 | 435.6 |
| D | 4 | 160 | 4299 | 6.27 | 1705 | 1567 | 435.6 |
| D | 10 | 189 | 4276 | 6.22 | 1705 | 1567 | 435.6 |
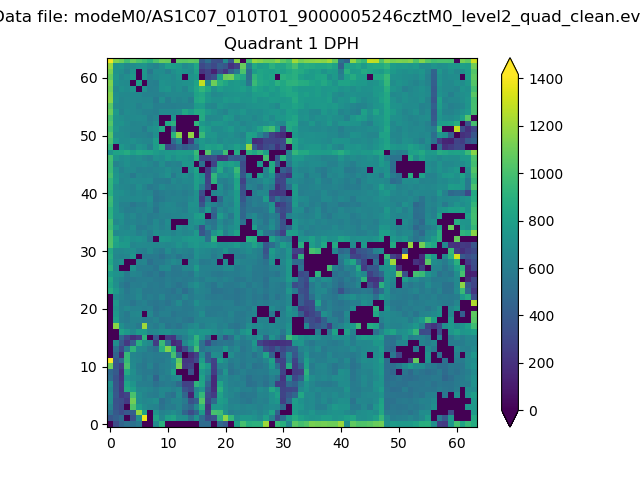
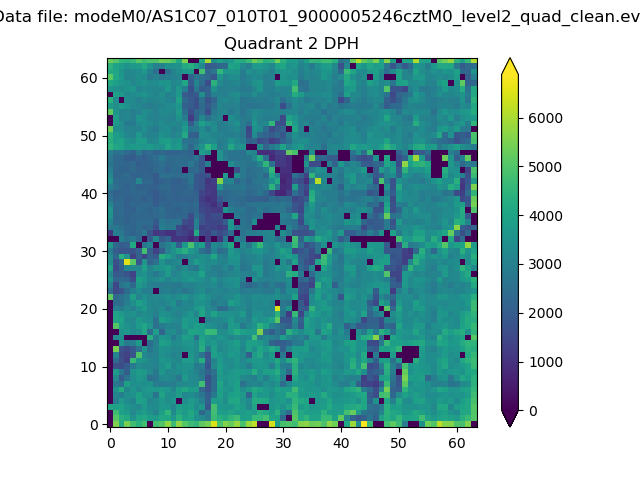
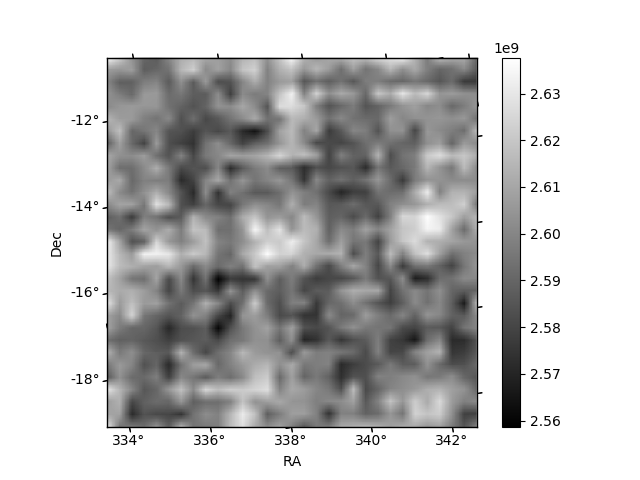
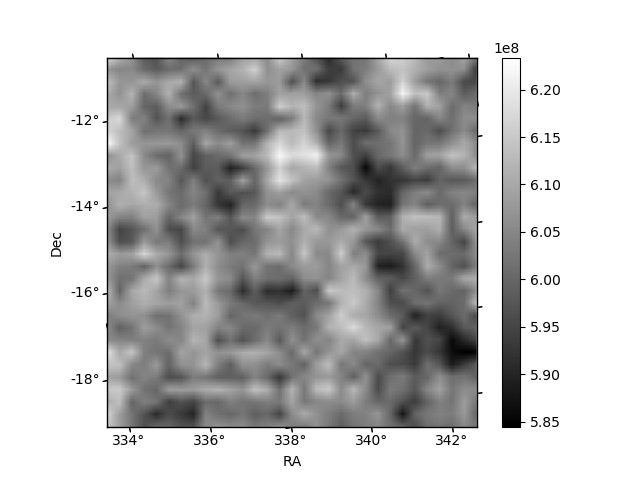
Histogram calculated using DETX and DETY for each event in the final _common_clean file
| Quadrant A | 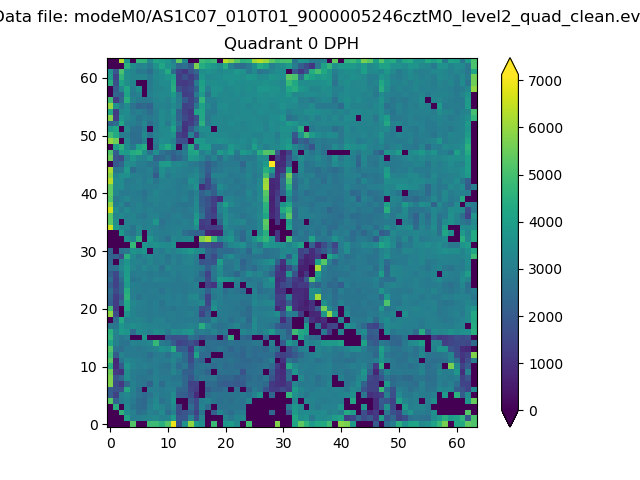 |
 |
Quadrant B |
|---|---|---|---|
| Quadrant D | 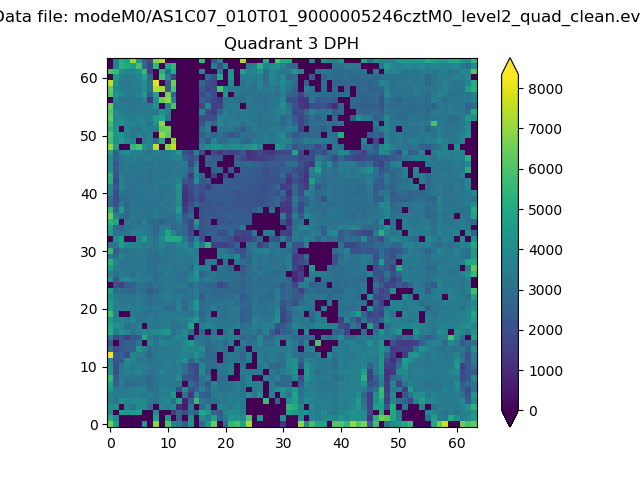 |
 |
Quadrant C |
| Plot type | Count rate plots | Images |
|---|---|---|
| Comparison with Poisson distribution Blue bars denote a histogram of data divided into 1 sec bins. Red curve is a Poisson curve with rate = median count rate of data. |
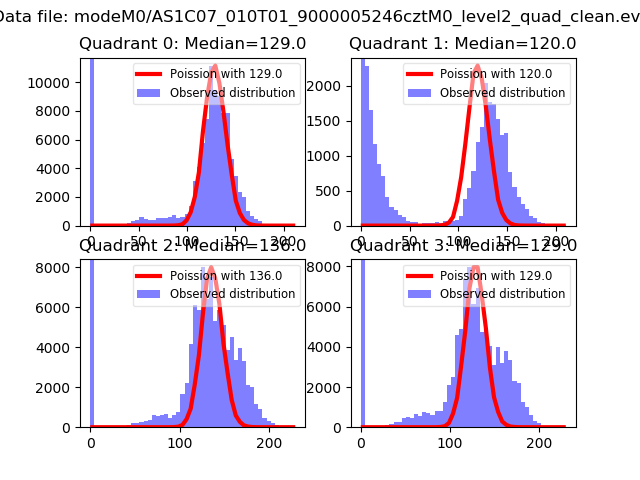 |
 |
| Quadrant-wise count rates Data is divided into 100 sec bins |
 |
|
| Module-wise count rates for Quadrant A Data is divided into 100 sec bins |
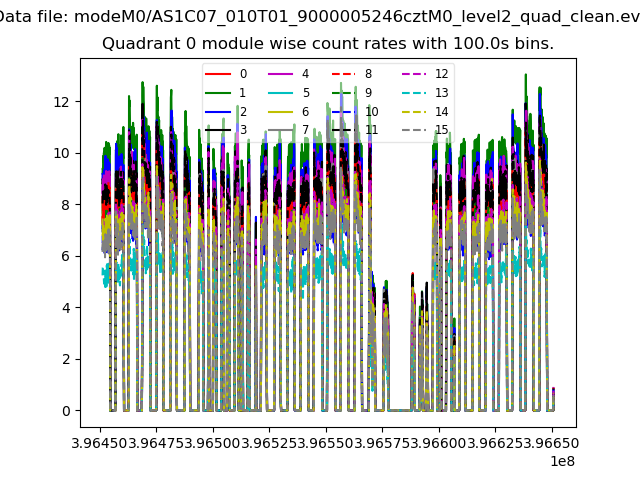 |
 |
| Module-wise count rates for Quadrant B Data is divided into 100 sec bins |
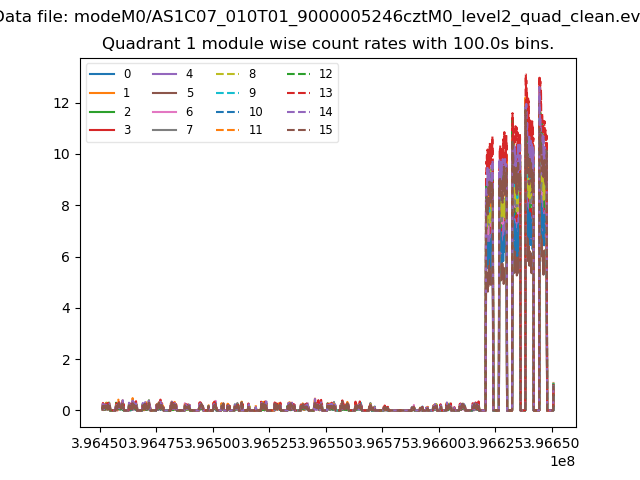 |
 |
| Module-wise count rates for Quadrant C Data is divided into 100 sec bins |
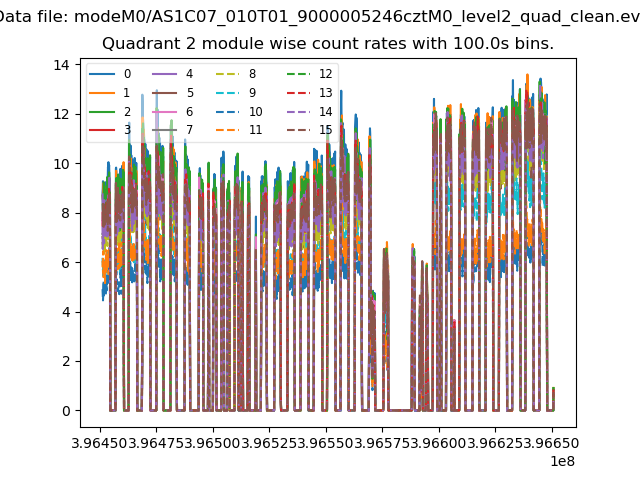 |
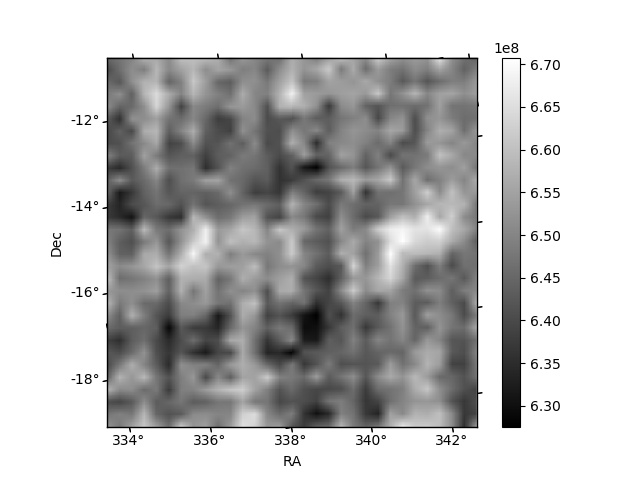 |
| Module-wise count rates for Quadrant D Data is divided into 100 sec bins |
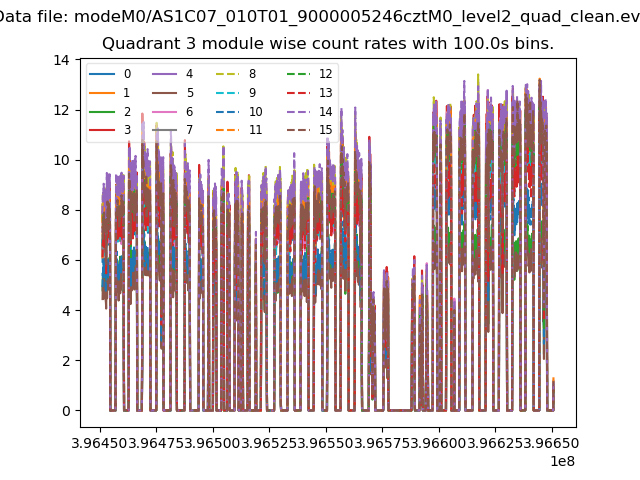 |
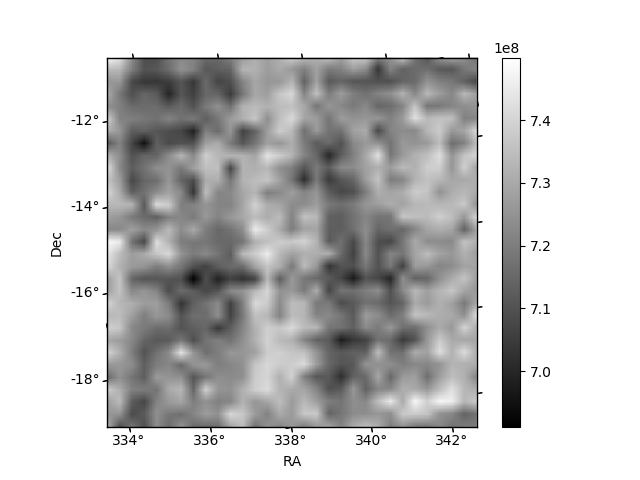 |
| Parameter | Plot |
|---|---|
| CZT HV Monitor |  |
| D_VDD | 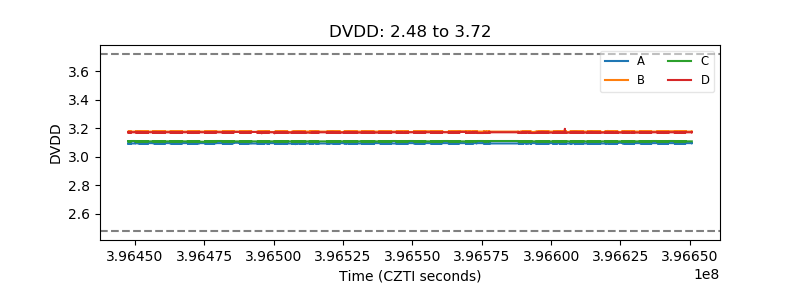 |
| Temperature 1 |  |
| Veto HV Monitor | 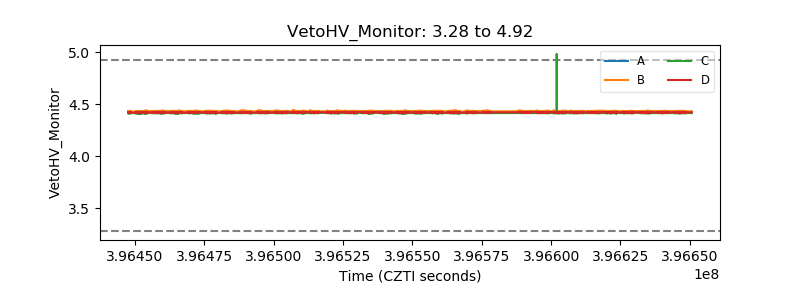 |
| Veto LLD | 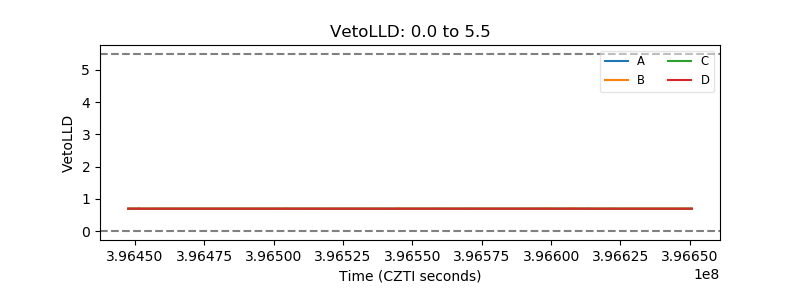 |
| Alpha Counter |  |
| _CPM_Rate |  |
| CZT Counter | 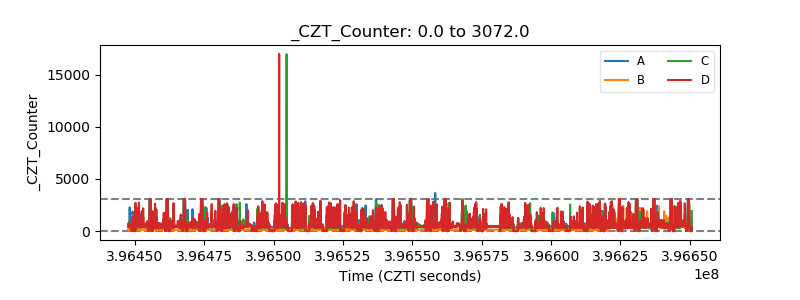 |
| +2.5 Volts monitor | 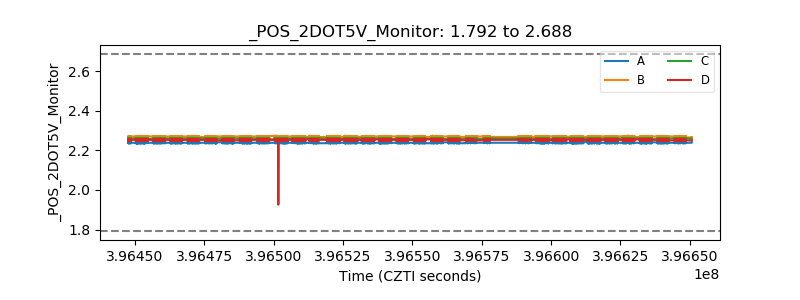 |
| +5 Volts monitor |  |
| _ROLL_ROT | 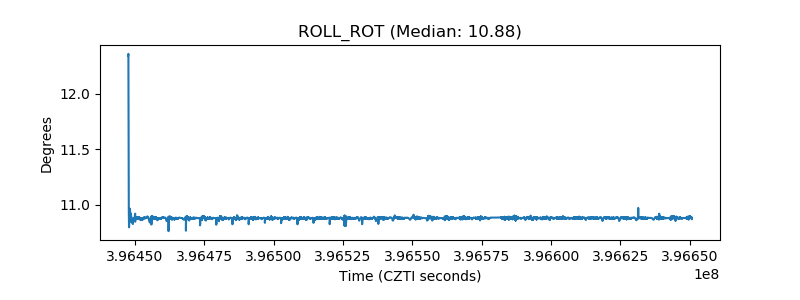 |
| _Roll_DEC |  |
| _Roll_RA |  |
| Veto Counter |  |