| Param | Original file | Final file |
|---|---|---|
| Filename | modeM0/AS1C07_010T01_9000005246_36892cztM0_level2.evt | modeM0/AS1C07_010T01_9000005246_36892cztM0_level2_quad_clean.evt |
| Size (bytes) | 134,680,320 | 16,251,840 |
| Size | 128.4 MB | 15.5 MB |
| Events in quadrant A | 1,090,618 | 115,788 |
| Events in quadrant B | 322,104 | 2,064 |
| Events in quadrant C | 1,077,366 | 112,729 |
| Events in quadrant D | 1,443,149 | 110,079 |
| Mode SS | |||
|---|---|---|---|
| Quadrant | BADHDUFLAG | Total packets | Discarded packets |
| A | 0 | 42 | 0 |
| B | 0 | 42 | 0 |
| C | 0 | 42 | 0 |
| D | 0 | 42 | 0 |
| Mode M9 | |||
|---|---|---|---|
| Quadrant | BADHDUFLAG | Total packets | Discarded packets |
| A | 0 | 16 | 0 |
| B | 0 | 16 | 0 |
| C | 0 | 16 | 0 |
| D | 0 | 16 | 0 |
| Mode M0 | |||
|---|---|---|---|
| Quadrant | BADHDUFLAG | Total packets | Discarded packets |
| A | 0 | 4495 | 2 |
| B | 0 | 2129 | 1 |
| C | 0 | 4374 | 1 |
| D | 0 | 5667 | 1 |
| Quadrant | Total seconds | Saturated seconds | Saturation percentage |
|---|---|---|---|
| A | 2078 | 12 | 0.577478% |
| B | 2078 | 2078 | 100.000000% |
| C | 2078 | 12 | 0.577478% |
| D | 2078 | 40 | 1.924928% |
Noise dominated data is calculated using 1-second bins in cleaned event files. If a bin has >2000 counts, and if more than 50% of those come from <1% of pixels, then it is considered to be noise-dominated and hence unusable.
| Quadrant | # 1 sec bins | Bins with >0 counts | Bins with >2000 counts | High rate bins dominated by noise | Noise dominated (total time) | Noise dominated (detector-on time) | Marked lightcurve |
|---|---|---|---|---|---|---|---|
| A | 3602 | 2079 | 4 | 4 | 0.11% | 0.19% | 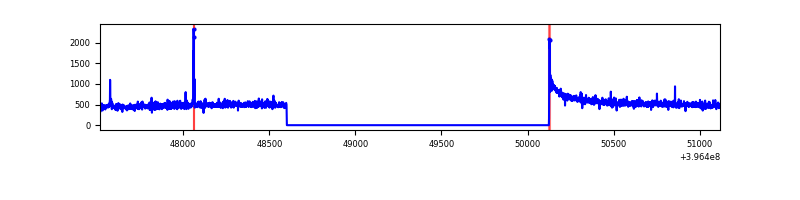 |
| B | 3601 | 2077 | 0 | 0 | 0.00% | 0.00% | 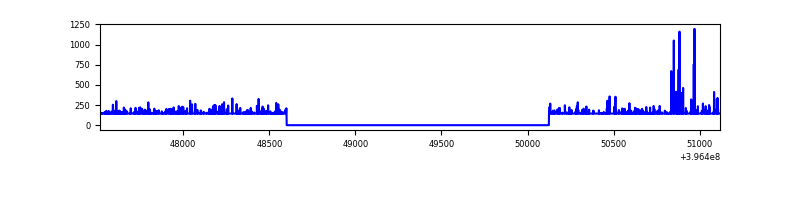 |
| C | 3602 | 2079 | 4 | 4 | 0.11% | 0.19% | 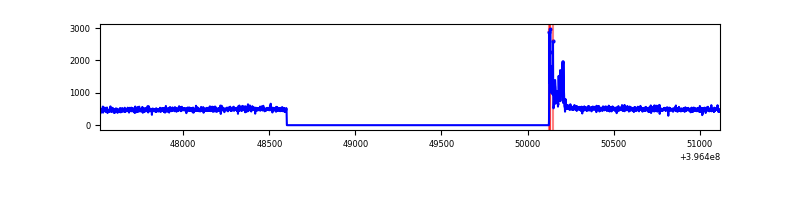 |
| D | 3602 | 2079 | 35 | 35 | 0.97% | 1.68% | 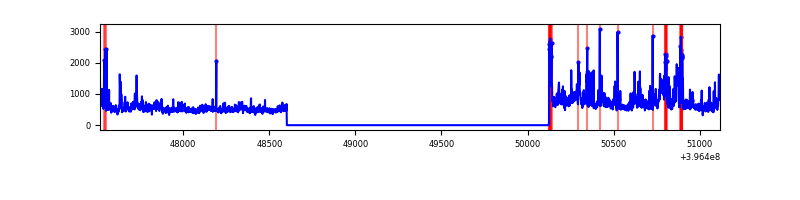 |
Top three noisy pixels from each quadrant. If the there are fewer than three noisy pixels in the level2.evt file, extra rows are filled as -1
| Pixel properties | Quadrant properties | ||||||
|---|---|---|---|---|---|---|---|
| Quadrant | DetID | PixID | Counts | Sigma | Mean | Median | Sigma |
| A | 10 | 83 | 108396 | 2085.39 | 247 | 242 | 51.9 |
| A | 9 | 143 | 14933 | 283.27 | 247 | 242 | 51.9 |
| A | 13 | 6 | 9511 | 178.72 | 247 | 242 | 51.9 |
| B | 12 | 243 | 287094 | 122059.03 | 5 | 5 | 2.4 |
| B | 0 | 229 | 8748 | 3717.18 | 5 | 5 | 2.4 |
| B | 12 | 144 | 5287 | 2245.7 | 5 | 5 | 2.4 |
| C | 15 | 214 | 91008 | 1614.09 | 236 | 237 | 56.2 |
| C | 0 | 10 | 64015 | 1134.1 | 236 | 237 | 56.2 |
| C | 13 | 61 | 1611 | 24.43 | 236 | 237 | 56.2 |
| D | 12 | 235 | 358777 | 6090.88 | 238 | 232 | 58.9 |
| D | 5 | 32 | 75782 | 1283.43 | 238 | 232 | 58.9 |
| D | 7 | 223 | 34392 | 580.3 | 238 | 232 | 58.9 |
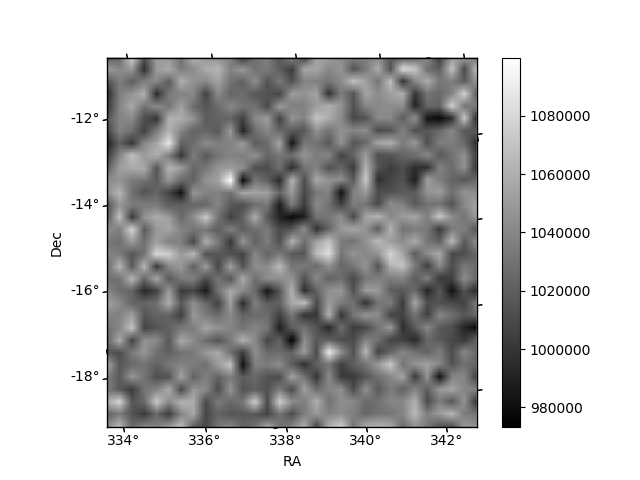
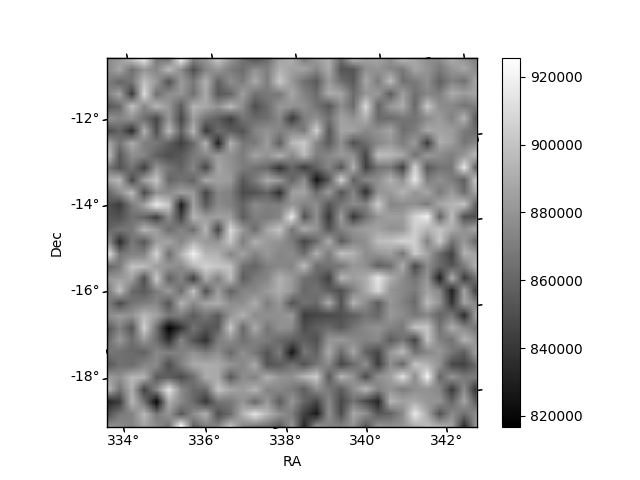
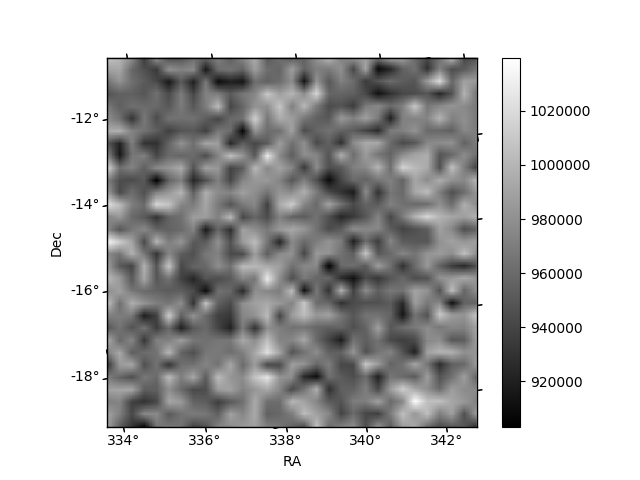
Histogram calculated using DETX and DETY for each event in the final _common_clean file
| Quadrant A |  |
 |
Quadrant B |
|---|---|---|---|
| Quadrant D | 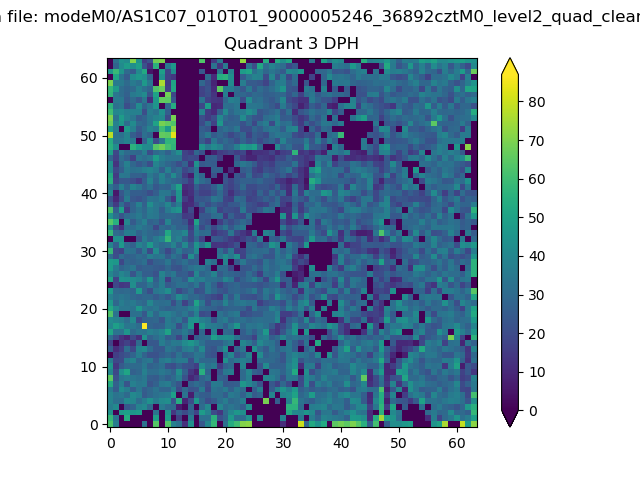 |
 |
Quadrant C |
| Plot type | Count rate plots | Images |
|---|---|---|
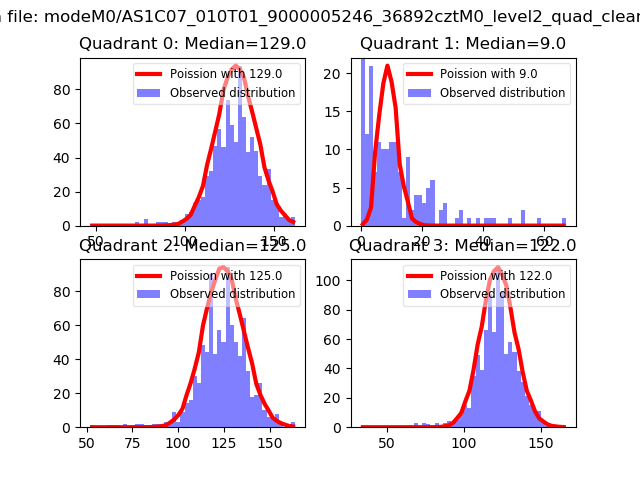
| Comparison with Poisson distribution Blue bars denote a histogram of data divided into 1 sec bins. Red curve is a Poisson curve with rate = median count rate of data. |
 |
 |
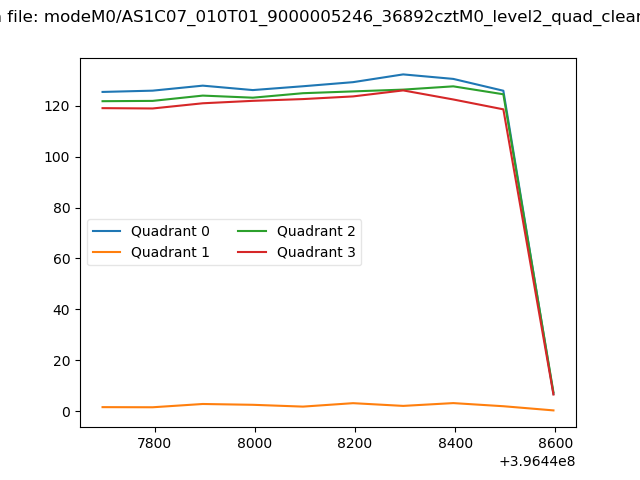
| Quadrant-wise count rates Data is divided into 100 sec bins |
 |
|
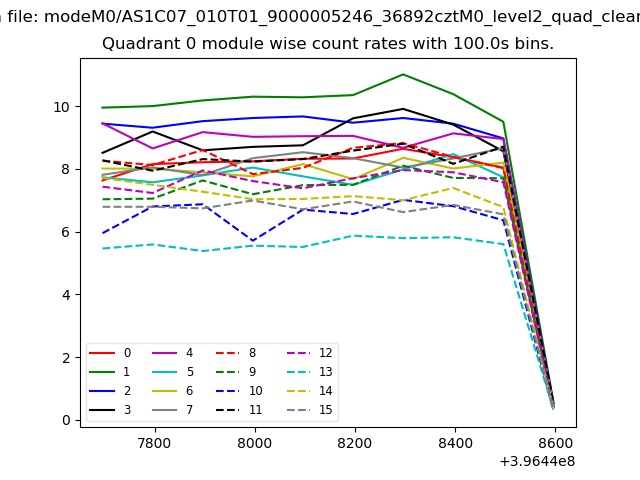
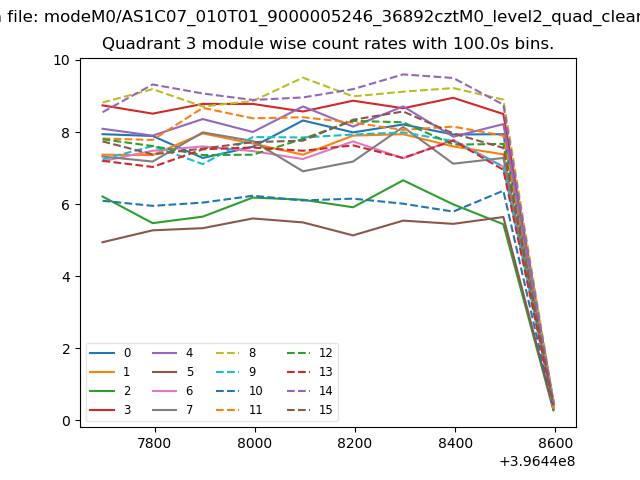
| Module-wise count rates for Quadrant A Data is divided into 100 sec bins |
 |
 |
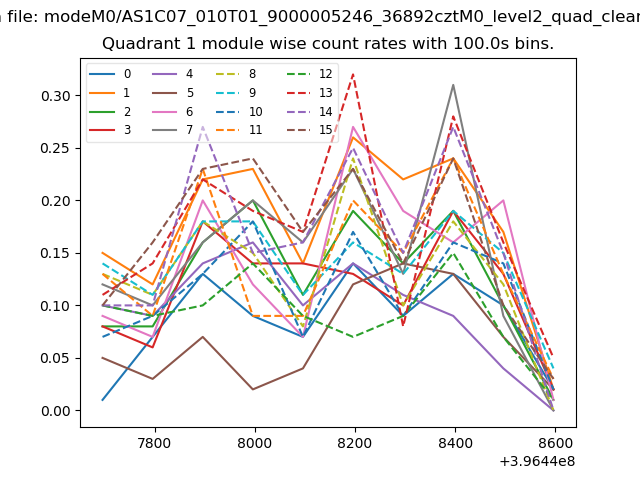
| Module-wise count rates for Quadrant B Data is divided into 100 sec bins |
 |
 |
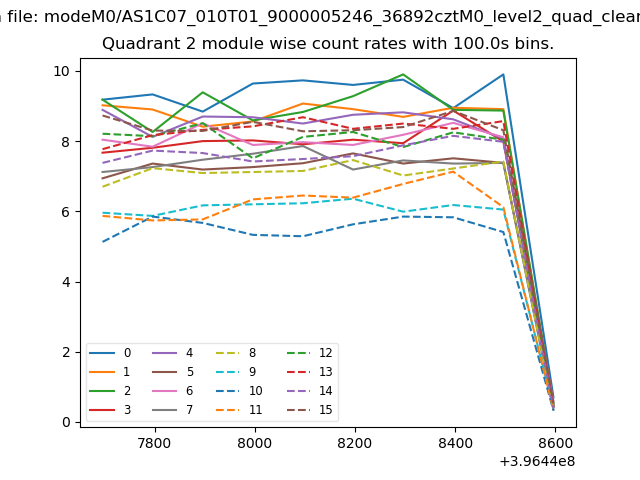
| Module-wise count rates for Quadrant C Data is divided into 100 sec bins |
 |
 |
| Module-wise count rates for Quadrant D Data is divided into 100 sec bins |
 |
 |
| Parameter | Plot |
|---|---|
| CZT HV Monitor | 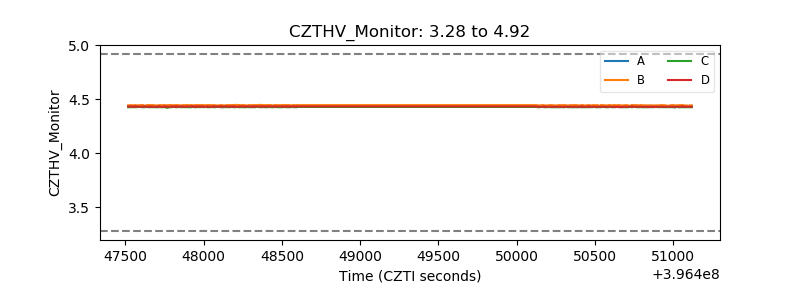 |
| D_VDD | 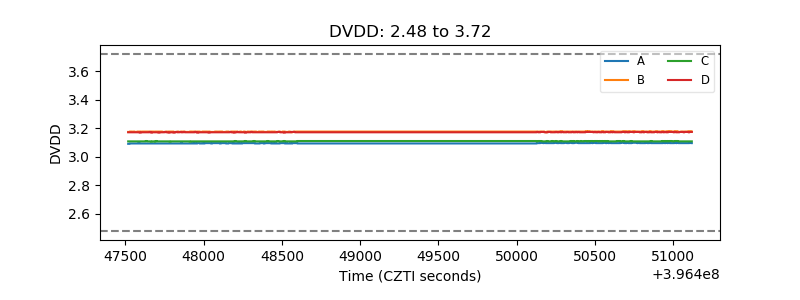 |
| Temperature 1 | 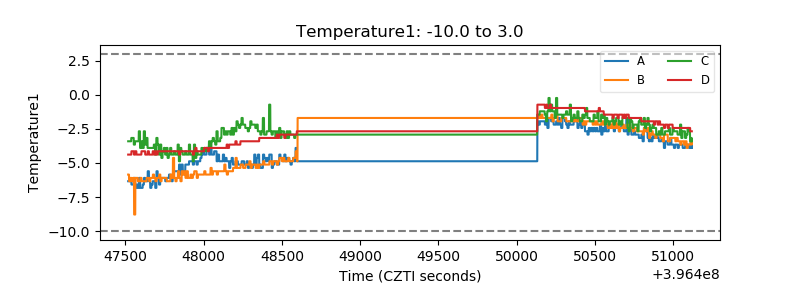 |
| Veto HV Monitor | 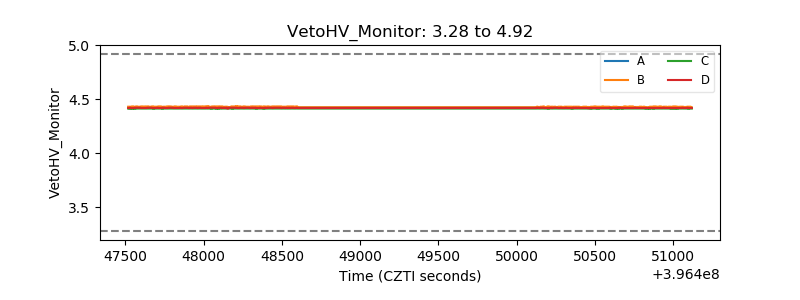 |
| Veto LLD | 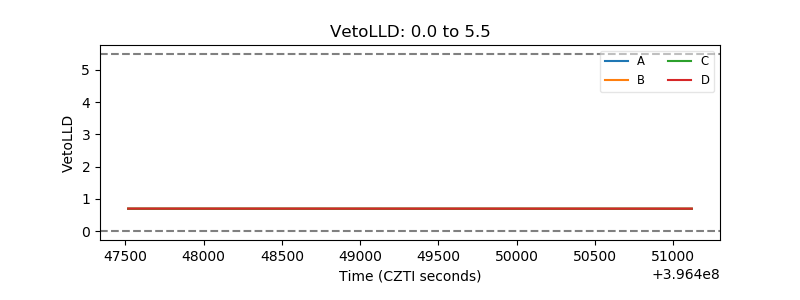 |
| Alpha Counter | 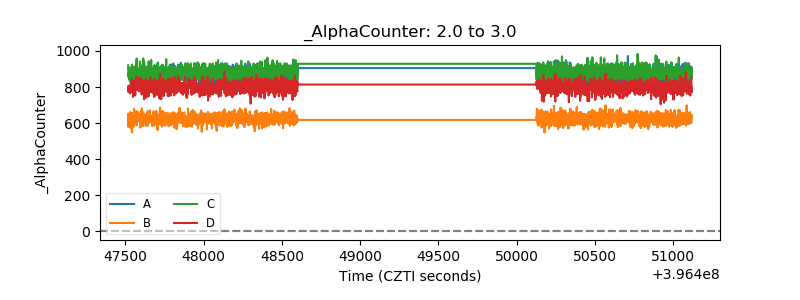 |
| _CPM_Rate | 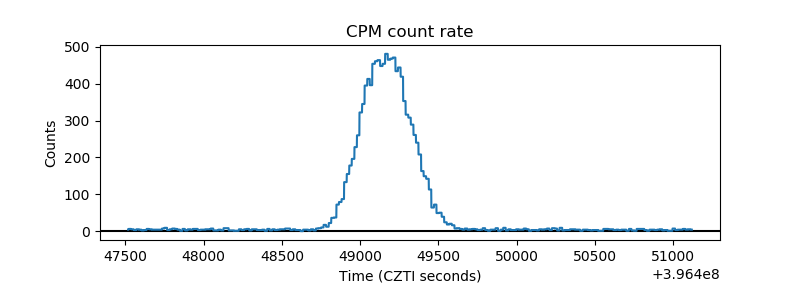 |
| CZT Counter | 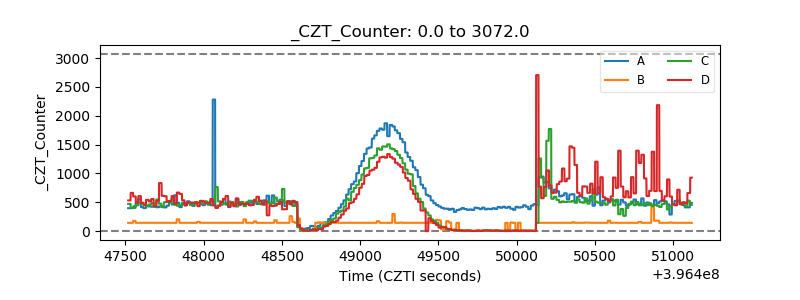 |
| +2.5 Volts monitor |  |
| +5 Volts monitor |  |
| _ROLL_ROT | 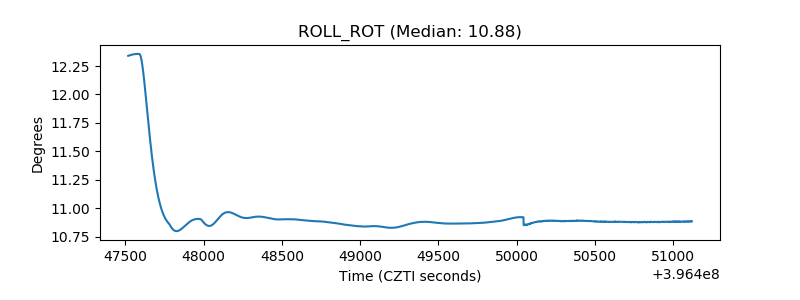 |
| _Roll_DEC | 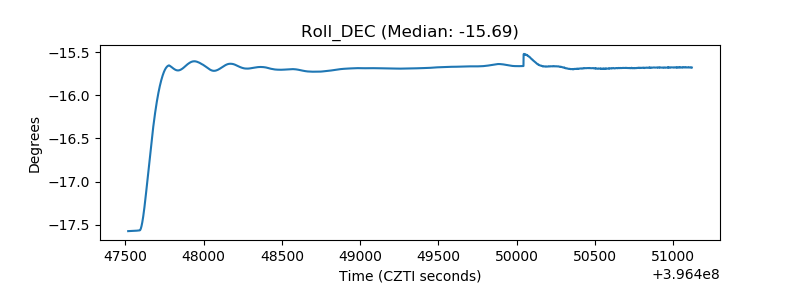 |
| _Roll_RA | 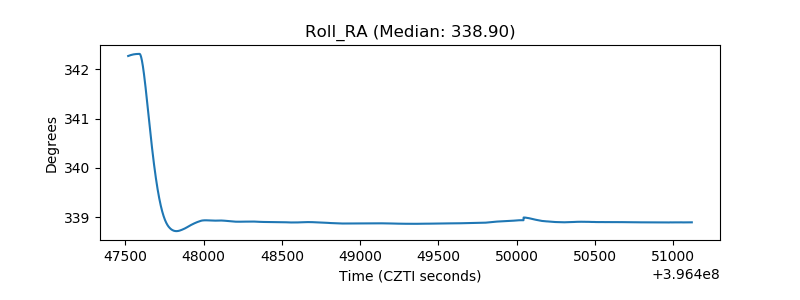 |
| Veto Counter | 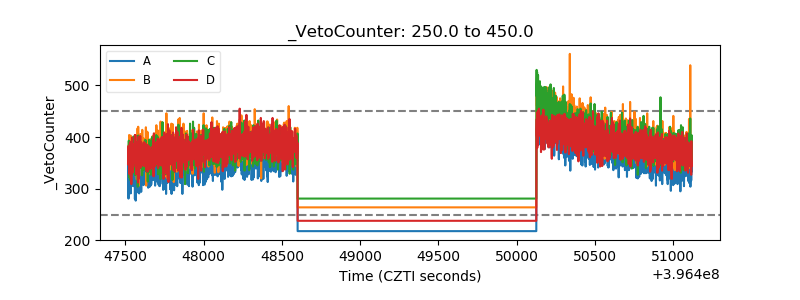 |