| Param | Original file | Final file |
|---|---|---|
| Filename | modeM0/AS1C07_010T01_9000005246_36893cztM0_level2.evt | modeM0/AS1C07_010T01_9000005246_36893cztM0_level2_quad_clean.evt |
| Size (bytes) | 366,894,720 | 53,608,320 |
| Size | 349.9 MB | 51.1 MB |
| Events in quadrant A | 2,719,151 | 426,900 |
| Events in quadrant B | 844,116 | 6,772 |
| Events in quadrant C | 2,739,032 | 415,501 |
| Events in quadrant D | 4,430,952 | 388,925 |
| Mode SS | |||
|---|---|---|---|
| Quadrant | BADHDUFLAG | Total packets | Discarded packets |
| A | 0 | 112 | 0 |
| B | 0 | 112 | 0 |
| C | 0 | 112 | 0 |
| D | 0 | 112 | 0 |
| Mode M9 | |||
|---|---|---|---|
| Quadrant | BADHDUFLAG | Total packets | Discarded packets |
| A | 0 | 27 | 0 |
| B | 0 | 27 | 0 |
| C | 0 | 27 | 0 |
| D | 0 | 28 | 0 |
| Mode M0 | |||
|---|---|---|---|
| Quadrant | BADHDUFLAG | Total packets | Discarded packets |
| A | 0 | 11637 | 3 |
| B | 0 | 5590 | 2 |
| C | 0 | 11443 | 2 |
| D | 0 | 16891 | 2 |
| Quadrant | Total seconds | Saturated seconds | Saturation percentage |
|---|---|---|---|
| A | 5472 | 17 | 0.310673% |
| B | 5472 | 5472 | 100.000000% |
| C | 5472 | 19 | 0.347222% |
| D | 5472 | 319 | 5.829678% |
Noise dominated data is calculated using 1-second bins in cleaned event files. If a bin has >2000 counts, and if more than 50% of those come from <1% of pixels, then it is considered to be noise-dominated and hence unusable.
| Quadrant | # 1 sec bins | Bins with >0 counts | Bins with >2000 counts | High rate bins dominated by noise | Noise dominated (total time) | Noise dominated (detector-on time) | Marked lightcurve |
|---|---|---|---|---|---|---|---|
| A | 7114 | 5473 | 4 | 4 | 0.06% | 0.07% | 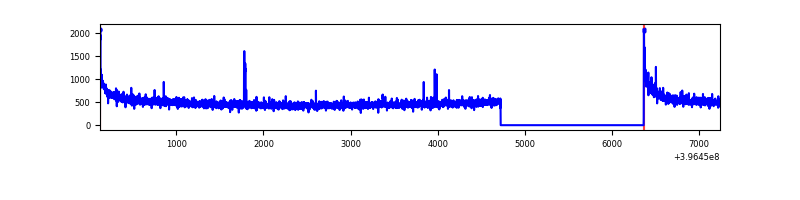 |
| B | 7113 | 5471 | 1 | 1 | 0.01% | 0.02% | 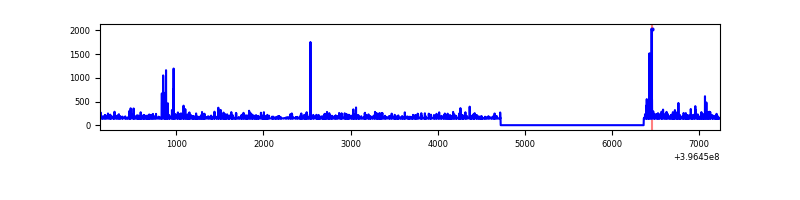 |
| C | 7114 | 5473 | 8 | 8 | 0.11% | 0.15% | 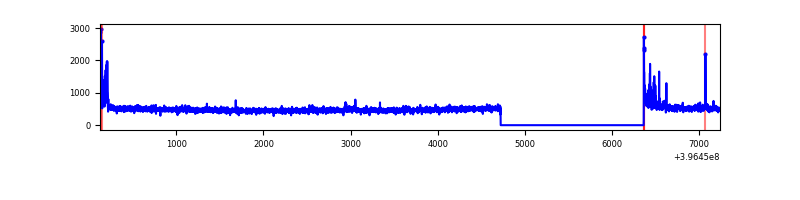 |
| D | 7113 | 5472 | 294 | 294 | 4.13% | 5.37% | 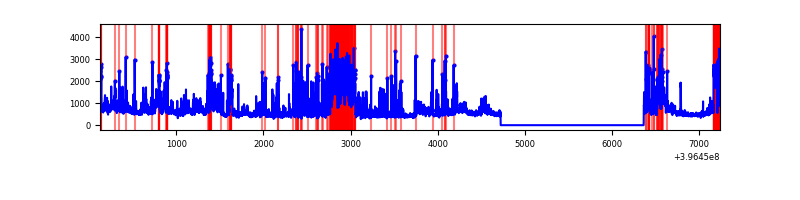 |
Top three noisy pixels from each quadrant. If the there are fewer than three noisy pixels in the level2.evt file, extra rows are filled as -1
| Pixel properties | Quadrant properties | ||||||
|---|---|---|---|---|---|---|---|
| Quadrant | DetID | PixID | Counts | Sigma | Mean | Median | Sigma |
| A | 10 | 83 | 242615 | 1889.92 | 628 | 616 | 128.0 |
| A | 13 | 6 | 14744 | 110.33 | 628 | 616 | 128.0 |
| A | 9 | 143 | 13352 | 99.46 | 628 | 616 | 128.0 |
| B | 12 | 243 | 756904 | 188910.96 | 11 | 11 | 4.0 |
| B | 12 | 144 | 14035 | 3500.21 | 11 | 11 | 4.0 |
| B | 5 | 255 | 9447 | 2355.11 | 11 | 11 | 4.0 |
| C | 15 | 214 | 236402 | 1650.35 | 609 | 614 | 142.9 |
| C | 0 | 10 | 104530 | 727.34 | 609 | 614 | 142.9 |
| C | 15 | 159 | 18553 | 125.56 | 609 | 614 | 142.9 |
| D | 12 | 235 | 1395784 | 9461.34 | 597 | 580 | 147.5 |
| D | 13 | 249 | 442062 | 2993.83 | 597 | 580 | 147.5 |
| D | 5 | 32 | 82410 | 554.92 | 597 | 580 | 147.5 |
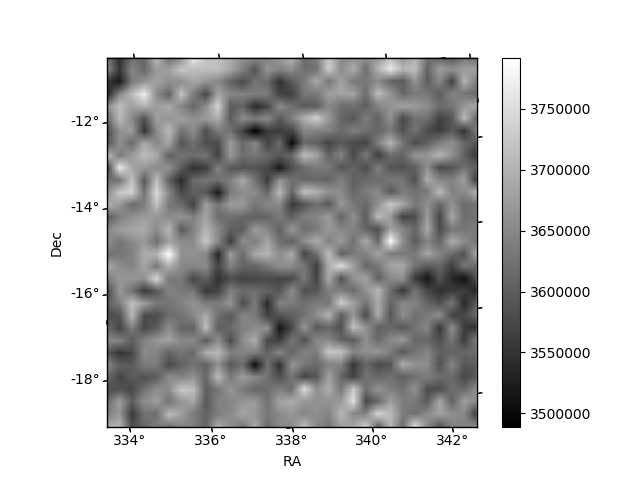
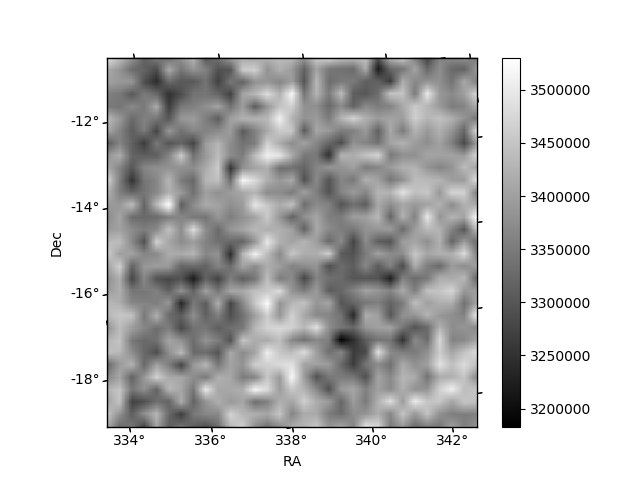
Histogram calculated using DETX and DETY for each event in the final _common_clean file
| Quadrant A | 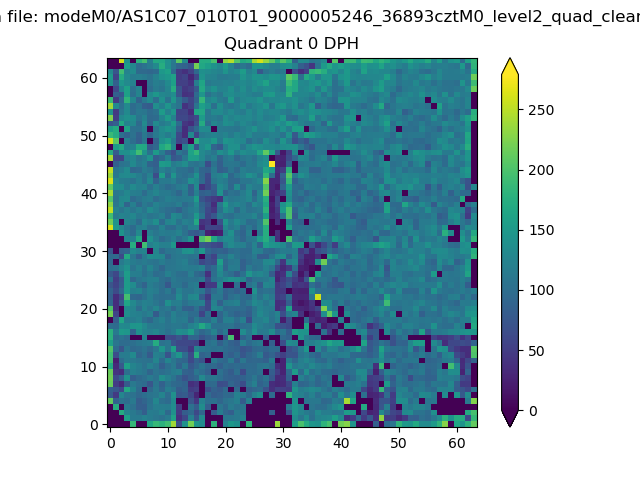 |
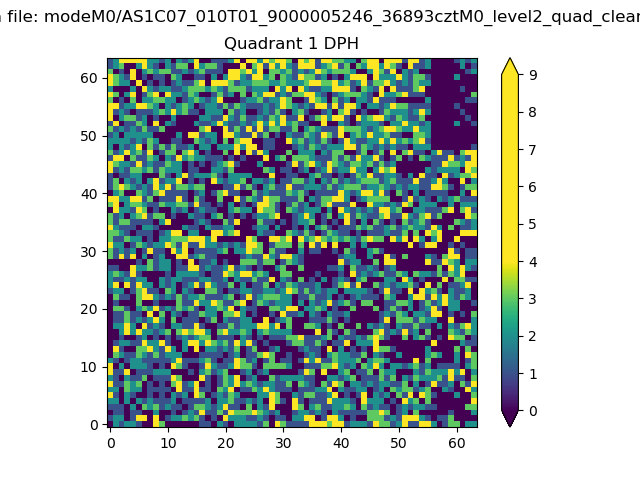 |
Quadrant B |
|---|---|---|---|
| Quadrant D | 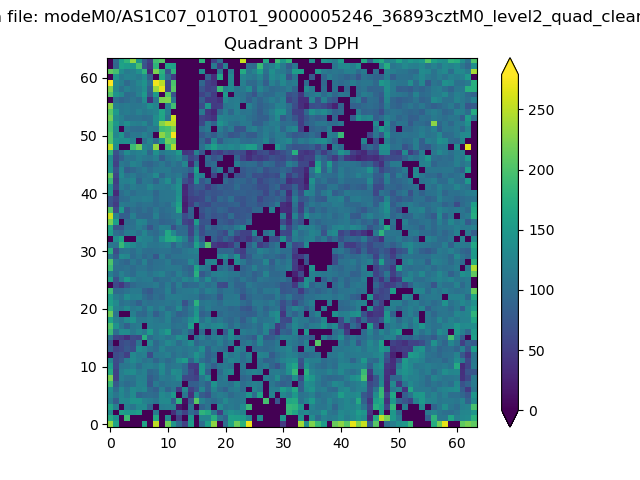 |
 |
Quadrant C |
| Plot type | Count rate plots | Images |
|---|---|---|
| Comparison with Poisson distribution Blue bars denote a histogram of data divided into 1 sec bins. Red curve is a Poisson curve with rate = median count rate of data. |
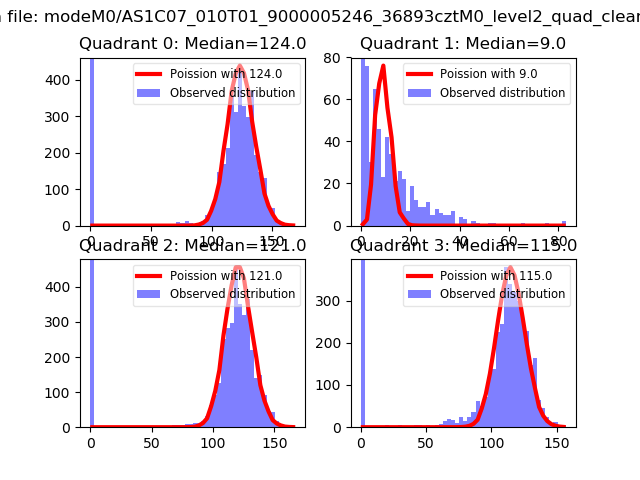 |
 |
| Quadrant-wise count rates Data is divided into 100 sec bins |
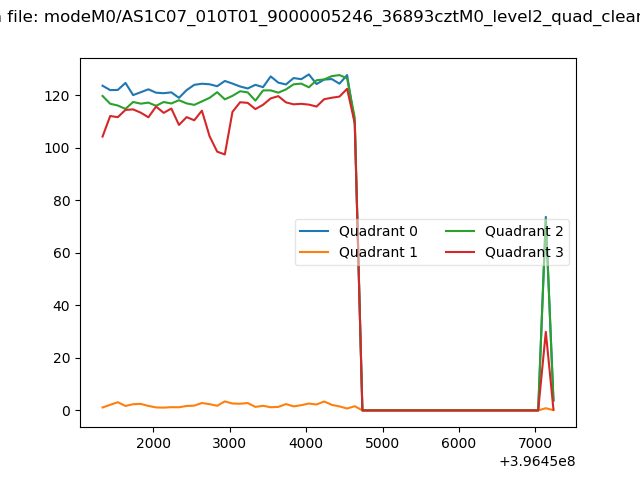 |
|
| Module-wise count rates for Quadrant A Data is divided into 100 sec bins |
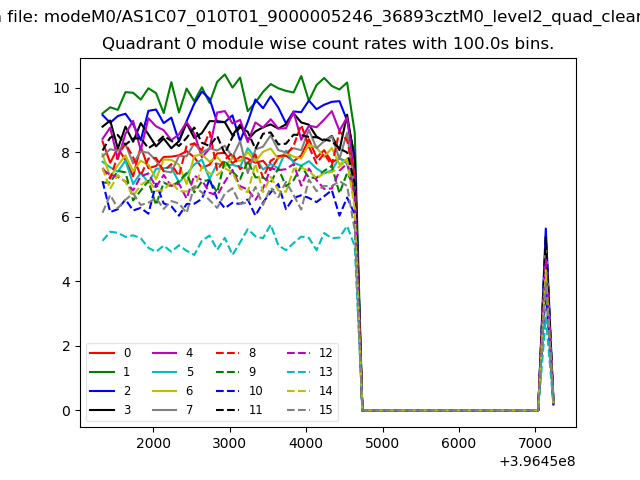 |
 |
| Module-wise count rates for Quadrant B Data is divided into 100 sec bins |
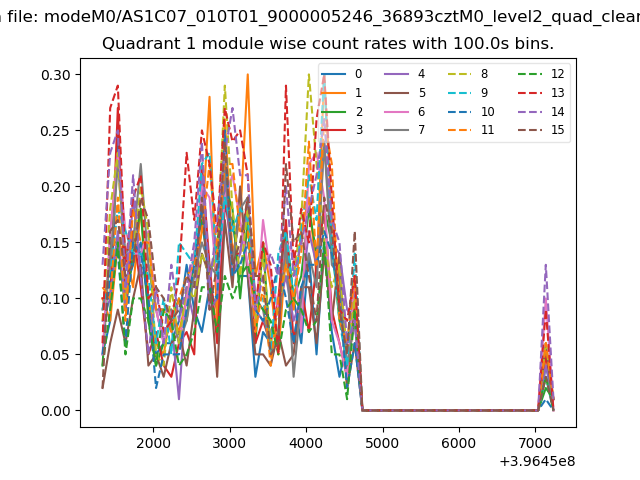 |
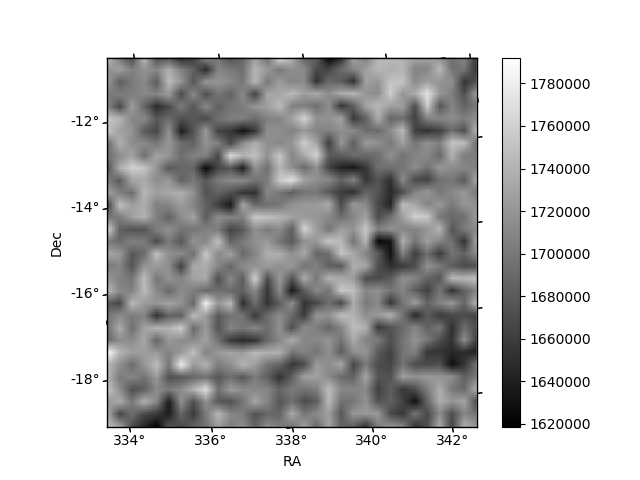 |
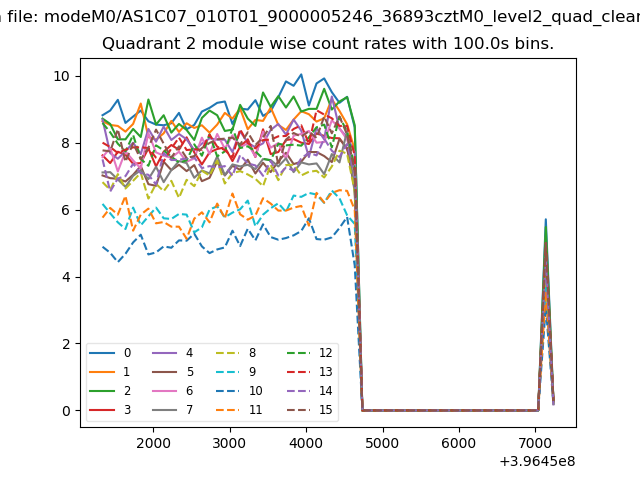
| Module-wise count rates for Quadrant C Data is divided into 100 sec bins |
 |
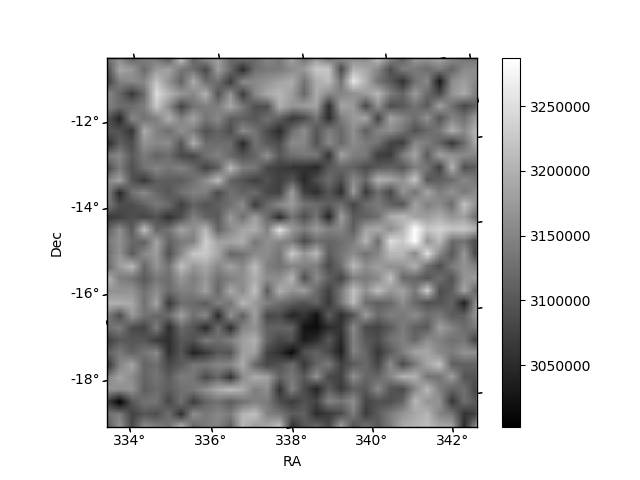 |
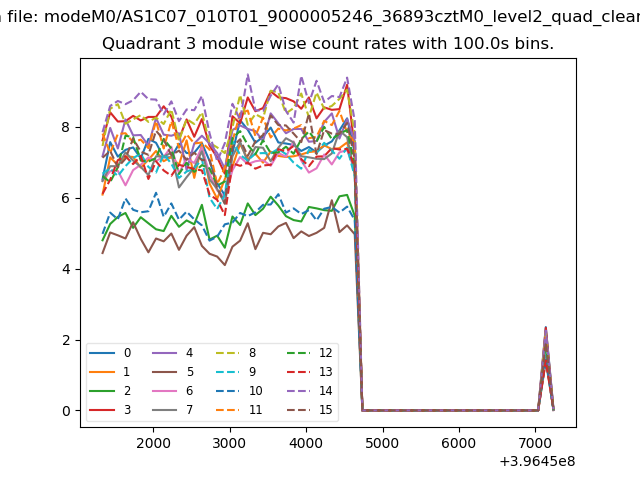
| Module-wise count rates for Quadrant D Data is divided into 100 sec bins |
 |
 |
| Parameter | Plot |
|---|---|
| CZT HV Monitor | 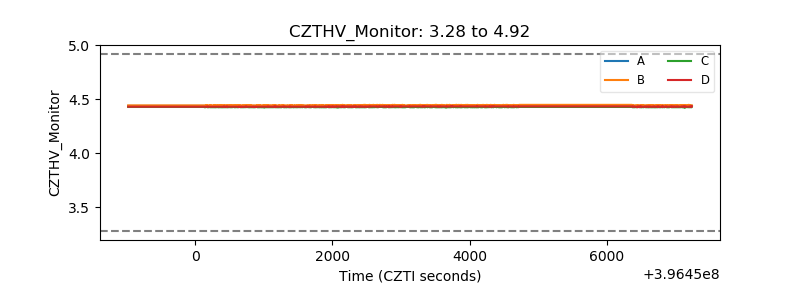 |
| D_VDD | 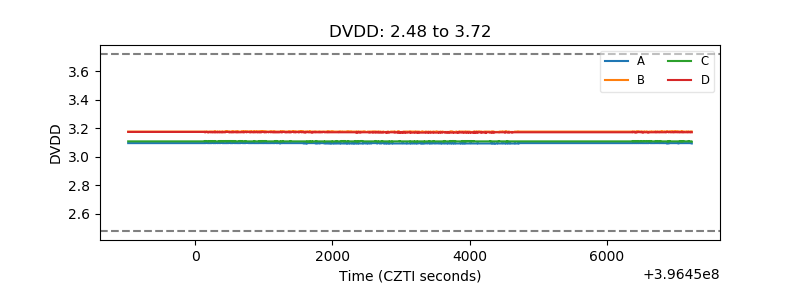 |
| Temperature 1 |  |
| Veto HV Monitor | 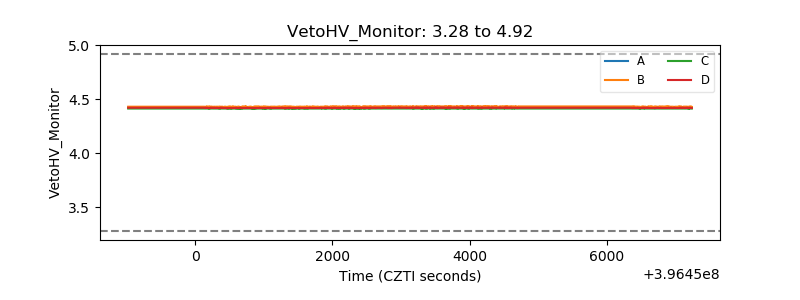 |
| Veto LLD | 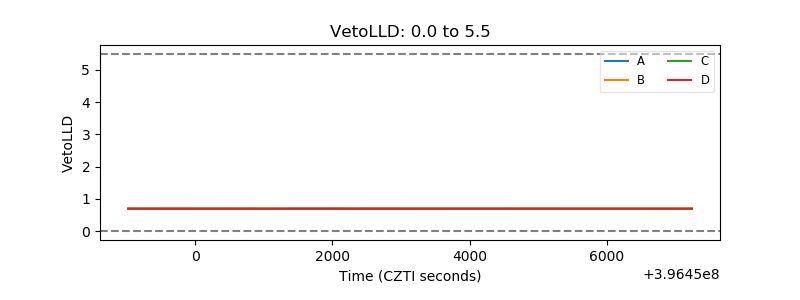 |
| Alpha Counter | 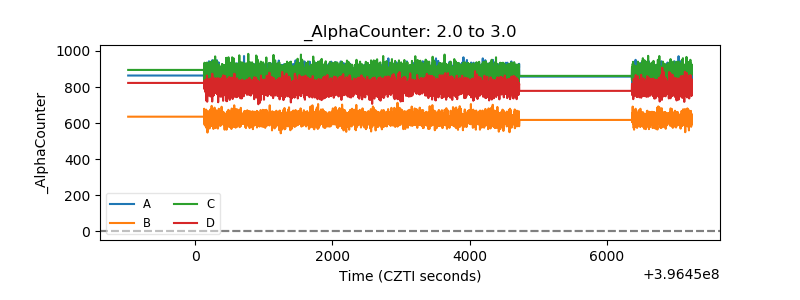 |
| _CPM_Rate |  |
| CZT Counter | 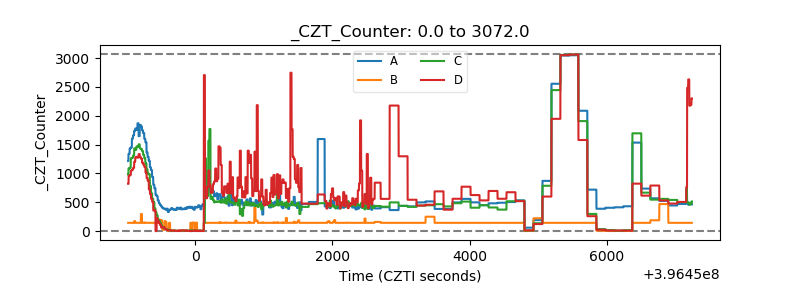 |
| +2.5 Volts monitor |  |
| +5 Volts monitor |  |
| _ROLL_ROT | 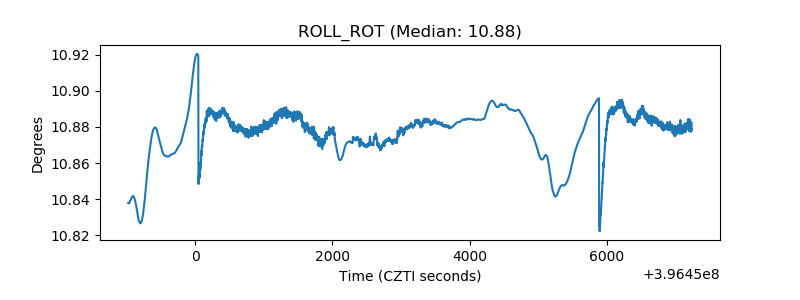 |
| _Roll_DEC | 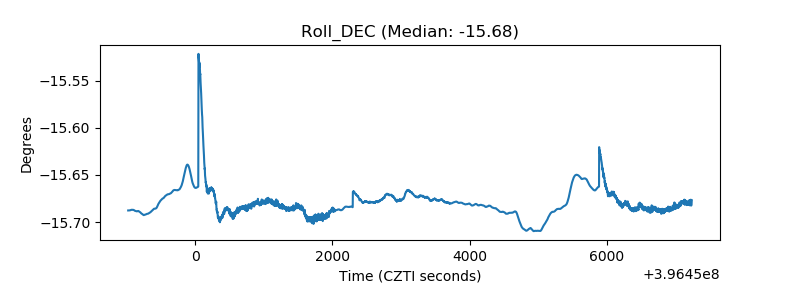 |
| _Roll_RA |  |
| Veto Counter | 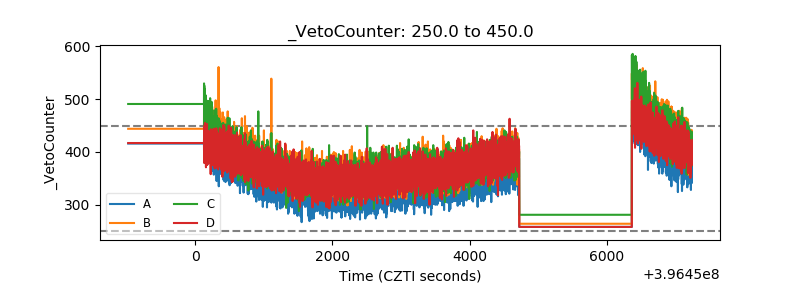 |