| Param | Original file | Final file |
|---|---|---|
| Filename | modeM0/AS1C07_010T01_9000005246_36895cztM0_level2.evt | modeM0/AS1C07_010T01_9000005246_36895cztM0_level2_quad_clean.evt |
| Size (bytes) | 327,565,440 | 62,700,480 |
| Size | 312.4 MB | 59.8 MB |
| Events in quadrant A | 2,715,187 | 520,680 |
| Events in quadrant B | 826,384 | 8,694 |
| Events in quadrant C | 2,706,547 | 509,860 |
| Events in quadrant D | 3,303,902 | 484,321 |
| Mode SS | |||
|---|---|---|---|
| Quadrant | BADHDUFLAG | Total packets | Discarded packets |
| A | 0 | 108 | 0 |
| B | 0 | 108 | 0 |
| C | 0 | 108 | 0 |
| D | 0 | 108 | 0 |
| Mode M9 | |||
|---|---|---|---|
| Quadrant | BADHDUFLAG | Total packets | Discarded packets |
| A | 0 | 33 | 0 |
| B | 0 | 33 | 0 |
| C | 0 | 33 | 0 |
| D | 0 | 33 | 0 |
| Mode M0 | |||
|---|---|---|---|
| Quadrant | BADHDUFLAG | Total packets | Discarded packets |
| A | 0 | 11502 | 3 |
| B | 0 | 5462 | 2 |
| C | 0 | 11226 | 2 |
| D | 0 | 13347 | 2 |
| Quadrant | Total seconds | Saturated seconds | Saturation percentage |
|---|---|---|---|
| A | 5326 | 18 | 0.337965% |
| B | 5326 | 5326 | 100.000000% |
| C | 5326 | 15 | 0.281637% |
| D | 5326 | 166 | 3.116786% |
Noise dominated data is calculated using 1-second bins in cleaned event files. If a bin has >2000 counts, and if more than 50% of those come from <1% of pixels, then it is considered to be noise-dominated and hence unusable.
| Quadrant | # 1 sec bins | Bins with >0 counts | Bins with >2000 counts | High rate bins dominated by noise | Noise dominated (total time) | Noise dominated (detector-on time) | Marked lightcurve |
|---|---|---|---|---|---|---|---|
| A | 7088 | 5327 | 8 | 8 | 0.11% | 0.15% | 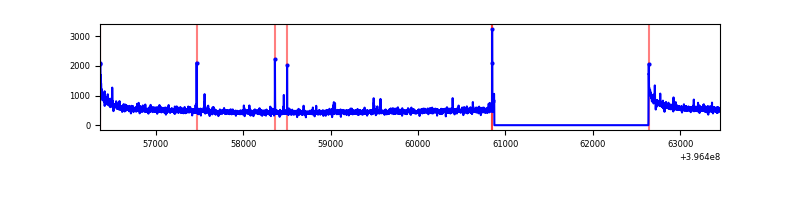 |
| B | 7087 | 5325 | 2 | 2 | 0.03% | 0.04% | 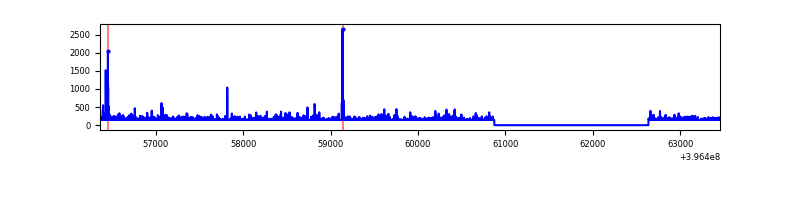 |
| C | 7088 | 5327 | 7 | 7 | 0.10% | 0.13% | 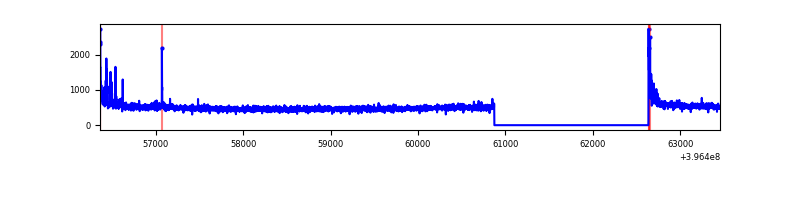 |
| D | 7088 | 5327 | 135 | 135 | 1.90% | 2.53% | 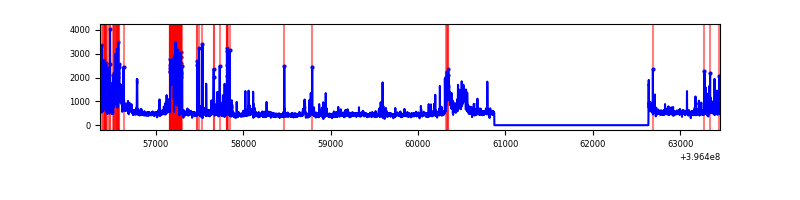 |
Top three noisy pixels from each quadrant. If the there are fewer than three noisy pixels in the level2.evt file, extra rows are filled as -1
| Pixel properties | Quadrant properties | ||||||
|---|---|---|---|---|---|---|---|
| Quadrant | DetID | PixID | Counts | Sigma | Mean | Median | Sigma |
| A | 10 | 83 | 231462 | 1833.2 | 624 | 612 | 125.9 |
| A | 9 | 143 | 31677 | 246.69 | 624 | 612 | 125.9 |
| A | 13 | 6 | 15678 | 119.64 | 624 | 612 | 125.9 |
| B | 12 | 243 | 737063 | 177392.82 | 11 | 11 | 4.2 |
| B | 5 | 255 | 18976 | 4564.47 | 11 | 11 | 4.2 |
| B | 12 | 144 | 13566 | 3262.4 | 11 | 11 | 4.2 |
| C | 15 | 214 | 228315 | 1595.32 | 610 | 614 | 142.7 |
| C | 0 | 10 | 82559 | 574.12 | 610 | 614 | 142.7 |
| C | 15 | 159 | 18596 | 125.99 | 610 | 614 | 142.7 |
| D | 13 | 249 | 448747 | 3041.26 | 601 | 585 | 147.4 |
| D | 13 | 171 | 185742 | 1256.49 | 601 | 585 | 147.4 |
| D | 2 | 153 | 85881 | 578.82 | 601 | 585 | 147.4 |
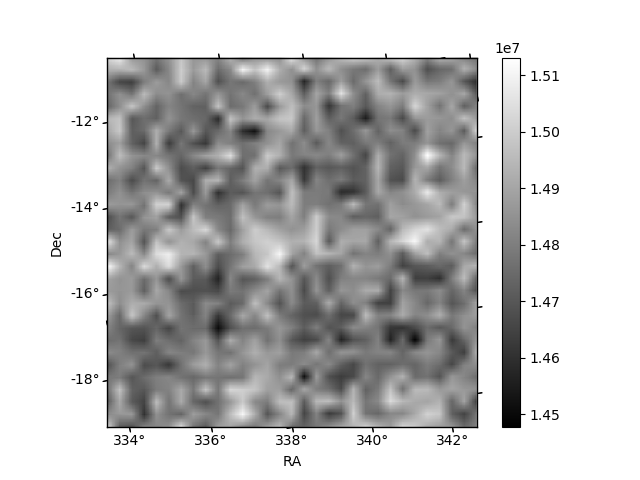
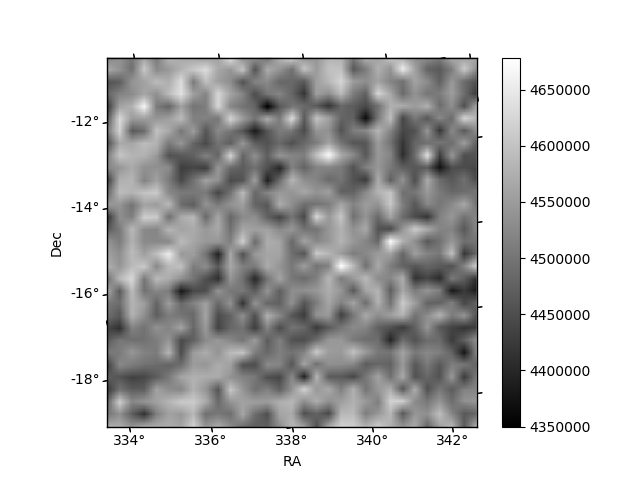
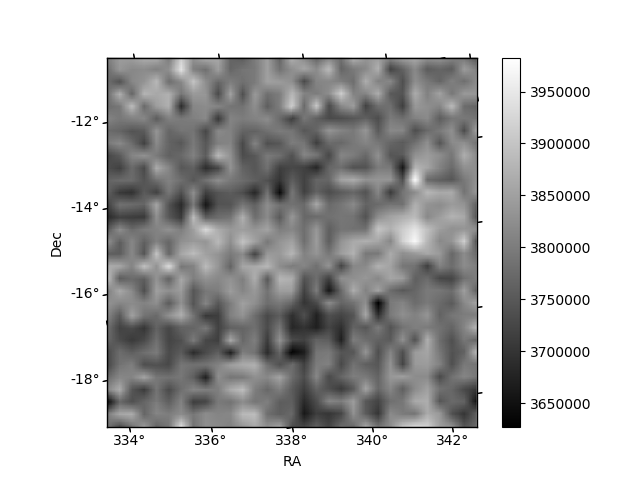
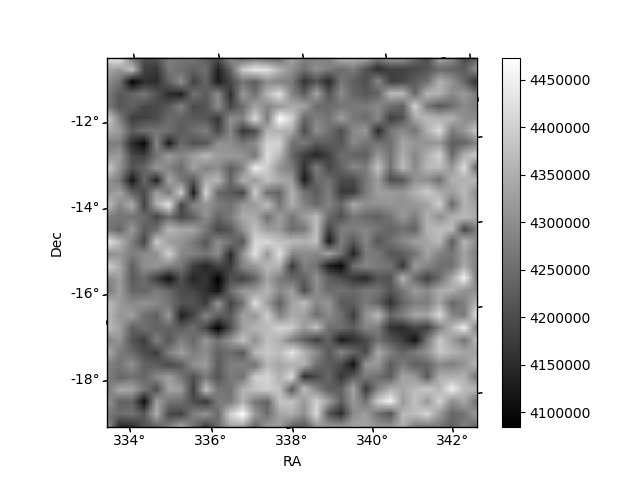
Histogram calculated using DETX and DETY for each event in the final _common_clean file
| Quadrant A | 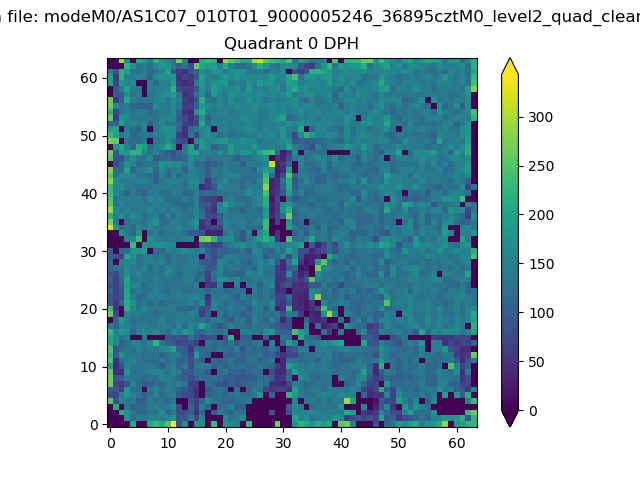 |
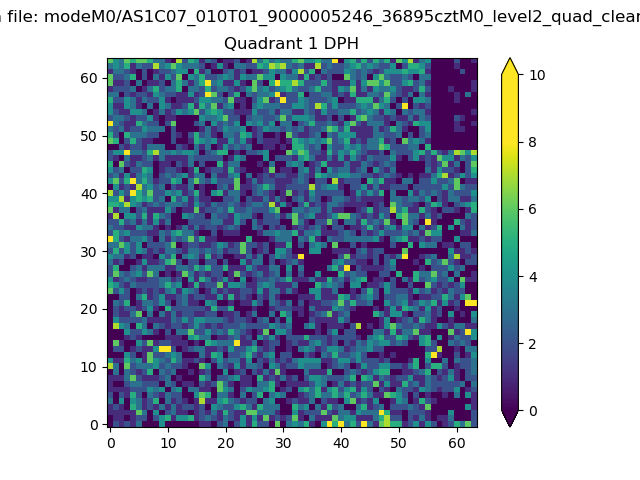 |
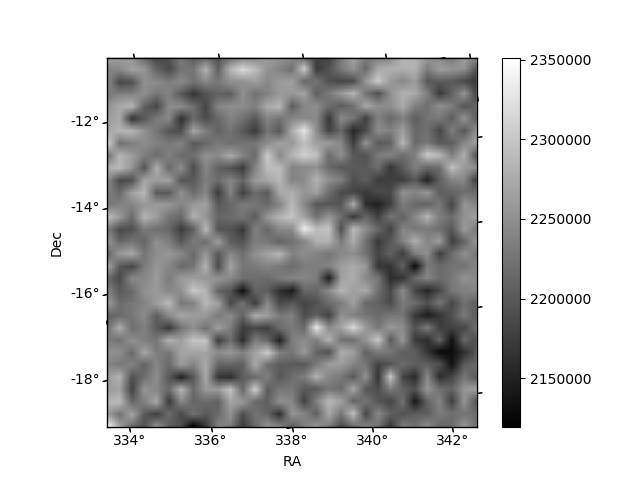
Quadrant B |
|---|---|---|---|
| Quadrant D | 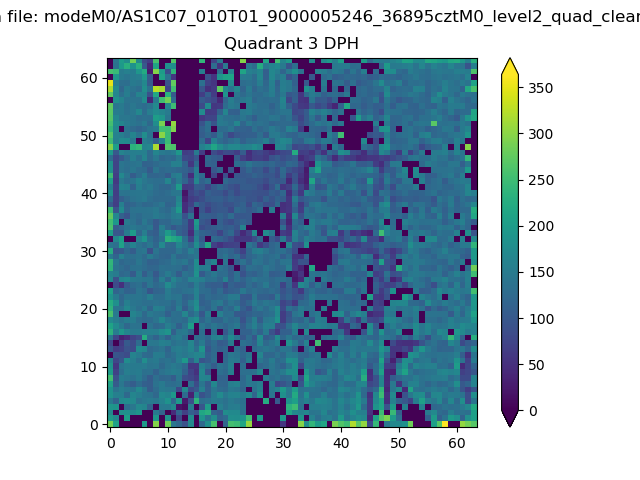 |
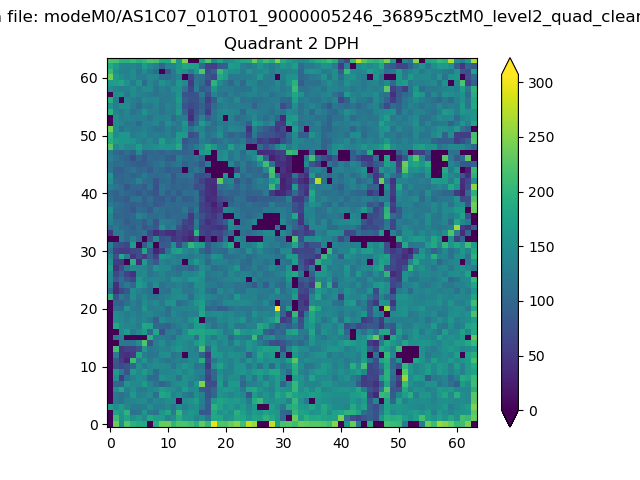 |
Quadrant C |
| Plot type | Count rate plots | Images |
|---|---|---|
| Comparison with Poisson distribution Blue bars denote a histogram of data divided into 1 sec bins. Red curve is a Poisson curve with rate = median count rate of data. |
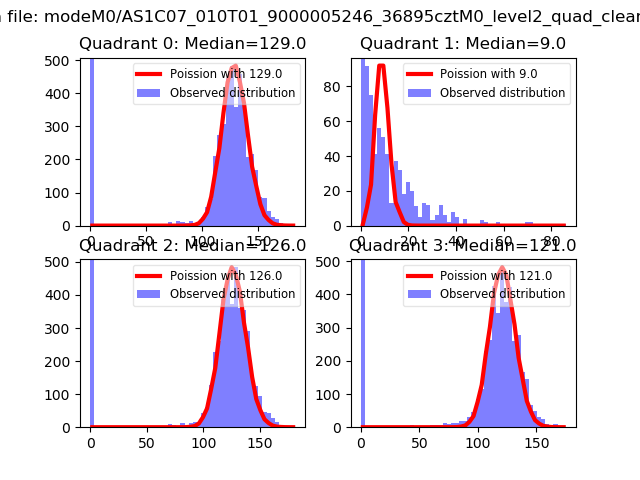 |
 |
| Quadrant-wise count rates Data is divided into 100 sec bins |
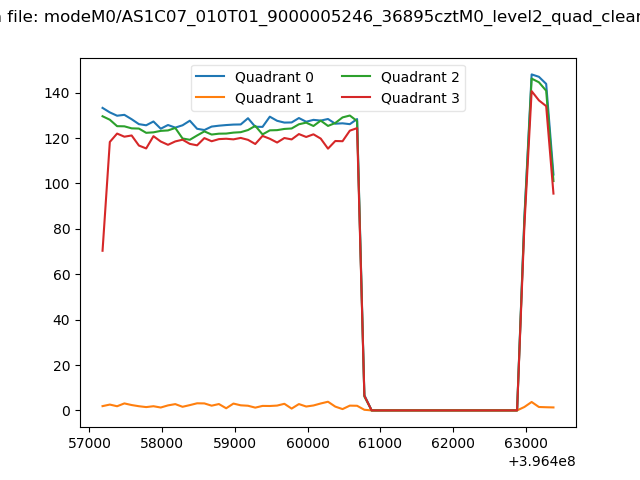 |
|
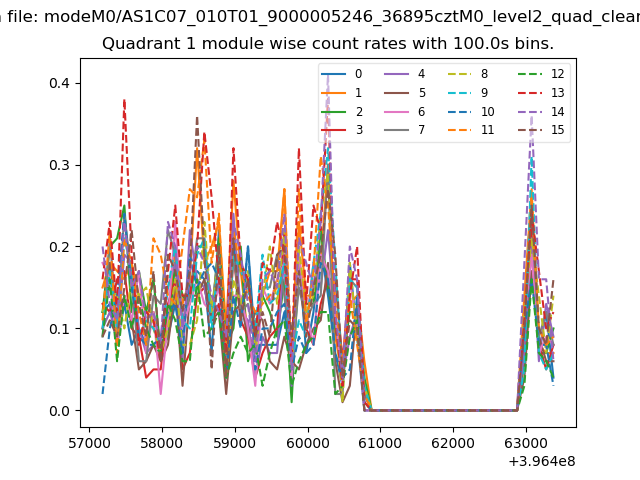
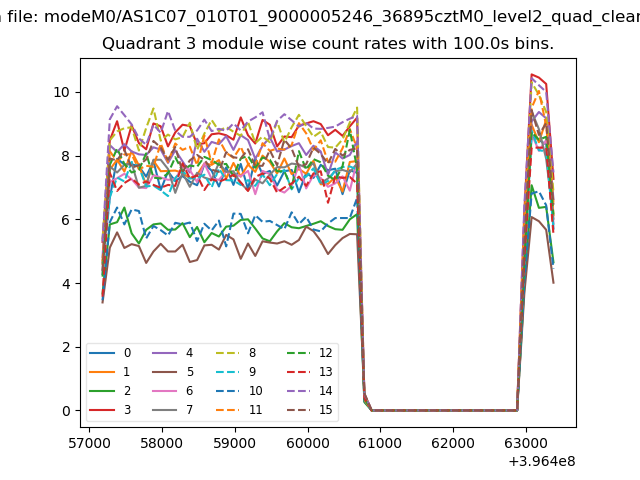
| Module-wise count rates for Quadrant A Data is divided into 100 sec bins |
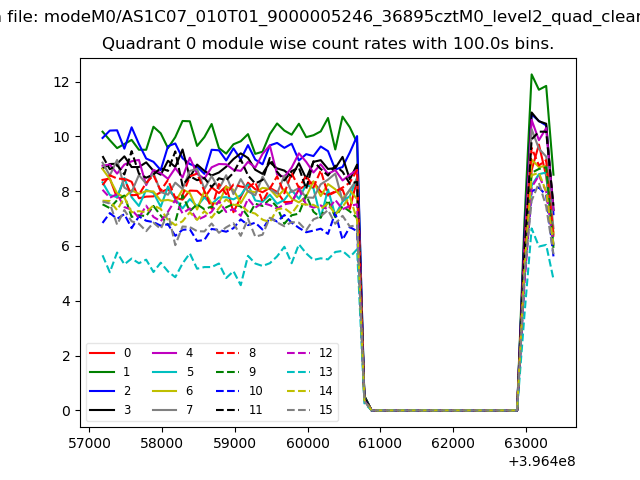 |
 |
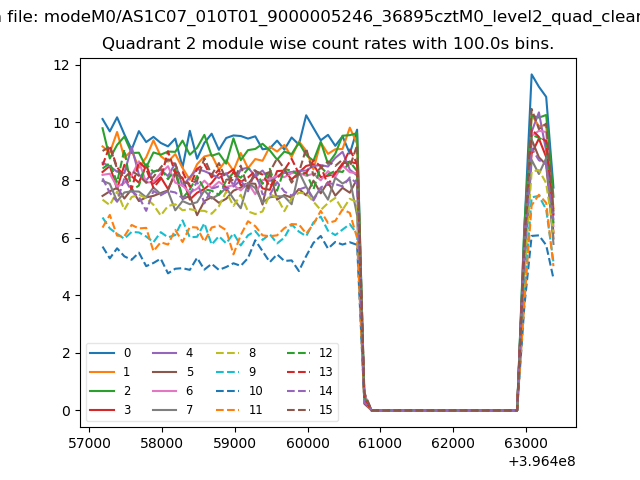
| Module-wise count rates for Quadrant B Data is divided into 100 sec bins |
 |
 |
| Module-wise count rates for Quadrant C Data is divided into 100 sec bins |
 |
 |
| Module-wise count rates for Quadrant D Data is divided into 100 sec bins |
 |
 |
| Parameter | Plot |
|---|---|
| CZT HV Monitor | 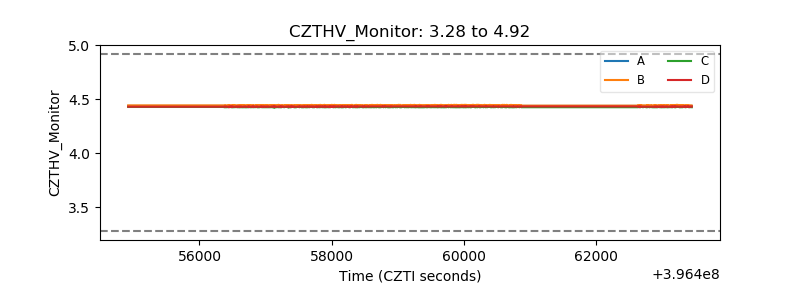 |
| D_VDD | 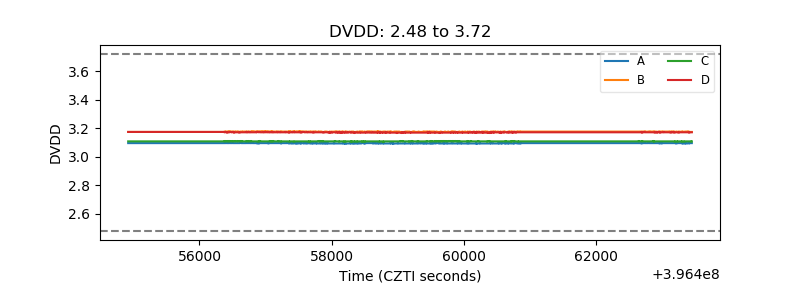 |
| Temperature 1 | 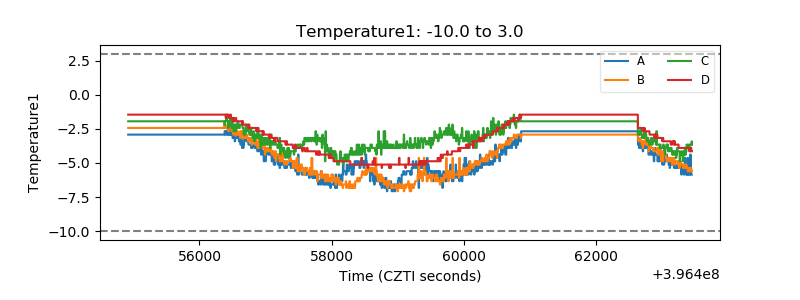 |
| Veto HV Monitor | 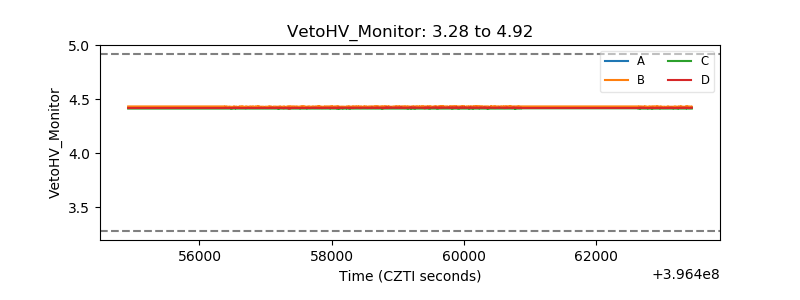 |
| Veto LLD | 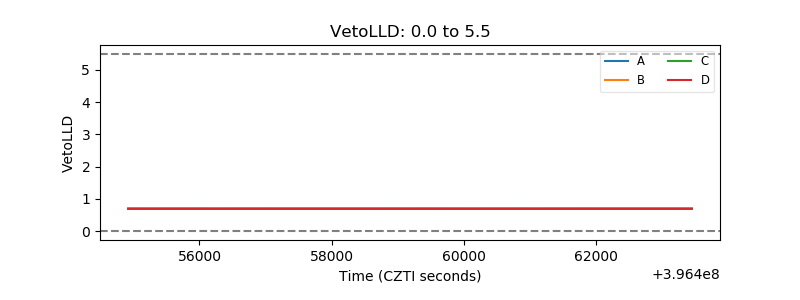 |
| Alpha Counter | 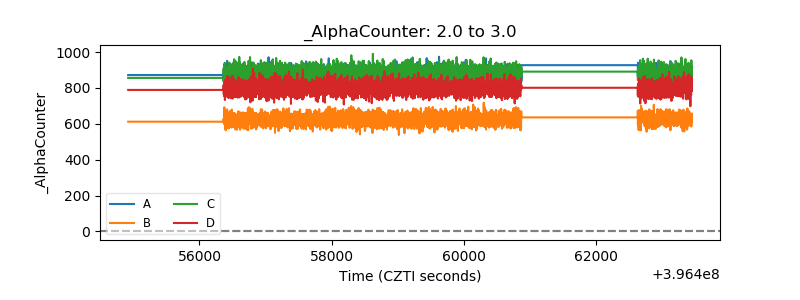 |
| _CPM_Rate | 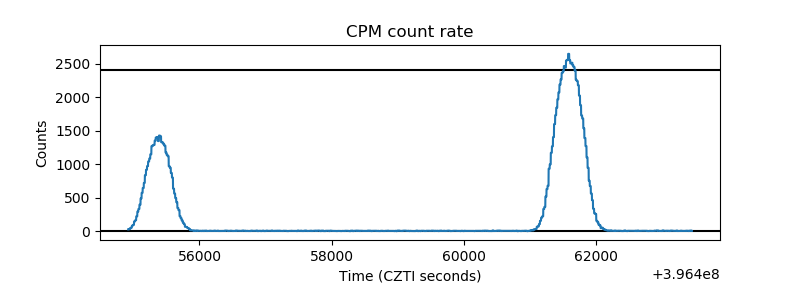 |
| CZT Counter | 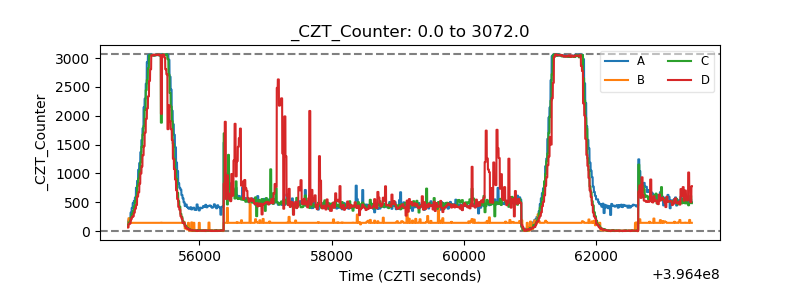 |
| +2.5 Volts monitor | 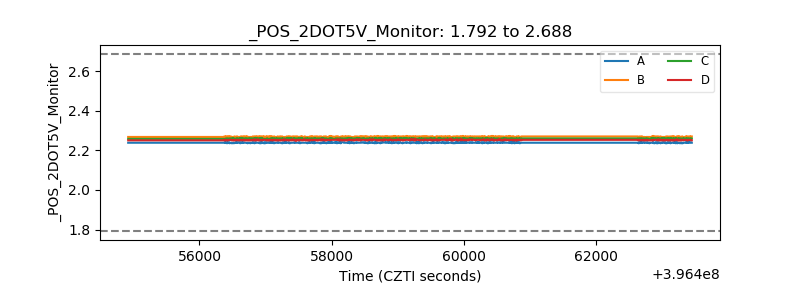 |
| +5 Volts monitor |  |
| _ROLL_ROT | 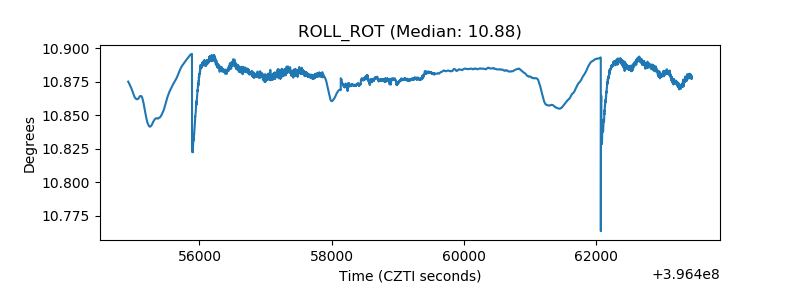 |
| _Roll_DEC | 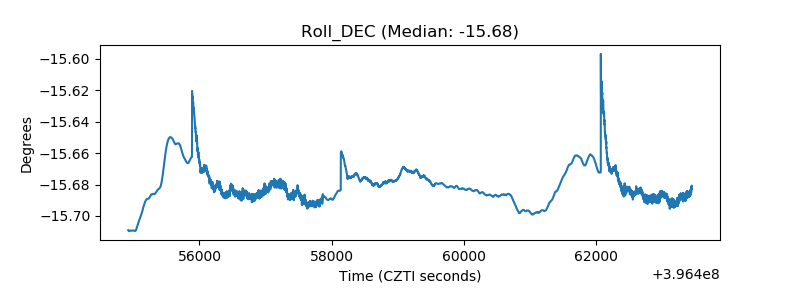 |
| _Roll_RA | 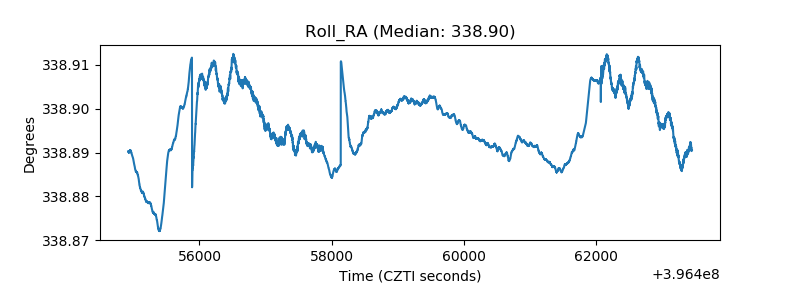 |
| Veto Counter | 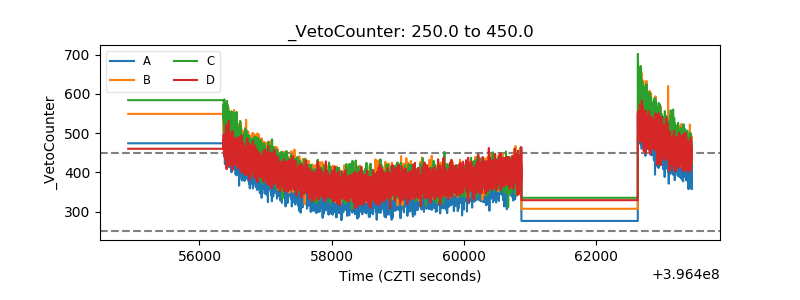 |