| Param | Original file | Final file |
|---|---|---|
| Filename | modeM0/AS1C07_010T01_9000005246_36896cztM0_level2.evt | modeM0/AS1C07_010T01_9000005246_36896cztM0_level2_quad_clean.evt |
| Size (bytes) | 322,940,160 | 72,089,280 |
| Size | 308.0 MB | 68.7 MB |
| Events in quadrant A | 2,778,255 | 612,853 |
| Events in quadrant B | 808,527 | 9,349 |
| Events in quadrant C | 2,804,410 | 607,897 |
| Events in quadrant D | 3,018,626 | 575,667 |
| Mode SS | |||
|---|---|---|---|
| Quadrant | BADHDUFLAG | Total packets | Discarded packets |
| A | 0 | 112 | 0 |
| B | 0 | 112 | 0 |
| C | 0 | 112 | 0 |
| D | 0 | 112 | 0 |
| Mode M9 | |||
|---|---|---|---|
| Quadrant | BADHDUFLAG | Total packets | Discarded packets |
| A | 0 | 36 | 0 |
| B | 0 | 36 | 0 |
| C | 0 | 36 | 0 |
| D | 0 | 36 | 0 |
| Mode M0 | |||
|---|---|---|---|
| Quadrant | BADHDUFLAG | Total packets | Discarded packets |
| A | 0 | 11596 | 3 |
| B | 0 | 5408 | 2 |
| C | 0 | 11403 | 2 |
| D | 0 | 12448 | 2 |
| Quadrant | Total seconds | Saturated seconds | Saturation percentage |
|---|---|---|---|
| A | 5351 | 19 | 0.355074% |
| B | 5351 | 5351 | 100.000000% |
| C | 5351 | 22 | 0.411138% |
| D | 5351 | 84 | 1.569800% |
Noise dominated data is calculated using 1-second bins in cleaned event files. If a bin has >2000 counts, and if more than 50% of those come from <1% of pixels, then it is considered to be noise-dominated and hence unusable.
| Quadrant | # 1 sec bins | Bins with >0 counts | Bins with >2000 counts | High rate bins dominated by noise | Noise dominated (total time) | Noise dominated (detector-on time) | Marked lightcurve |
|---|---|---|---|---|---|---|---|
| A | 8997 | 5354 | 9 | 9 | 0.10% | 0.17% | 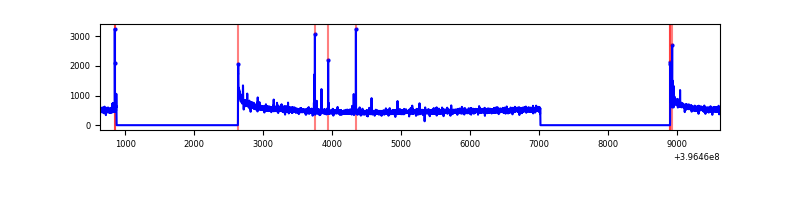 |
| B | 8996 | 5350 | 0 | 0 | 0.00% | 0.00% | 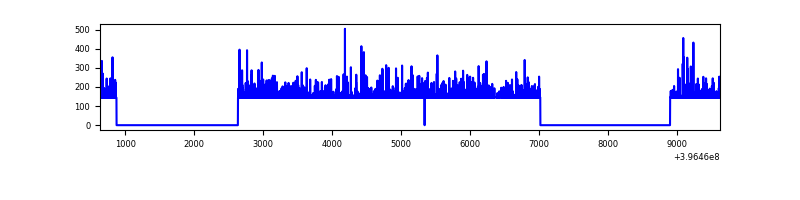 |
| C | 8997 | 5354 | 10 | 10 | 0.11% | 0.19% | 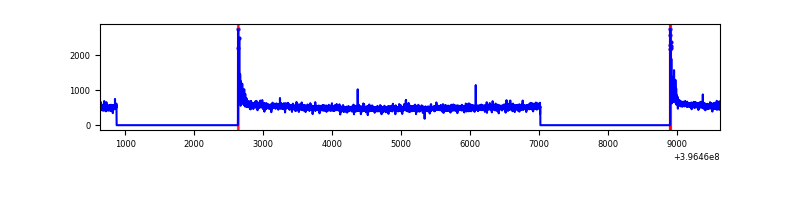 |
| D | 8997 | 5354 | 81 | 81 | 0.90% | 1.51% | 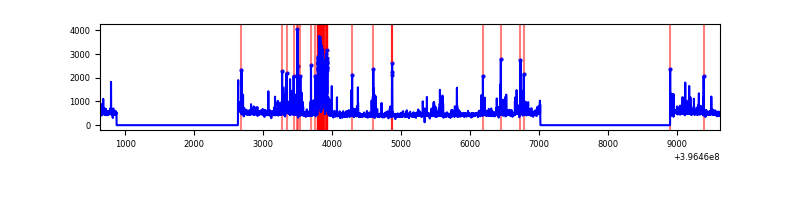 |
Top three noisy pixels from each quadrant. If the there are fewer than three noisy pixels in the level2.evt file, extra rows are filled as -1
| Pixel properties | Quadrant properties | ||||||
|---|---|---|---|---|---|---|---|
| Quadrant | DetID | PixID | Counts | Sigma | Mean | Median | Sigma |
| A | 10 | 83 | 226151 | 1740.94 | 643 | 632 | 129.5 |
| A | 9 | 143 | 34418 | 260.82 | 643 | 632 | 129.5 |
| A | 13 | 6 | 20470 | 153.14 | 643 | 632 | 129.5 |
| B | 12 | 243 | 743835 | 183164.9 | 11 | 11 | 4.1 |
| B | 12 | 144 | 13420 | 3301.93 | 11 | 11 | 4.1 |
| B | 5 | 255 | 1340 | 327.26 | 11 | 11 | 4.1 |
| C | 15 | 214 | 230482 | 1562.0 | 632 | 640 | 147.1 |
| C | 0 | 10 | 101978 | 688.69 | 632 | 640 | 147.1 |
| C | 1 | 157 | 6941 | 42.82 | 632 | 640 | 147.1 |
| D | 12 | 233 | 300538 | 1966.19 | 628 | 613 | 152.5 |
| D | 2 | 153 | 82151 | 534.53 | 628 | 613 | 152.5 |
| D | 2 | 250 | 50443 | 326.67 | 628 | 613 | 152.5 |
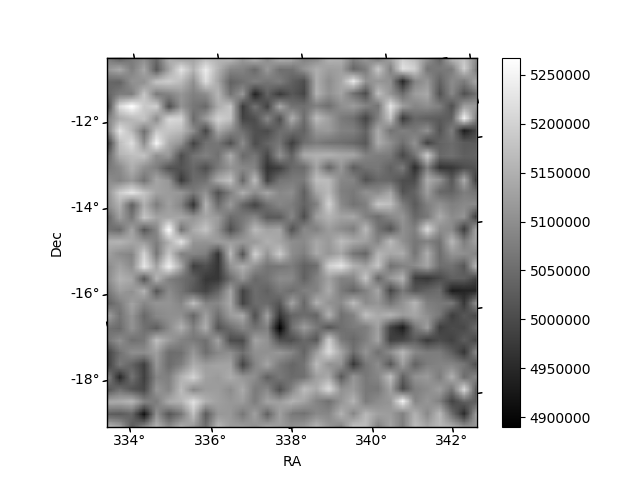
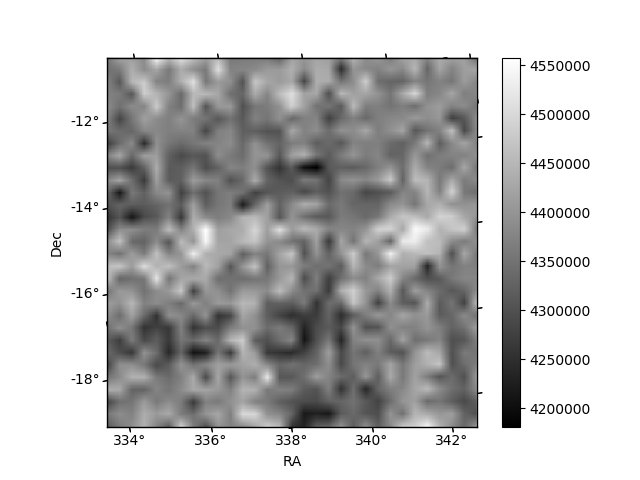
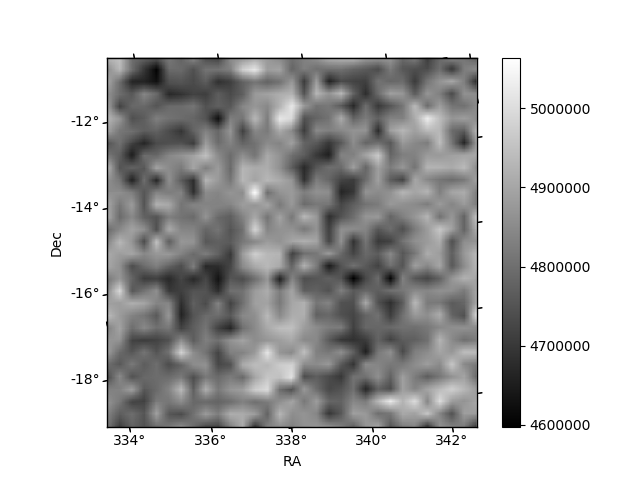
Histogram calculated using DETX and DETY for each event in the final _common_clean file
| Quadrant A | 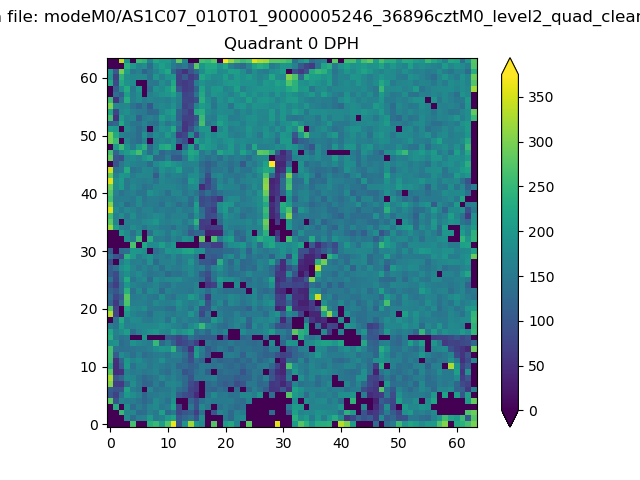 |
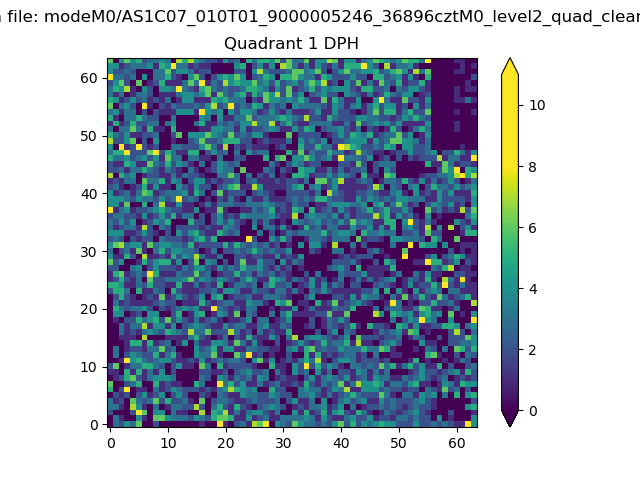 |
Quadrant B |
|---|---|---|---|
| Quadrant D | 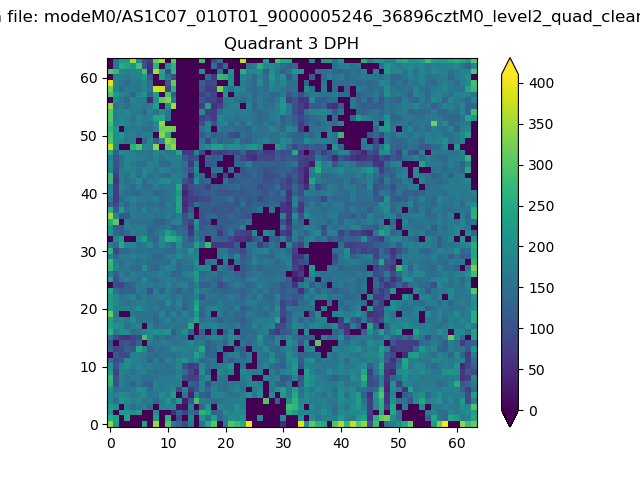 |
 |
Quadrant C |
| Plot type | Count rate plots | Images |
|---|---|---|
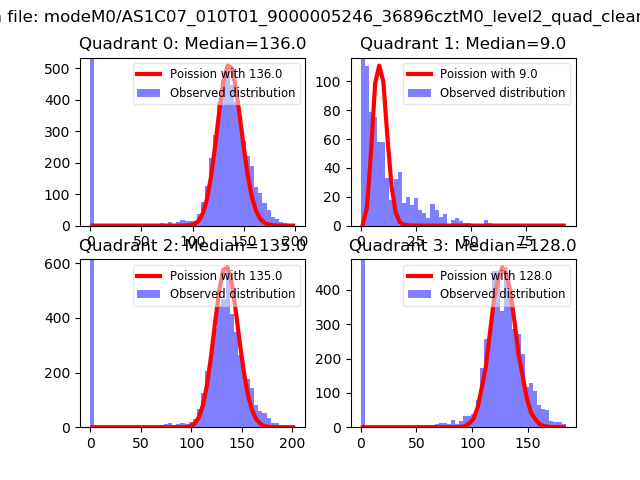
| Comparison with Poisson distribution Blue bars denote a histogram of data divided into 1 sec bins. Red curve is a Poisson curve with rate = median count rate of data. |
 |
 |
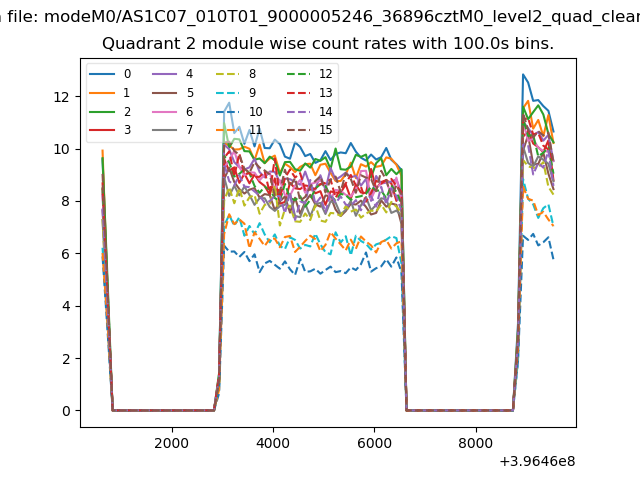
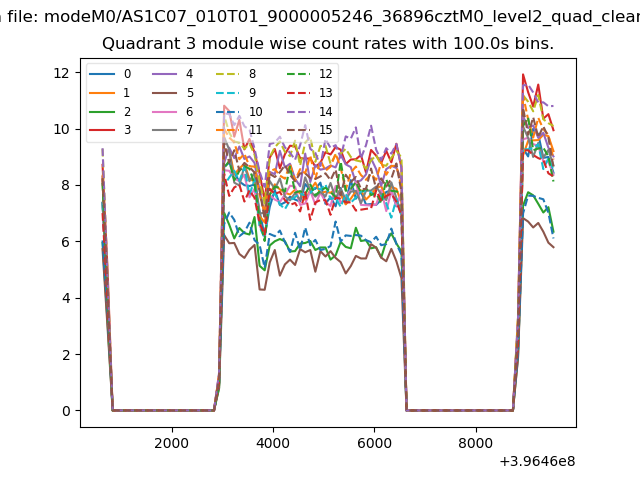
| Quadrant-wise count rates Data is divided into 100 sec bins |
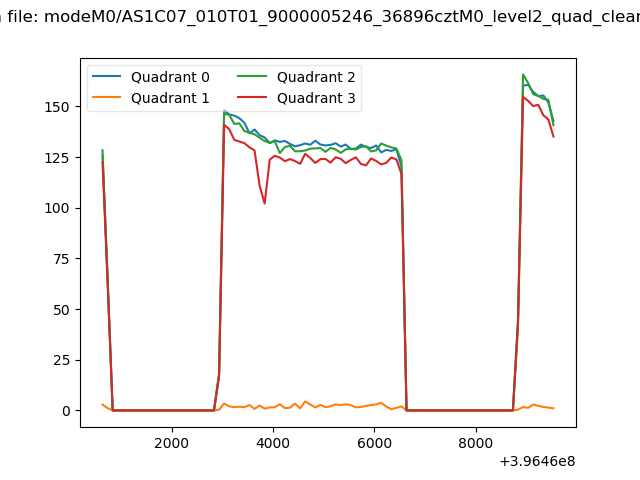 |
|
| Module-wise count rates for Quadrant A Data is divided into 100 sec bins |
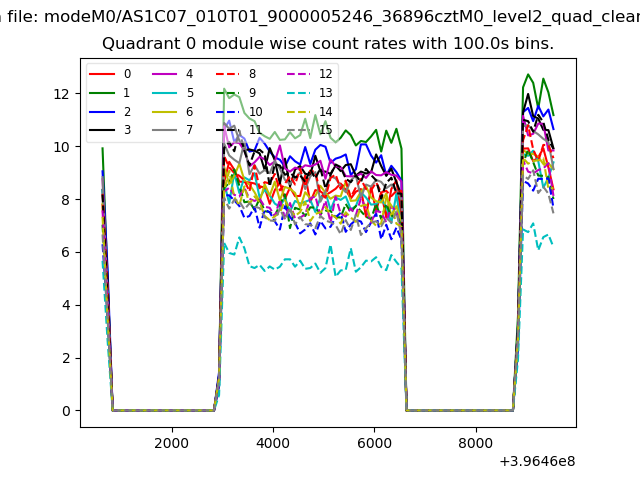 |
 |
| Module-wise count rates for Quadrant B Data is divided into 100 sec bins |
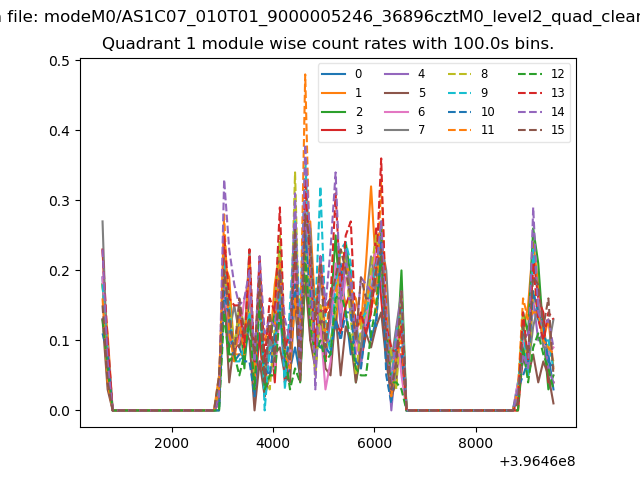 |
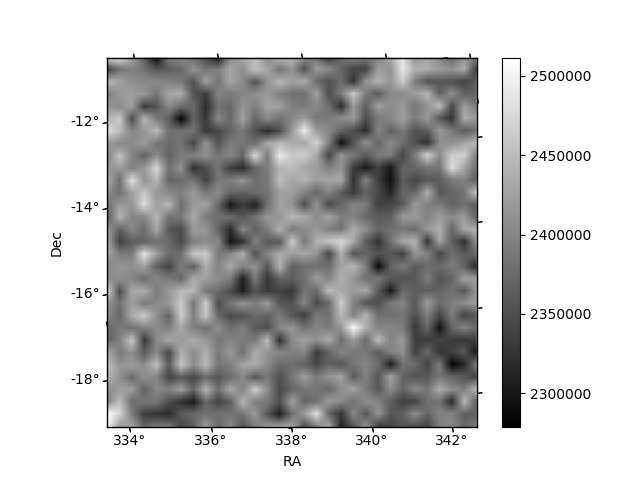 |
| Module-wise count rates for Quadrant C Data is divided into 100 sec bins |
 |
 |
| Module-wise count rates for Quadrant D Data is divided into 100 sec bins |
 |
 |
| Parameter | Plot |
|---|---|
| CZT HV Monitor | 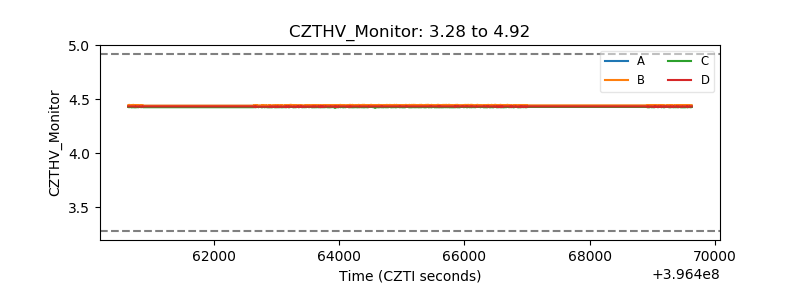 |
| D_VDD | 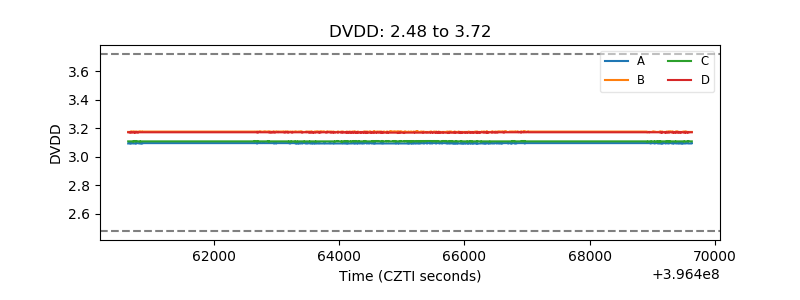 |
| Temperature 1 |  |
| Veto HV Monitor | 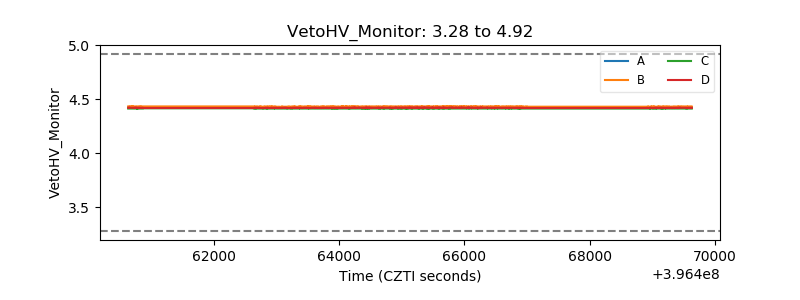 |
| Veto LLD | 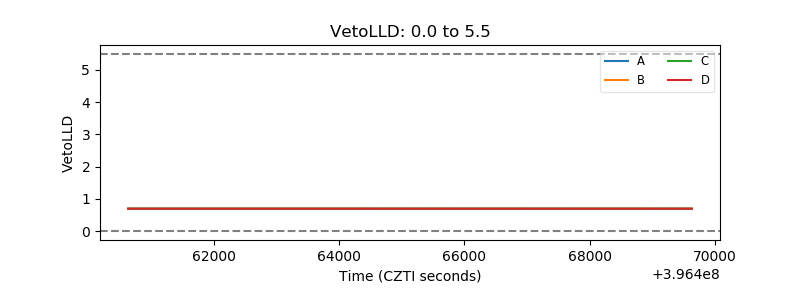 |
| Alpha Counter | 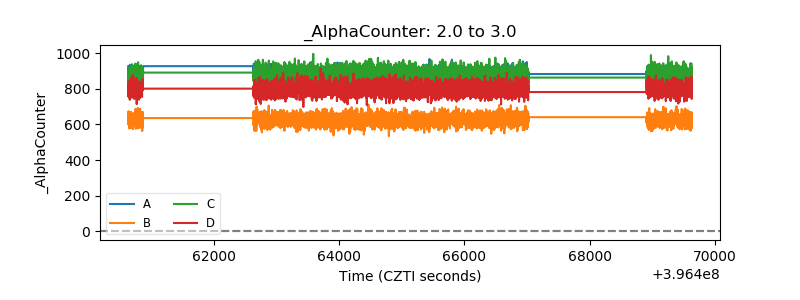 |
| _CPM_Rate | 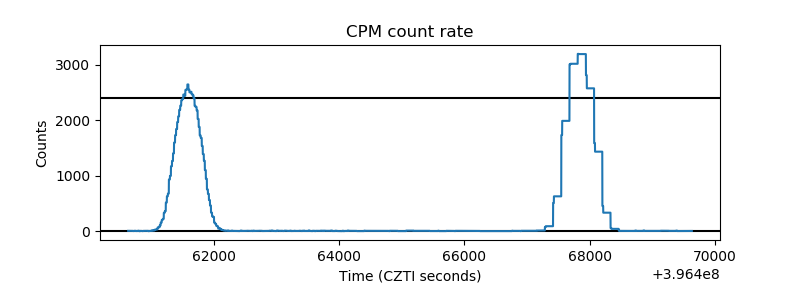 |
| CZT Counter |  |
| +2.5 Volts monitor |  |
| +5 Volts monitor |  |
| _ROLL_ROT | 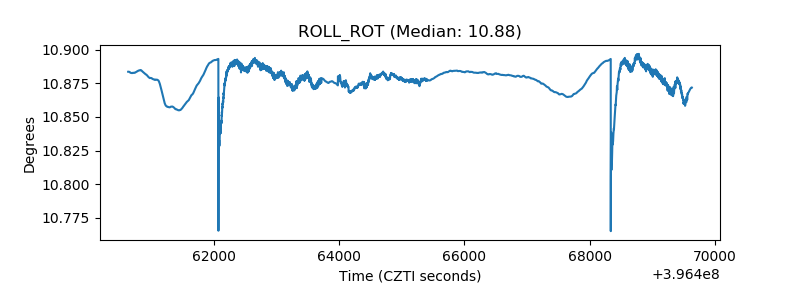 |
| _Roll_DEC | 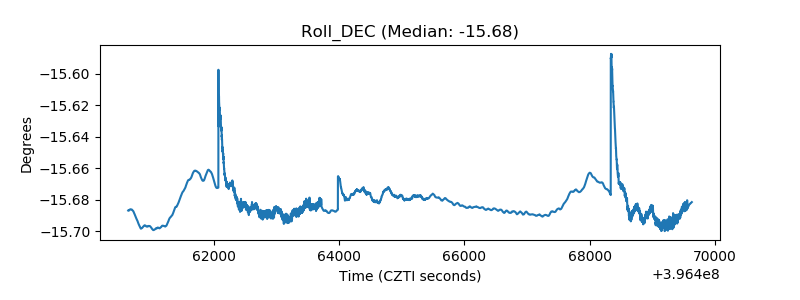 |
| _Roll_RA | 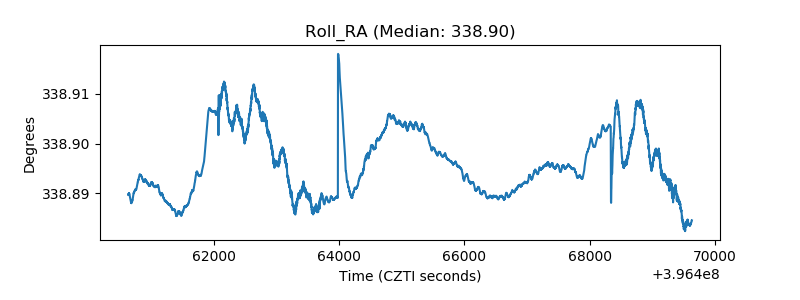 |
| Veto Counter | 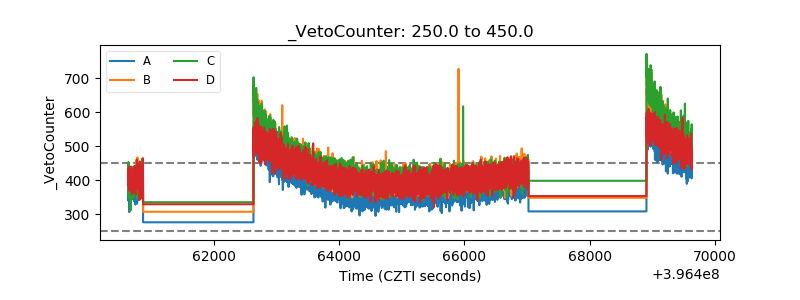 |