| Param | Original file | Final file |
|---|---|---|
| Filename | modeM0/AS1C07_010T01_9000005246_36897cztM0_level2.evt | modeM0/AS1C07_010T01_9000005246_36897cztM0_level2_quad_clean.evt |
| Size (bytes) | 326,255,040 | 73,644,480 |
| Size | 311.1 MB | 70.2 MB |
| Events in quadrant A | 2,907,693 | 621,152 |
| Events in quadrant B | 825,559 | 8,686 |
| Events in quadrant C | 2,921,008 | 622,812 |
| Events in quadrant D | 2,847,622 | 592,062 |
| Mode SS | |||
|---|---|---|---|
| Quadrant | BADHDUFLAG | Total packets | Discarded packets |
| A | 0 | 114 | 0 |
| B | 0 | 114 | 0 |
| C | 0 | 114 | 0 |
| D | 0 | 114 | 0 |
| Mode M9 | |||
|---|---|---|---|
| Quadrant | BADHDUFLAG | Total packets | Discarded packets |
| A | 0 | 38 | 0 |
| B | 0 | 38 | 0 |
| C | 0 | 38 | 0 |
| D | 0 | 38 | 0 |
| Mode M0 | |||
|---|---|---|---|
| Quadrant | BADHDUFLAG | Total packets | Discarded packets |
| A | 0 | 11923 | 3 |
| B | 0 | 5534 | 2 |
| C | 0 | 11728 | 2 |
| D | 0 | 11988 | 2 |
| Quadrant | Total seconds | Saturated seconds | Saturation percentage |
|---|---|---|---|
| A | 5472 | 20 | 0.365497% |
| B | 5472 | 5472 | 100.000000% |
| C | 5472 | 28 | 0.511696% |
| D | 5472 | 29 | 0.529971% |
Noise dominated data is calculated using 1-second bins in cleaned event files. If a bin has >2000 counts, and if more than 50% of those come from <1% of pixels, then it is considered to be noise-dominated and hence unusable.
| Quadrant | # 1 sec bins | Bins with >0 counts | Bins with >2000 counts | High rate bins dominated by noise | Noise dominated (total time) | Noise dominated (detector-on time) | Marked lightcurve |
|---|---|---|---|---|---|---|---|
| A | 9359 | 5474 | 9 | 9 | 0.10% | 0.16% | 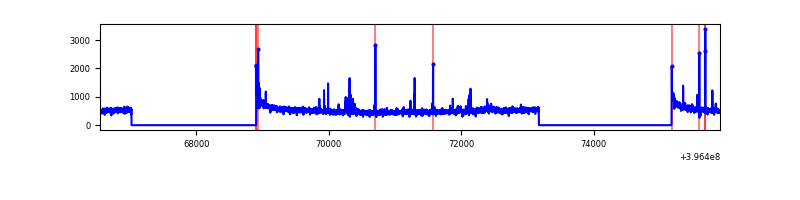 |
| B | 9358 | 5471 | 0 | 0 | 0.00% | 0.00% | 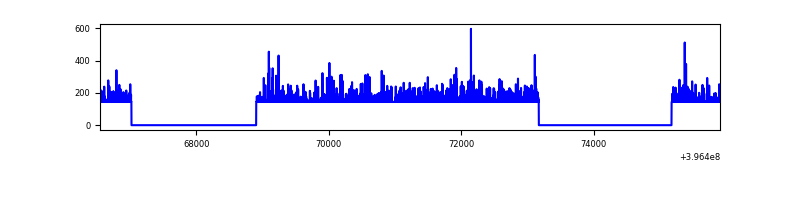 |
| C | 9359 | 5474 | 16 | 16 | 0.17% | 0.29% | 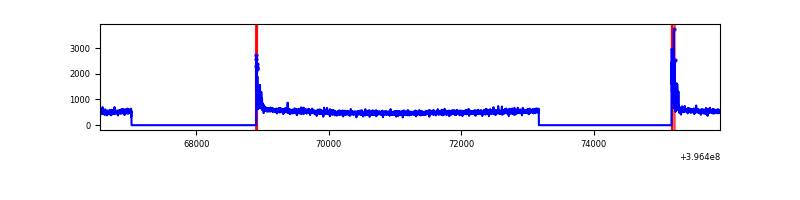 |
| D | 9359 | 5474 | 26 | 26 | 0.28% | 0.47% | 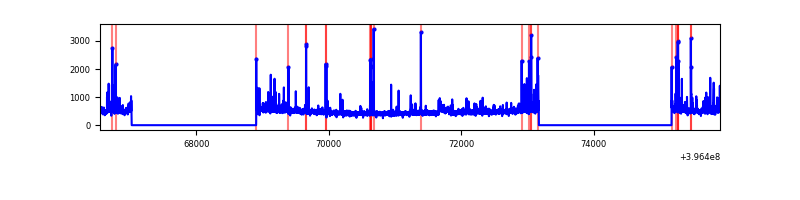 |
Top three noisy pixels from each quadrant. If the there are fewer than three noisy pixels in the level2.evt file, extra rows are filled as -1
| Pixel properties | Quadrant properties | ||||||
|---|---|---|---|---|---|---|---|
| Quadrant | DetID | PixID | Counts | Sigma | Mean | Median | Sigma |
| A | 10 | 83 | 225637 | 1680.05 | 666 | 655 | 133.9 |
| A | 9 | 143 | 78183 | 578.94 | 666 | 655 | 133.9 |
| A | 13 | 6 | 32258 | 236.0 | 666 | 655 | 133.9 |
| B | 12 | 243 | 760668 | 192338.4 | 11 | 11 | 4.0 |
| B | 12 | 144 | 13808 | 3488.69 | 11 | 11 | 4.0 |
| B | 5 | 255 | 1845 | 463.74 | 11 | 11 | 4.0 |
| C | 15 | 214 | 233535 | 1521.26 | 660 | 666 | 153.1 |
| C | 0 | 10 | 109563 | 711.39 | 660 | 666 | 153.1 |
| C | 1 | 157 | 6974 | 41.21 | 660 | 666 | 153.1 |
| D | 12 | 233 | 63570 | 393.48 | 657 | 641 | 159.9 |
| D | 13 | 249 | 63275 | 391.64 | 657 | 641 | 159.9 |
| D | 2 | 153 | 58804 | 363.68 | 657 | 641 | 159.9 |
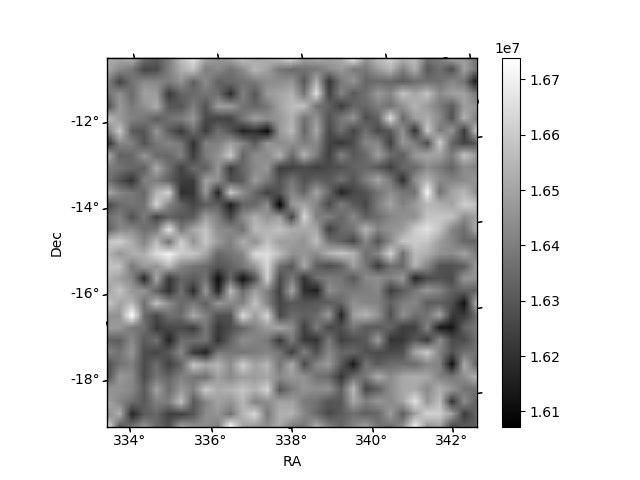
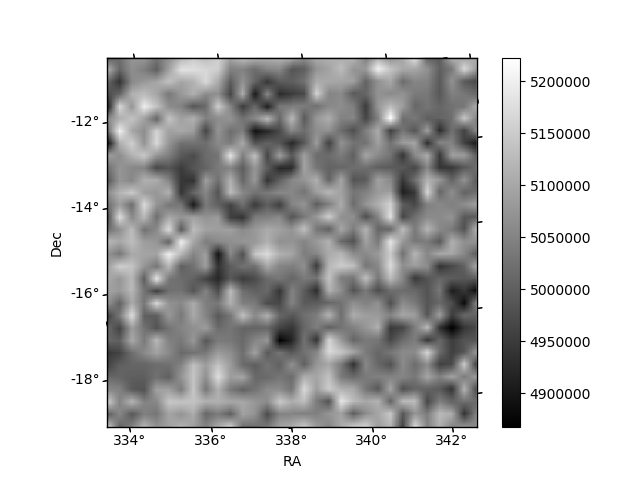
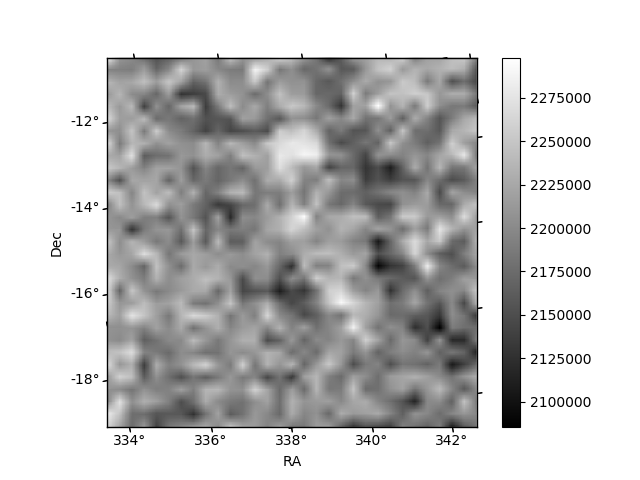
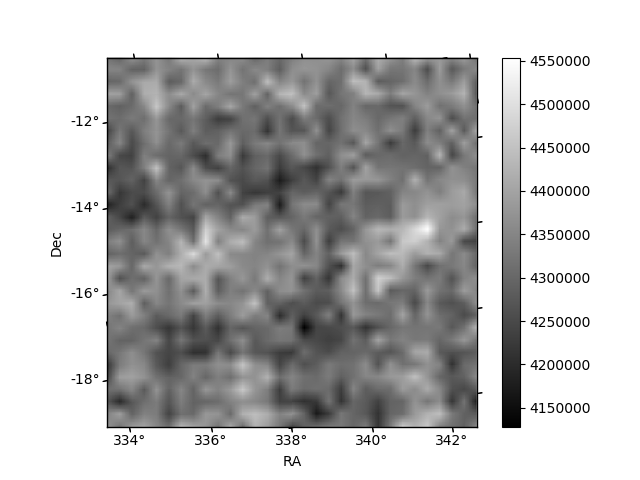
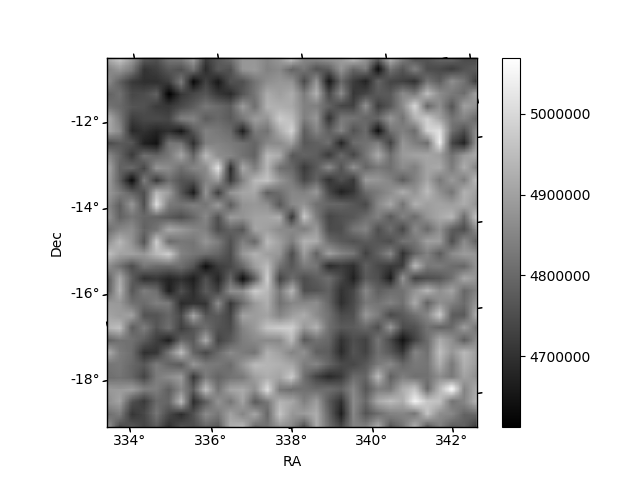
Histogram calculated using DETX and DETY for each event in the final _common_clean file
| Quadrant A | 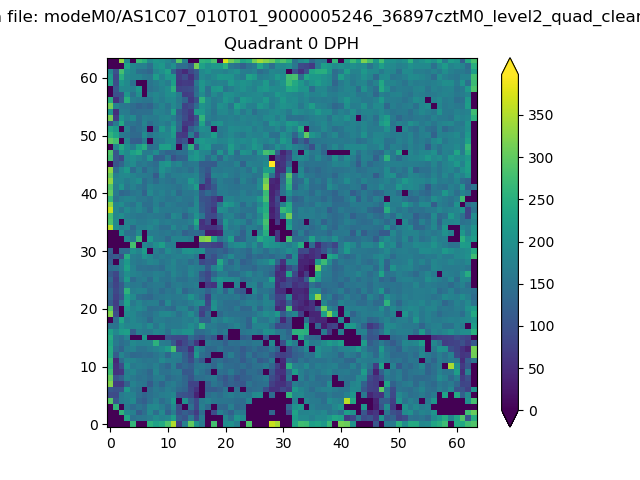 |
 |
Quadrant B |
|---|---|---|---|
| Quadrant D | 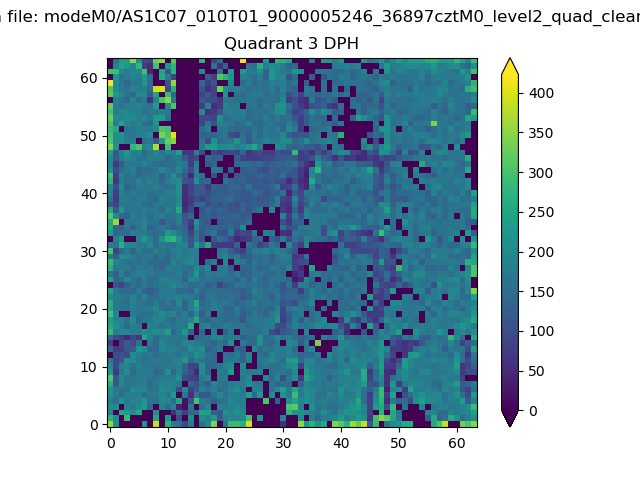 |
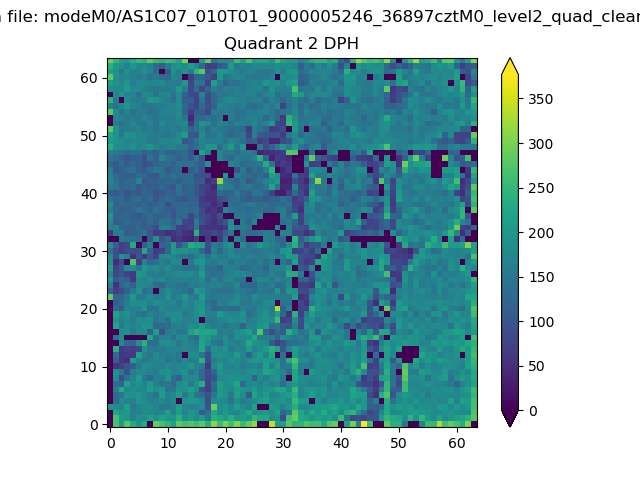 |
Quadrant C |
| Plot type | Count rate plots | Images |
|---|---|---|
| Comparison with Poisson distribution Blue bars denote a histogram of data divided into 1 sec bins. Red curve is a Poisson curve with rate = median count rate of data. |
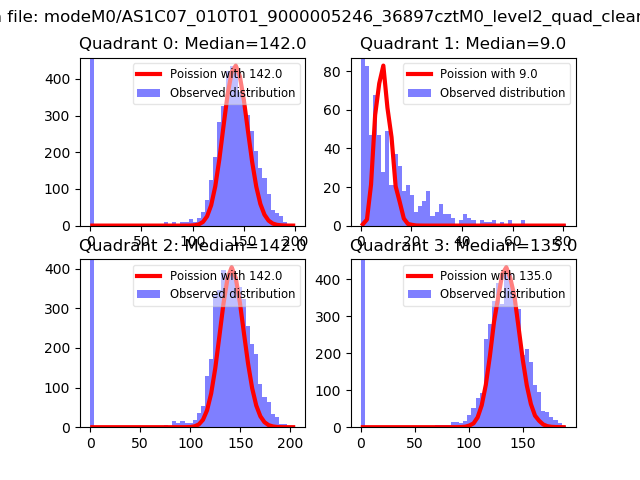 |
 |
| Quadrant-wise count rates Data is divided into 100 sec bins |
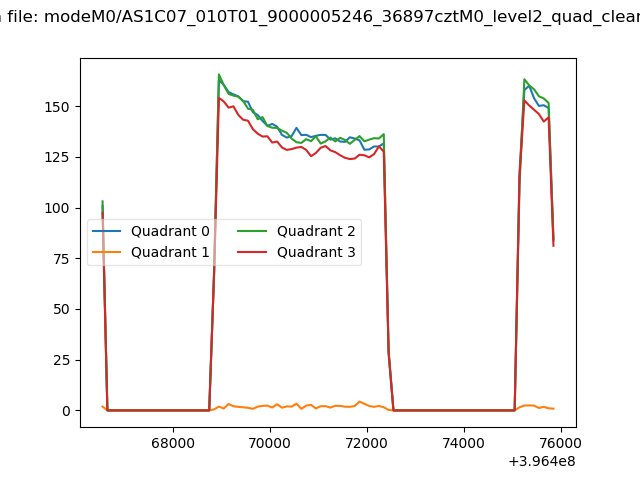 |
|
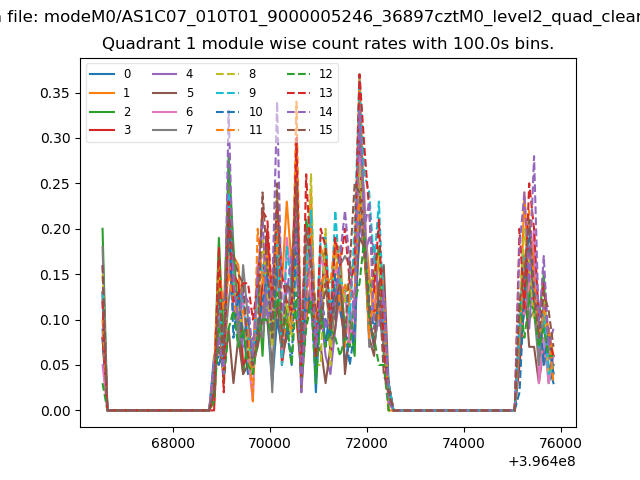
| Module-wise count rates for Quadrant A Data is divided into 100 sec bins |
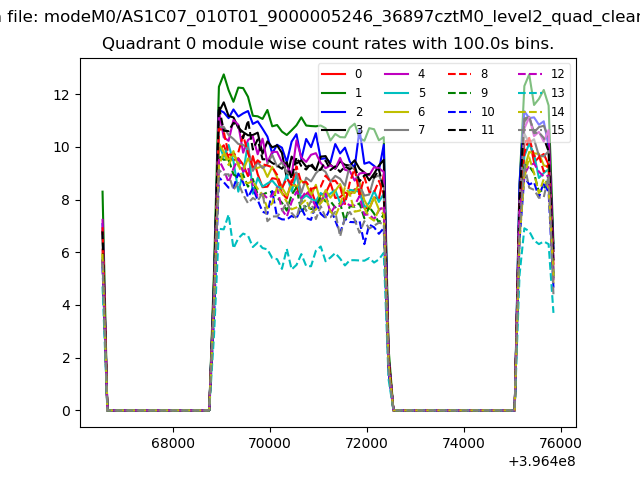 |
 |
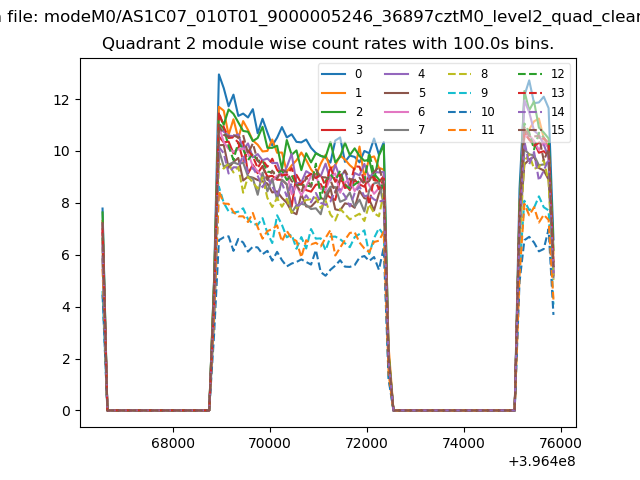
| Module-wise count rates for Quadrant B Data is divided into 100 sec bins |
 |
 |
| Module-wise count rates for Quadrant C Data is divided into 100 sec bins |
 |
 |
| Module-wise count rates for Quadrant D Data is divided into 100 sec bins |
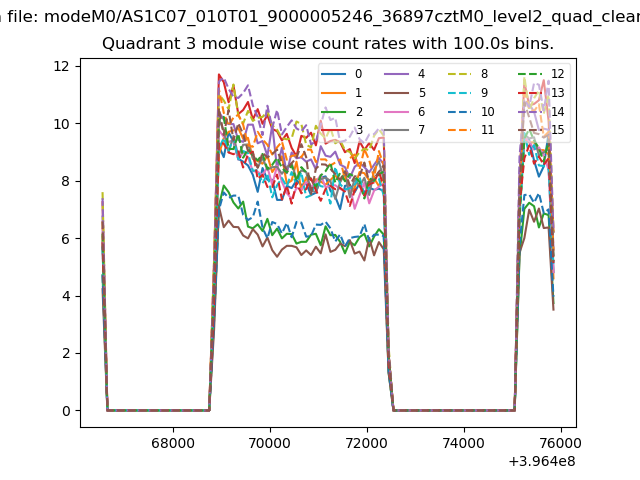 |
 |
| Parameter | Plot |
|---|---|
| CZT HV Monitor | 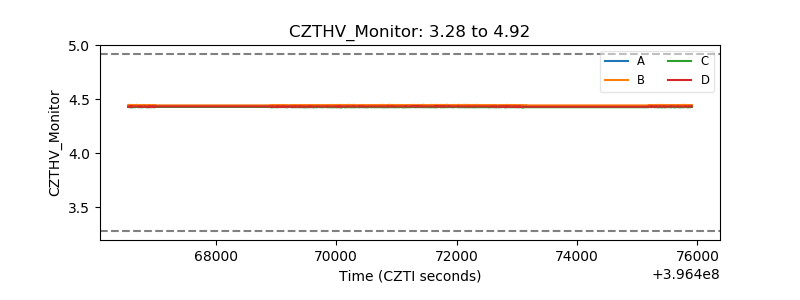 |
| D_VDD | 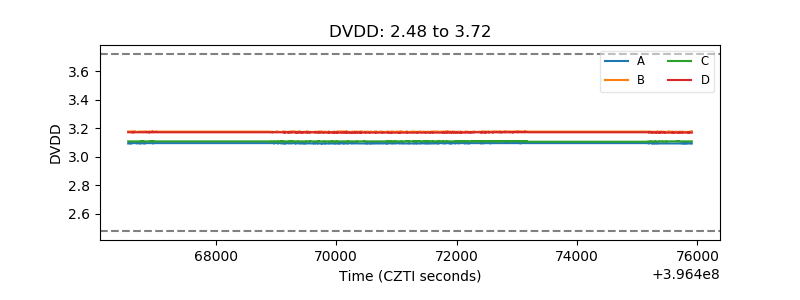 |
| Temperature 1 | 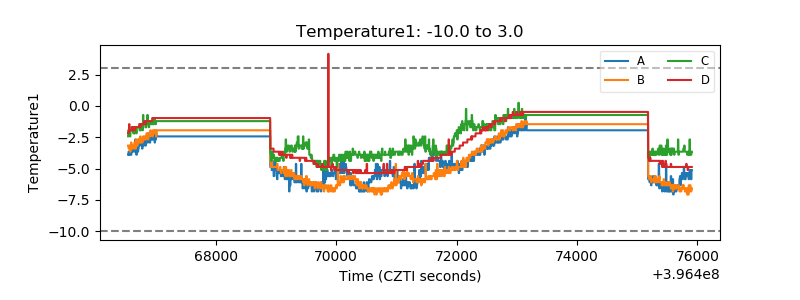 |
| Veto HV Monitor | 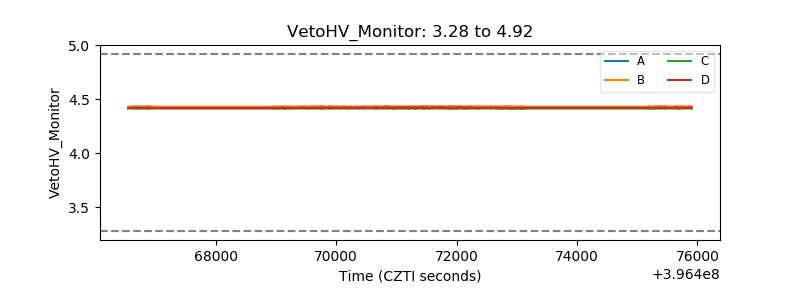 |
| Veto LLD | 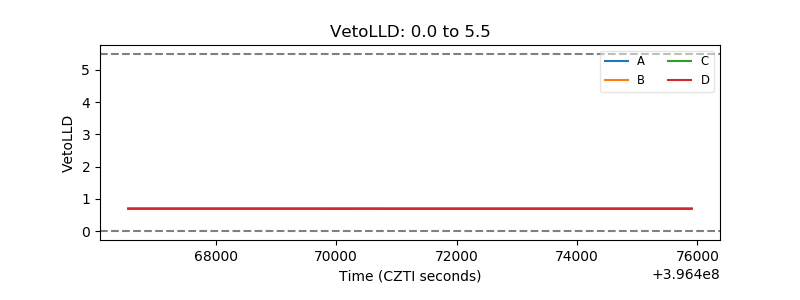 |
| Alpha Counter | 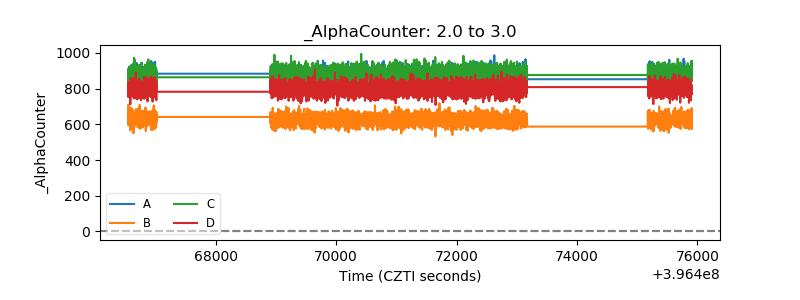 |
| _CPM_Rate | 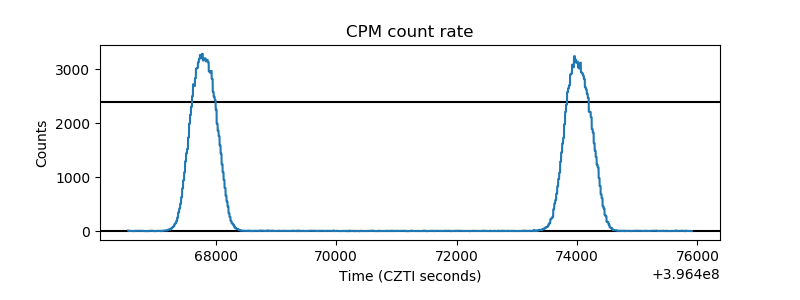 |
| CZT Counter | 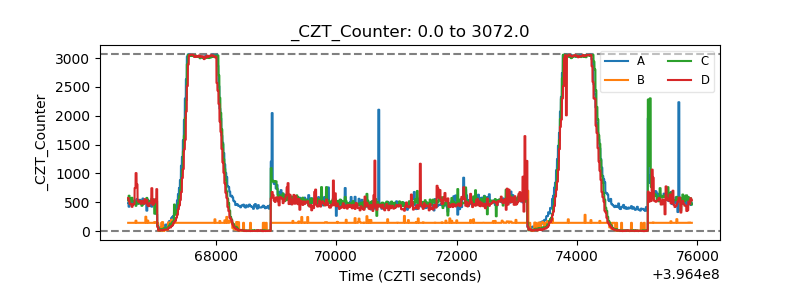 |
| +2.5 Volts monitor |  |
| +5 Volts monitor |  |
| _ROLL_ROT | 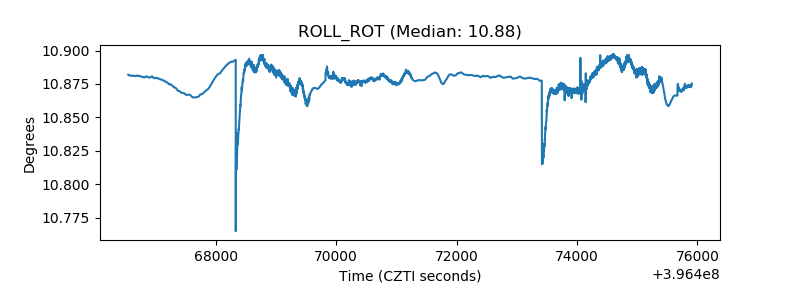 |
| _Roll_DEC | 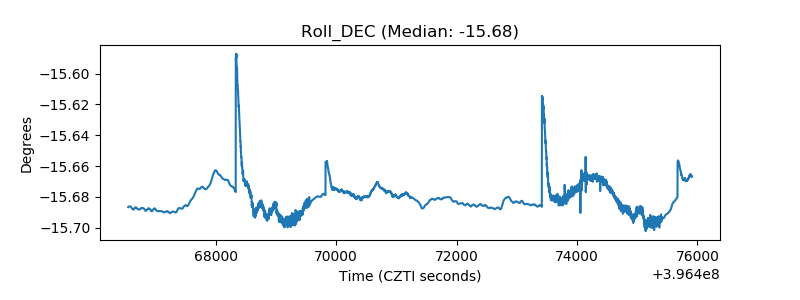 |
| _Roll_RA | 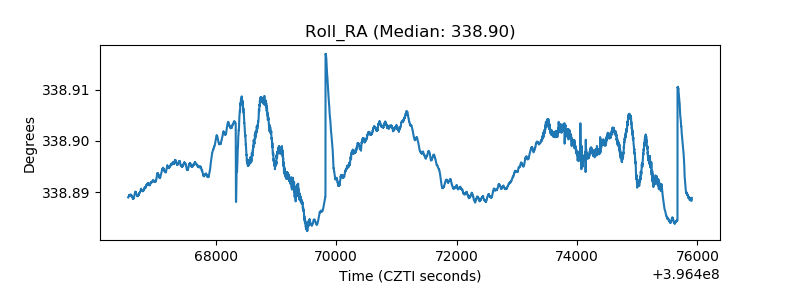 |
| Veto Counter | 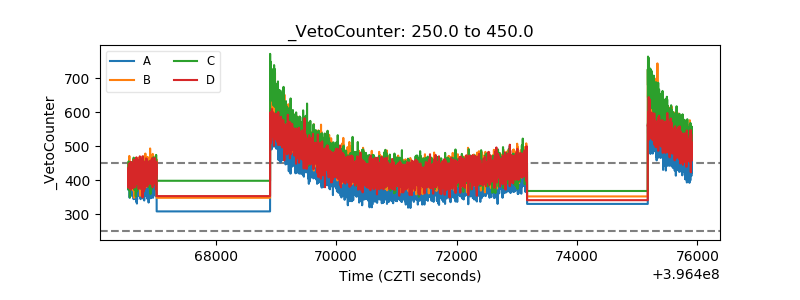 |