| Param | Original file | Final file |
|---|---|---|
| Filename | modeM0/AS1C07_010T01_9000005246_36898cztM0_level2.evt | modeM0/AS1C07_010T01_9000005246_36898cztM0_level2_quad_clean.evt |
| Size (bytes) | 363,214,080 | 65,145,600 |
| Size | 346.4 MB | 62.1 MB |
| Events in quadrant A | 3,001,814 | 535,955 |
| Events in quadrant B | 835,496 | 7,897 |
| Events in quadrant C | 2,965,674 | 543,546 |
| Events in quadrant D | 3,814,902 | 496,182 |
| Mode SS | |||
|---|---|---|---|
| Quadrant | BADHDUFLAG | Total packets | Discarded packets |
| A | 0 | 114 | 0 |
| B | 0 | 114 | 0 |
| C | 0 | 114 | 0 |
| D | 0 | 114 | 0 |
| Mode M9 | |||
|---|---|---|---|
| Quadrant | BADHDUFLAG | Total packets | Discarded packets |
| A | 0 | 41 | 0 |
| B | 0 | 41 | 0 |
| C | 0 | 41 | 0 |
| D | 0 | 41 | 0 |
| Mode M0 | |||
|---|---|---|---|
| Quadrant | BADHDUFLAG | Total packets | Discarded packets |
| A | 0 | 12279 | 3 |
| B | 0 | 5588 | 2 |
| C | 0 | 11849 | 2 |
| D | 0 | 14885 | 2 |
| Quadrant | Total seconds | Saturated seconds | Saturation percentage |
|---|---|---|---|
| A | 5532 | 55 | 0.994215% |
| B | 5532 | 5532 | 100.000000% |
| C | 5532 | 30 | 0.542299% |
| D | 5532 | 313 | 5.657990% |
Noise dominated data is calculated using 1-second bins in cleaned event files. If a bin has >2000 counts, and if more than 50% of those come from <1% of pixels, then it is considered to be noise-dominated and hence unusable.
| Quadrant | # 1 sec bins | Bins with >0 counts | Bins with >2000 counts | High rate bins dominated by noise | Noise dominated (total time) | Noise dominated (detector-on time) | Marked lightcurve |
|---|---|---|---|---|---|---|---|
| A | 9629 | 5534 | 39 | 39 | 0.41% | 0.70% | 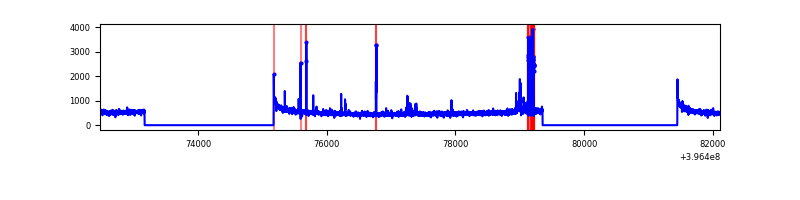 |
| B | 9628 | 5531 | 0 | 0 | 0.00% | 0.00% | 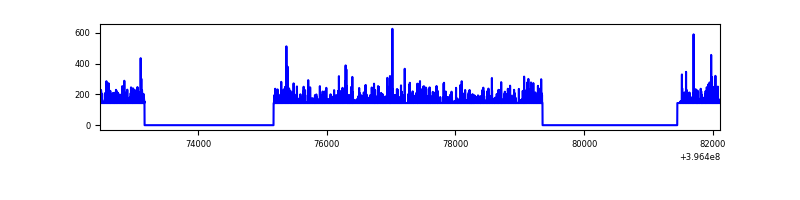 |
| C | 9629 | 5534 | 20 | 20 | 0.21% | 0.36% | 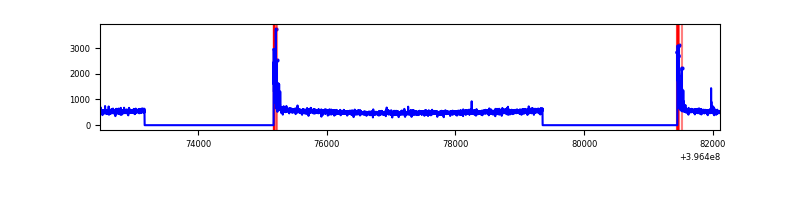 |
| D | 9629 | 5534 | 304 | 304 | 3.16% | 5.49% | 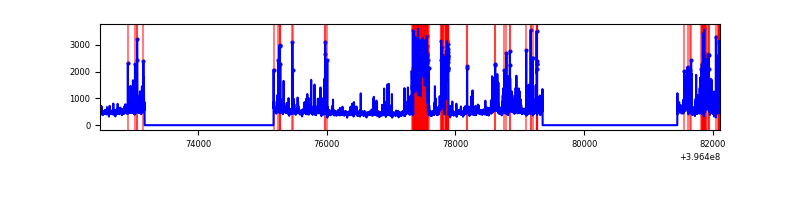 |
Top three noisy pixels from each quadrant. If the there are fewer than three noisy pixels in the level2.evt file, extra rows are filled as -1
| Pixel properties | Quadrant properties | ||||||
|---|---|---|---|---|---|---|---|
| Quadrant | DetID | PixID | Counts | Sigma | Mean | Median | Sigma |
| A | 10 | 83 | 228119 | 1708.91 | 667 | 654 | 133.1 |
| A | 15 | 174 | 137459 | 1027.79 | 667 | 654 | 133.1 |
| A | 9 | 143 | 50216 | 372.35 | 667 | 654 | 133.1 |
| B | 12 | 243 | 768715 | 194854.19 | 11 | 11 | 3.9 |
| B | 12 | 144 | 14346 | 3633.69 | 11 | 11 | 3.9 |
| B | 5 | 255 | 1116 | 280.1 | 11 | 11 | 3.9 |
| C | 15 | 214 | 239852 | 1554.77 | 666 | 672 | 153.8 |
| C | 0 | 10 | 130281 | 842.51 | 666 | 672 | 153.8 |
| C | 13 | 61 | 4559 | 25.27 | 666 | 672 | 153.8 |
| D | 10 | 253 | 662453 | 4231.83 | 648 | 631 | 156.4 |
| D | 13 | 171 | 228872 | 1459.42 | 648 | 631 | 156.4 |
| D | 2 | 250 | 103821 | 659.82 | 648 | 631 | 156.4 |
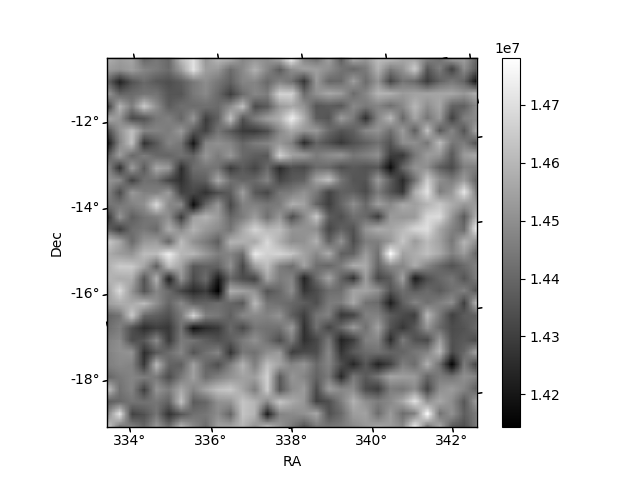
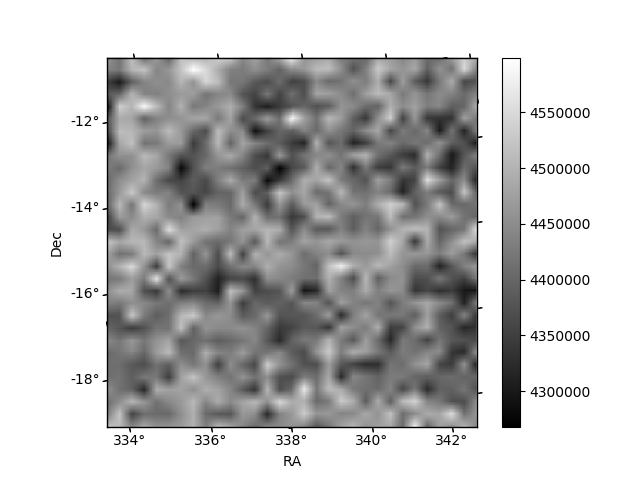
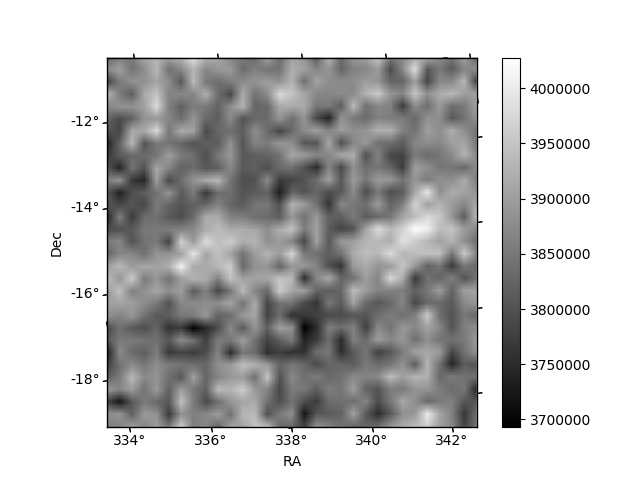
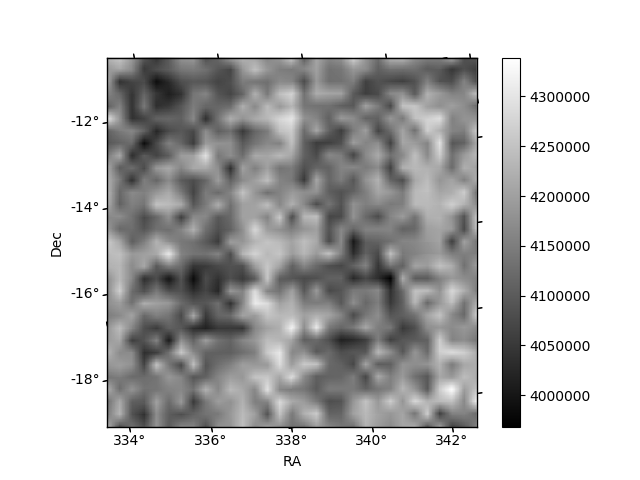
Histogram calculated using DETX and DETY for each event in the final _common_clean file
| Quadrant A | 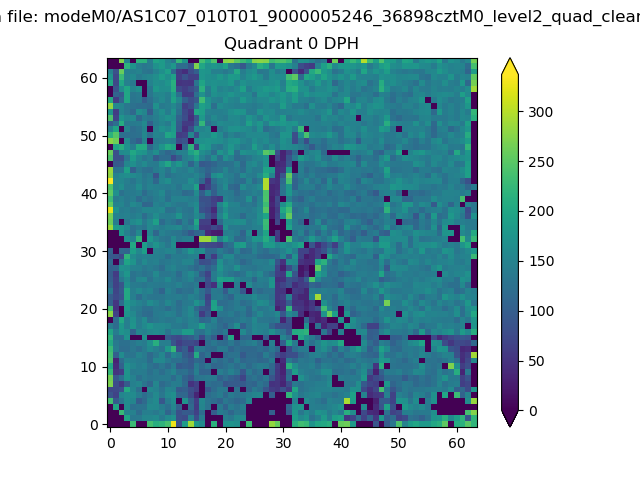 |
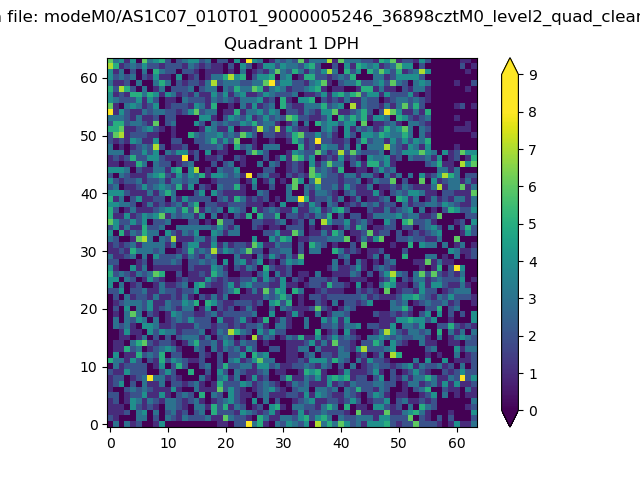 |
Quadrant B |
|---|---|---|---|
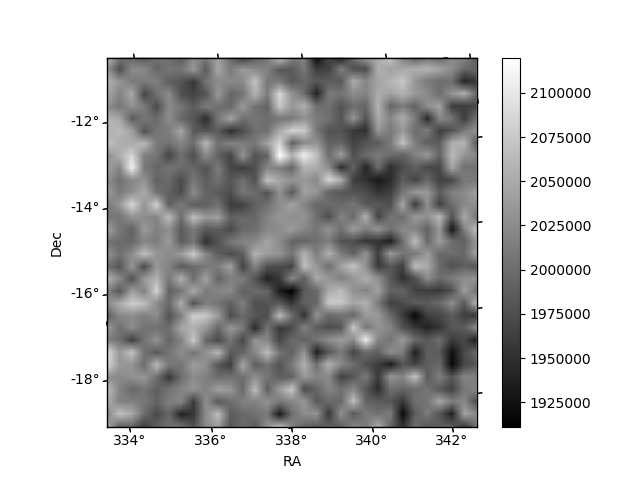
| Quadrant D | 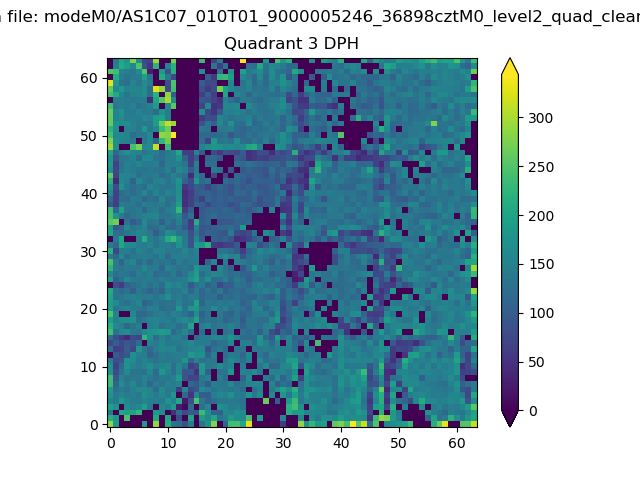 |
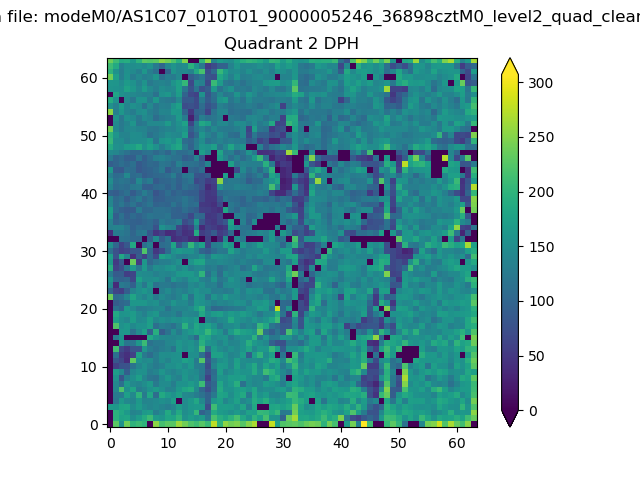 |
Quadrant C |
| Plot type | Count rate plots | Images |
|---|---|---|
| Comparison with Poisson distribution Blue bars denote a histogram of data divided into 1 sec bins. Red curve is a Poisson curve with rate = median count rate of data. |
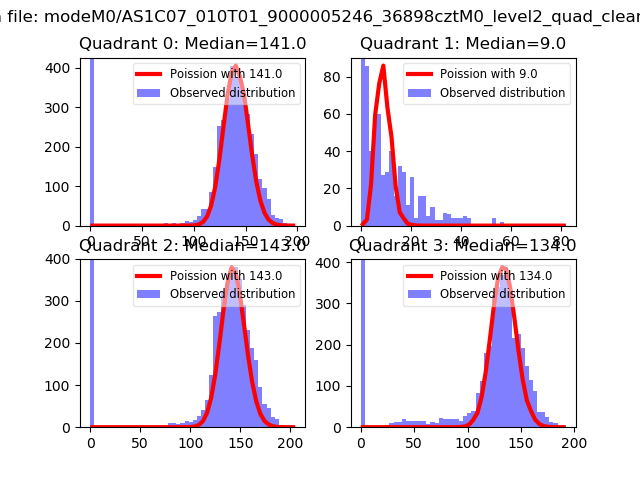 |
 |
| Quadrant-wise count rates Data is divided into 100 sec bins |
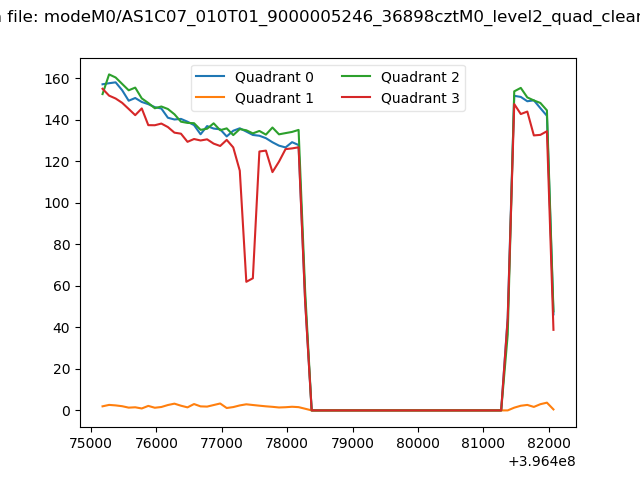 |
|
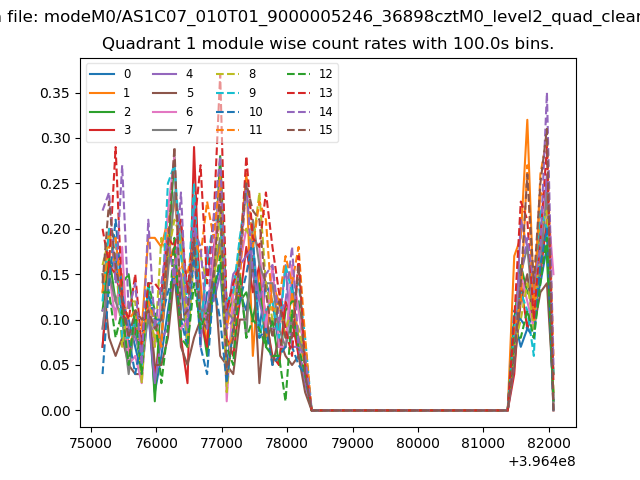
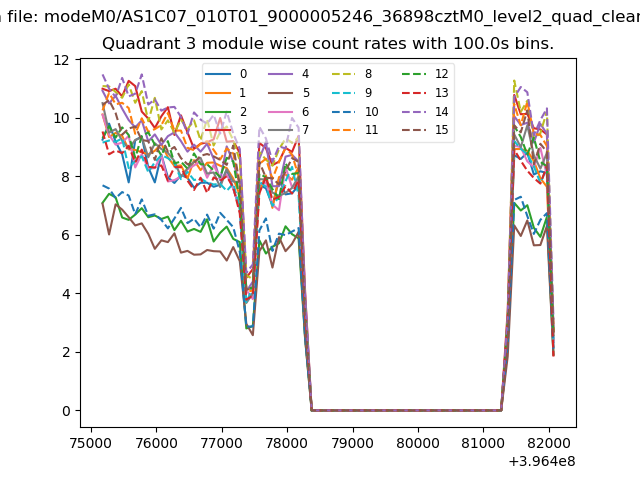
| Module-wise count rates for Quadrant A Data is divided into 100 sec bins |
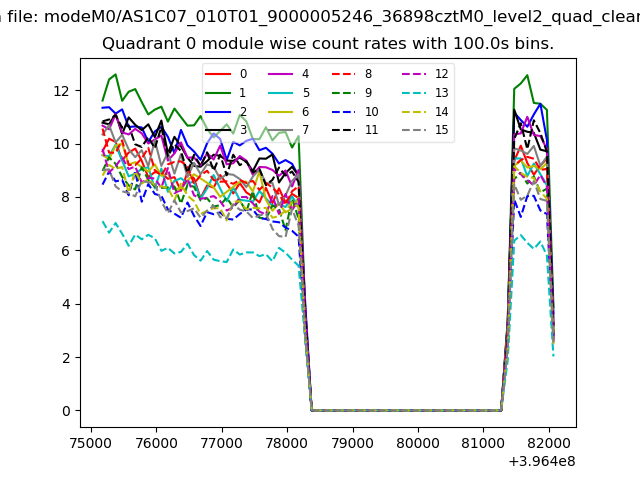 |
 |
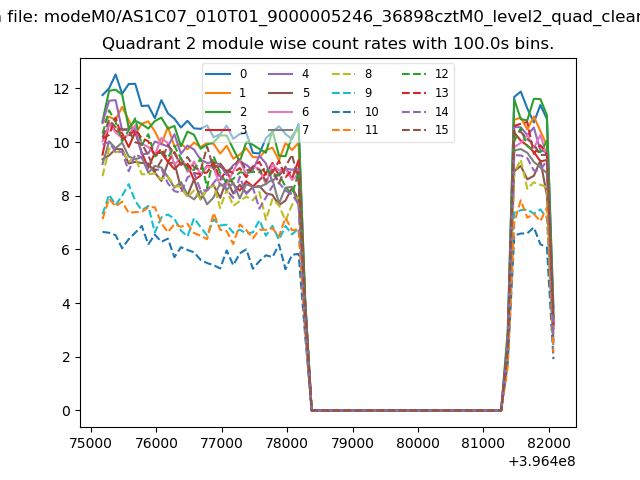
| Module-wise count rates for Quadrant B Data is divided into 100 sec bins |
 |
 |
| Module-wise count rates for Quadrant C Data is divided into 100 sec bins |
 |
 |
| Module-wise count rates for Quadrant D Data is divided into 100 sec bins |
 |
 |
| Parameter | Plot |
|---|---|
| CZT HV Monitor | 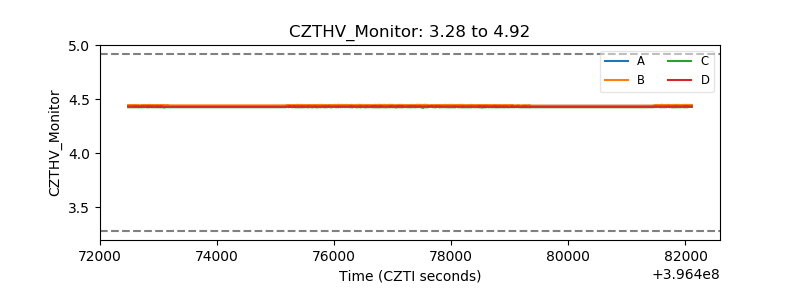 |
| D_VDD | 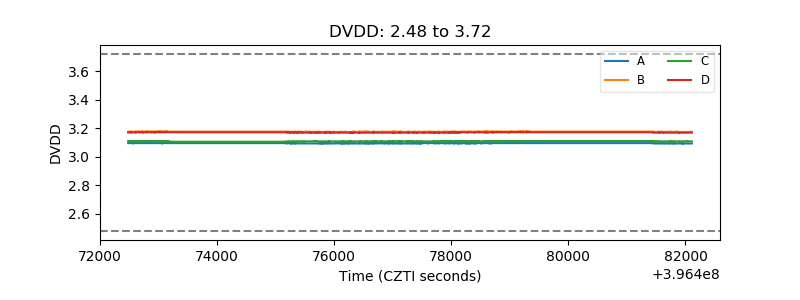 |
| Temperature 1 | 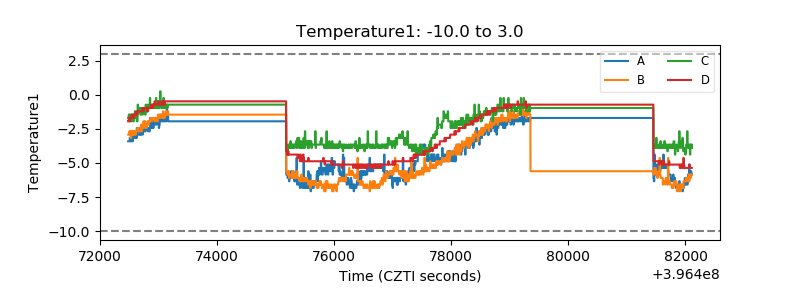 |
| Veto HV Monitor | 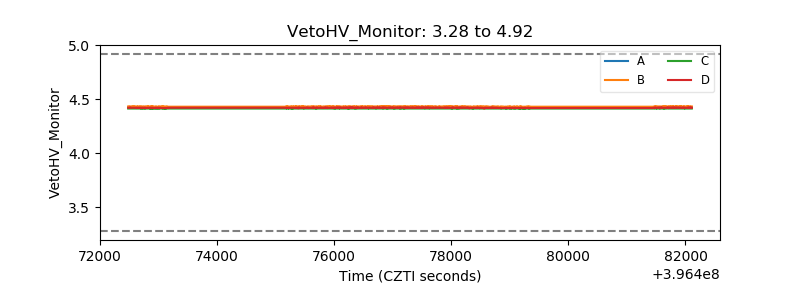 |
| Veto LLD | 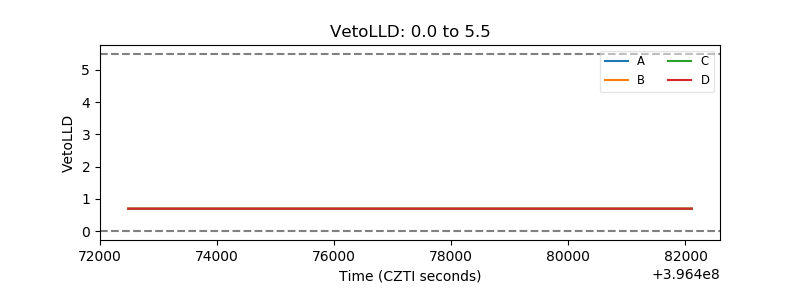 |
| Alpha Counter | 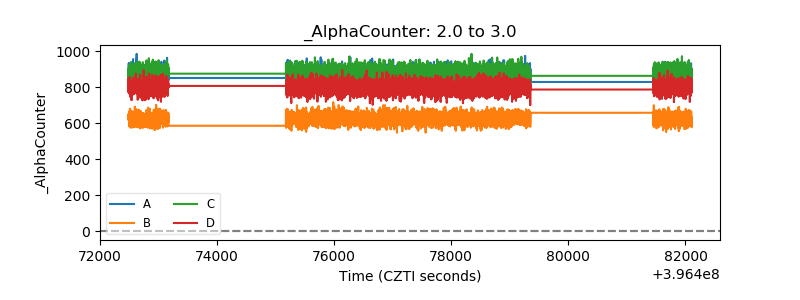 |
| _CPM_Rate | 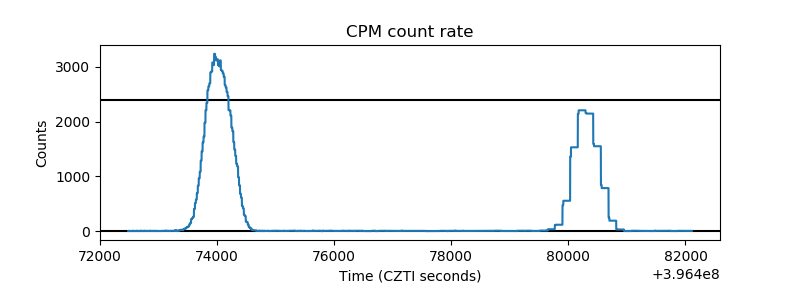 |
| CZT Counter | 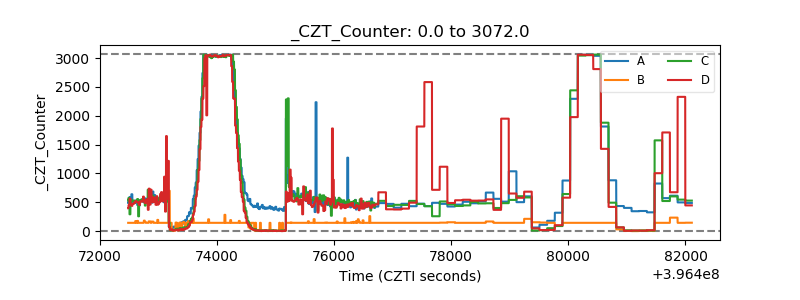 |
| +2.5 Volts monitor |  |
| +5 Volts monitor | 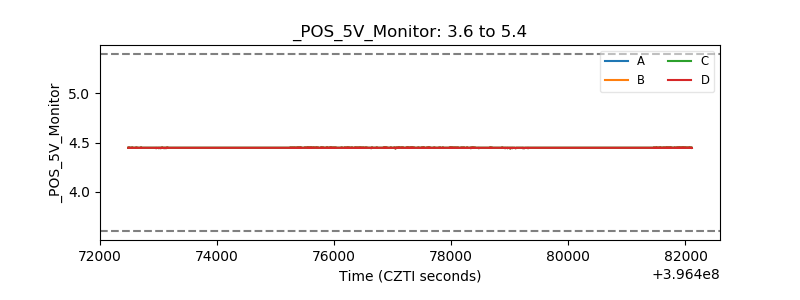 |
| _ROLL_ROT | 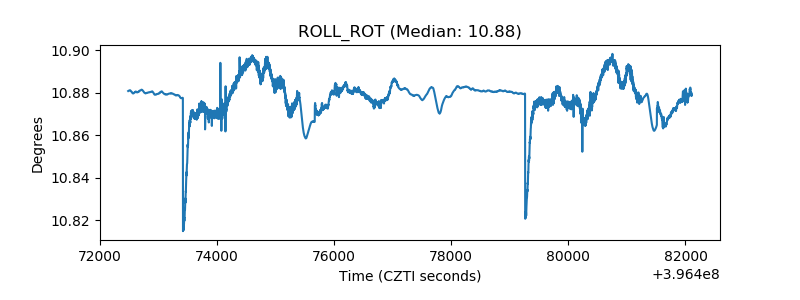 |
| _Roll_DEC | 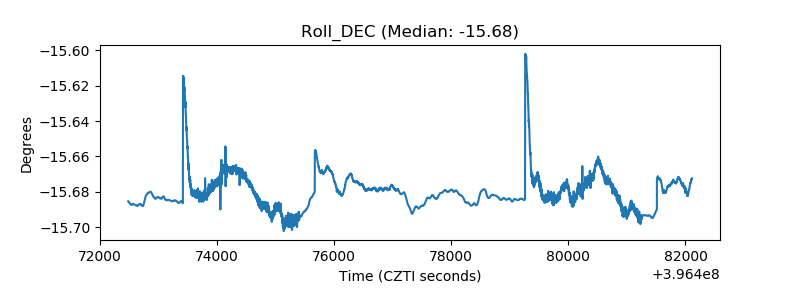 |
| _Roll_RA | 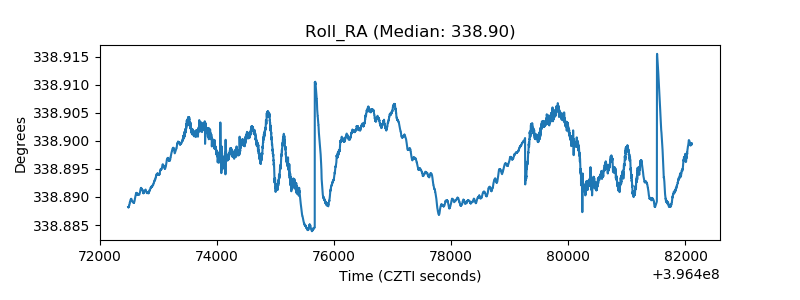 |
| Veto Counter | 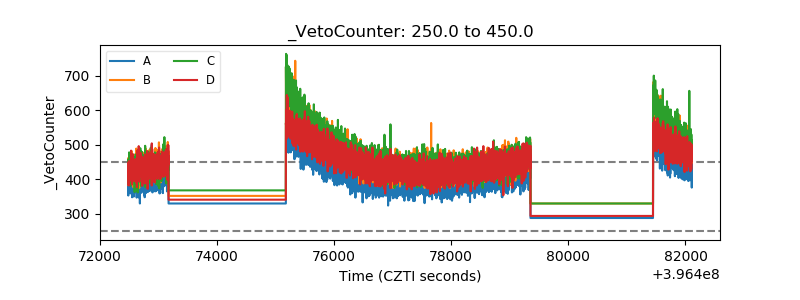 |