| Param | Original file | Final file |
|---|---|---|
| Filename | modeM0/AS1C07_010T01_9000005246_36901cztM0_level2.evt | modeM0/AS1C07_010T01_9000005246_36901cztM0_level2_quad_clean.evt |
| Size (bytes) | 336,879,360 | 48,358,080 |
| Size | 321.3 MB | 46.1 MB |
| Events in quadrant A | 2,646,630 | 368,518 |
| Events in quadrant B | 824,994 | 6,267 |
| Events in quadrant C | 2,670,574 | 364,198 |
| Events in quadrant D | 3,684,326 | 342,828 |
| Mode SS | |||
|---|---|---|---|
| Quadrant | BADHDUFLAG | Total packets | Discarded packets |
| A | 0 | 118 | 4 |
| B | 0 | 118 | 2 |
| C | 0 | 118 | 2 |
| D | 0 | 117 | 3 |
| Mode M9 | |||
|---|---|---|---|
| Quadrant | BADHDUFLAG | Total packets | Discarded packets |
| A | 0 | 38 | 0 |
| B | 0 | 38 | 0 |
| C | 0 | 38 | 0 |
| D | 0 | 38 | 0 |
| Mode M0 | |||
|---|---|---|---|
| Quadrant | BADHDUFLAG | Total packets | Discarded packets |
| A | 0 | 11545 | 313 |
| B | 0 | 5623 | 106 |
| C | 0 | 11532 | 370 |
| D | 0 | 14995 | 443 |
| Quadrant | Total seconds | Saturated seconds | Saturation percentage |
|---|---|---|---|
| A | 5423 | 10 | 0.184400% |
| B | 5481 | 5481 | 100.000000% |
| C | 5394 | 14 | 0.259548% |
| D | 5410 | 261 | 4.824399% |
Noise dominated data is calculated using 1-second bins in cleaned event files. If a bin has >2000 counts, and if more than 50% of those come from <1% of pixels, then it is considered to be noise-dominated and hence unusable.
| Quadrant | # 1 sec bins | Bins with >0 counts | Bins with >2000 counts | High rate bins dominated by noise | Noise dominated (total time) | Noise dominated (detector-on time) | Marked lightcurve |
|---|---|---|---|---|---|---|---|
| A | 9398 | 5471 | 2 | 2 | 0.02% | 0.04% | 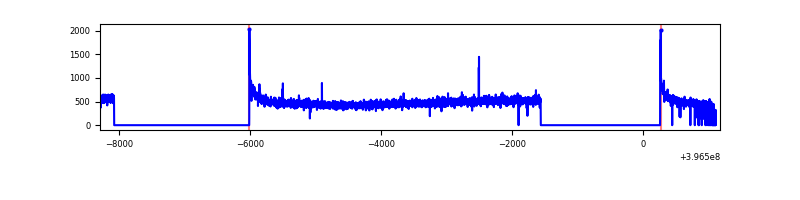 |
| B | 9461 | 5481 | 0 | 0 | 0.00% | 0.00% | 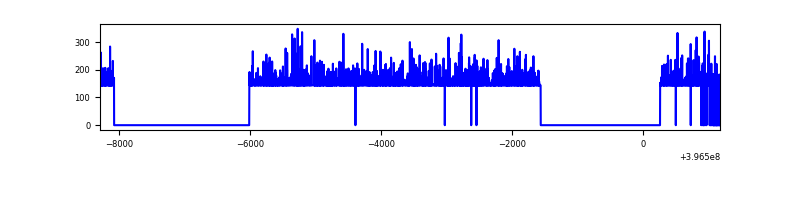 |
| C | 9391 | 5454 | 12 | 12 | 0.13% | 0.22% | 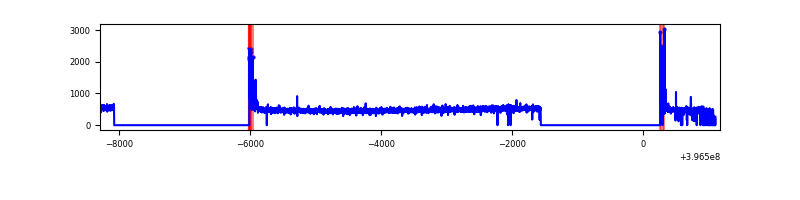 |
| D | 9455 | 5469 | 226 | 226 | 2.39% | 4.13% | 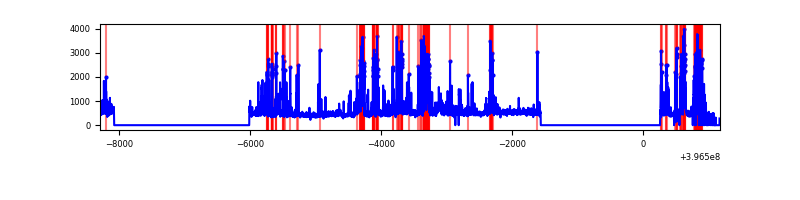 |
Top three noisy pixels from each quadrant. If the there are fewer than three noisy pixels in the level2.evt file, extra rows are filled as -1
| Pixel properties | Quadrant properties | ||||||
|---|---|---|---|---|---|---|---|
| Quadrant | DetID | PixID | Counts | Sigma | Mean | Median | Sigma |
| A | 10 | 83 | 225368 | 1785.72 | 621 | 608 | 125.9 |
| A | 13 | 254 | 8529 | 62.93 | 621 | 608 | 125.9 |
| A | 9 | 143 | 8506 | 62.75 | 621 | 608 | 125.9 |
| B | 12 | 243 | 760498 | 183963.73 | 11 | 11 | 4.1 |
| B | 12 | 144 | 14585 | 3525.49 | 11 | 11 | 4.1 |
| B | 0 | 213 | 823 | 196.42 | 11 | 11 | 4.1 |
| C | 15 | 214 | 230862 | 1645.1 | 601 | 604 | 140.0 |
| C | 0 | 10 | 89751 | 636.92 | 601 | 604 | 140.0 |
| C | 15 | 159 | 6299 | 40.69 | 601 | 604 | 140.0 |
| D | 13 | 249 | 716957 | 4859.24 | 596 | 579 | 147.4 |
| D | 12 | 233 | 232910 | 1575.92 | 596 | 579 | 147.4 |
| D | 2 | 153 | 115656 | 780.57 | 596 | 579 | 147.4 |
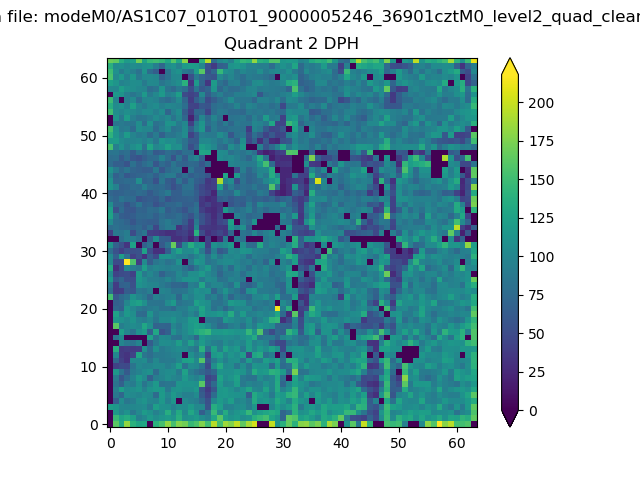
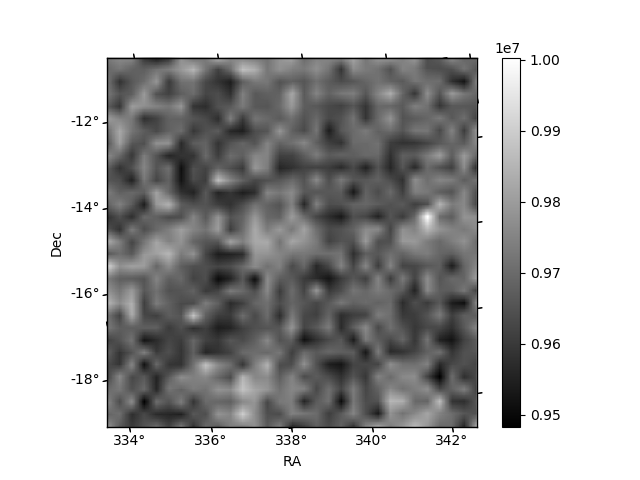
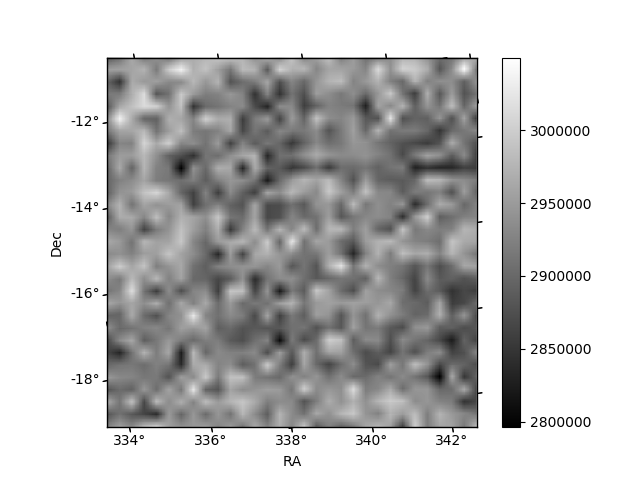
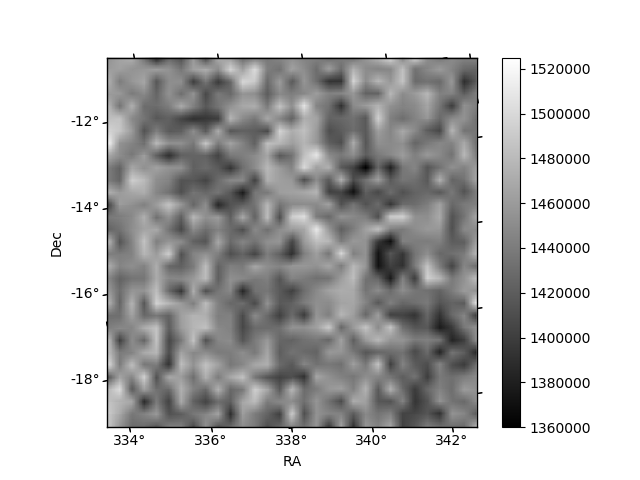
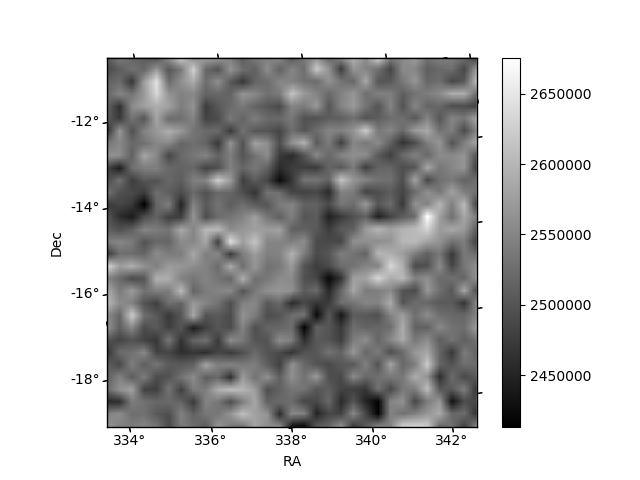
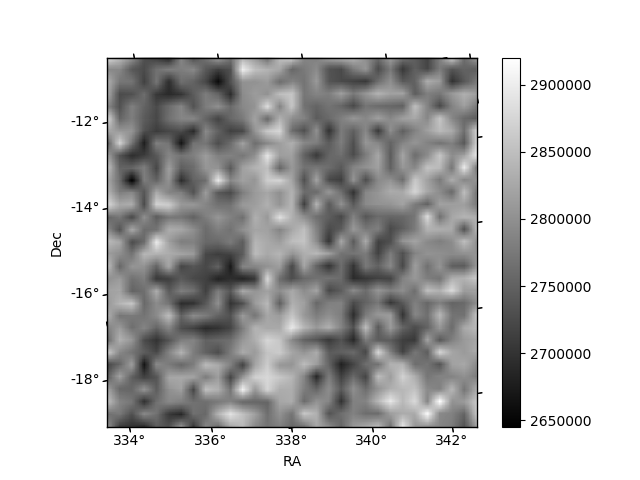
Histogram calculated using DETX and DETY for each event in the final _common_clean file
| Quadrant A | 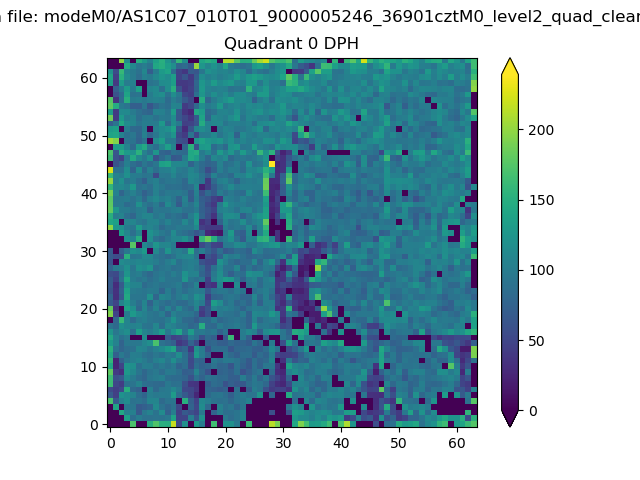 |
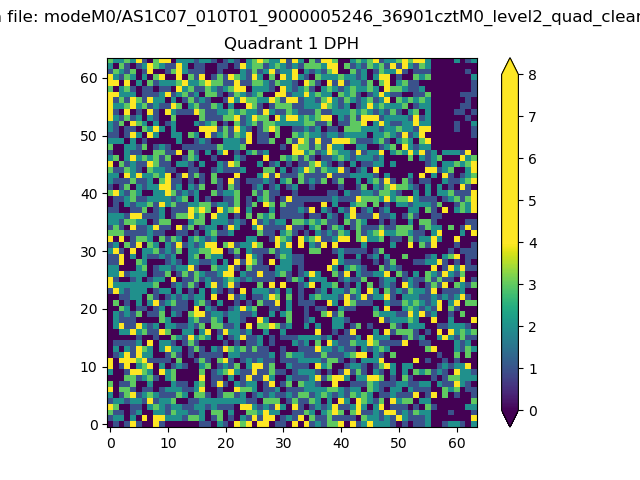 |
Quadrant B |
|---|---|---|---|
| Quadrant D | 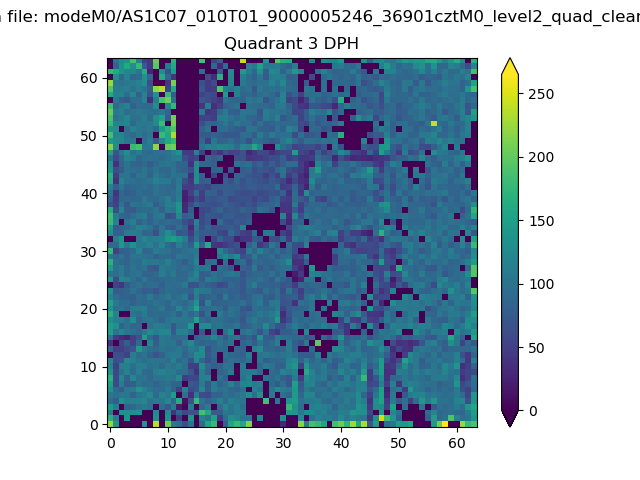 |
 |
Quadrant C |
| Plot type | Count rate plots | Images |
|---|---|---|
| Comparison with Poisson distribution Blue bars denote a histogram of data divided into 1 sec bins. Red curve is a Poisson curve with rate = median count rate of data. |
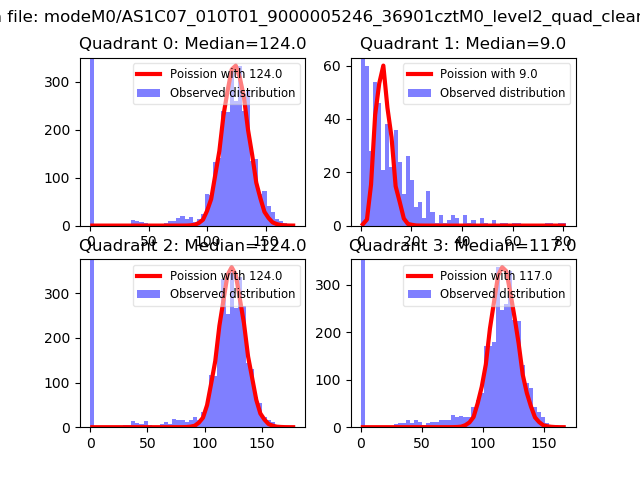 |
 |
| Quadrant-wise count rates Data is divided into 100 sec bins |
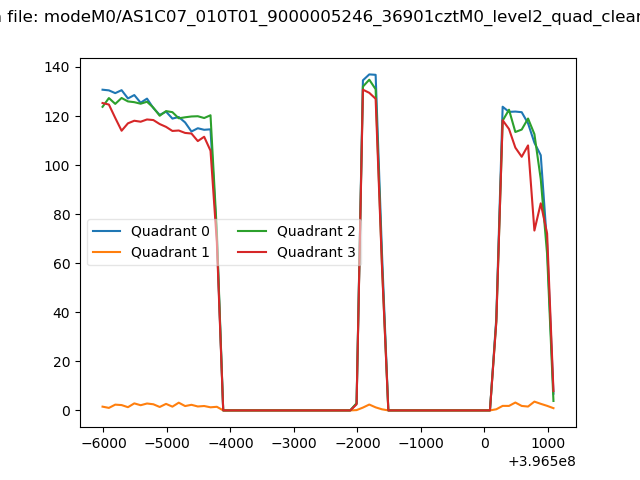 |
|
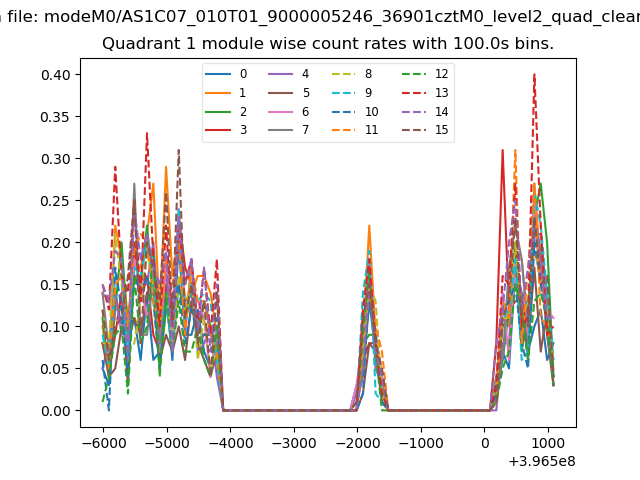
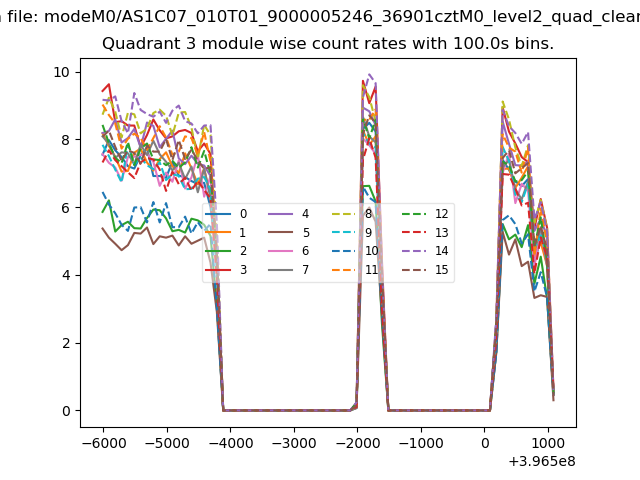
| Module-wise count rates for Quadrant A Data is divided into 100 sec bins |
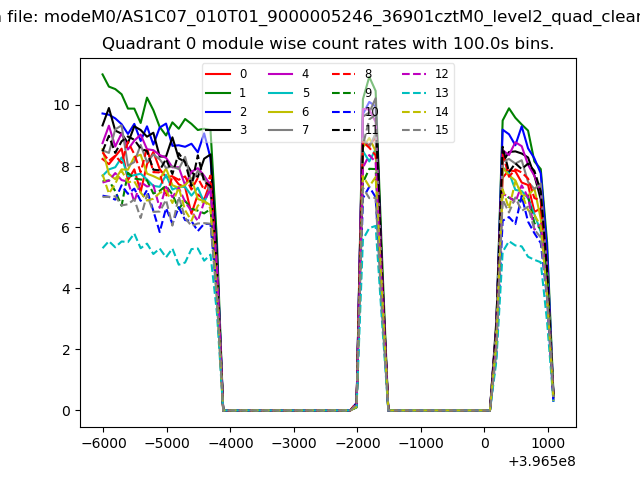 |
 |
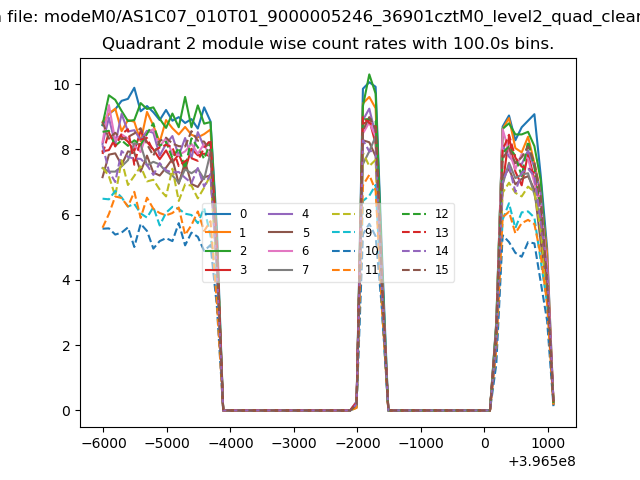
| Module-wise count rates for Quadrant B Data is divided into 100 sec bins |
 |
 |
| Module-wise count rates for Quadrant C Data is divided into 100 sec bins |
 |
 |
| Module-wise count rates for Quadrant D Data is divided into 100 sec bins |
 |
 |
| Parameter | Plot |
|---|---|
| CZT HV Monitor | 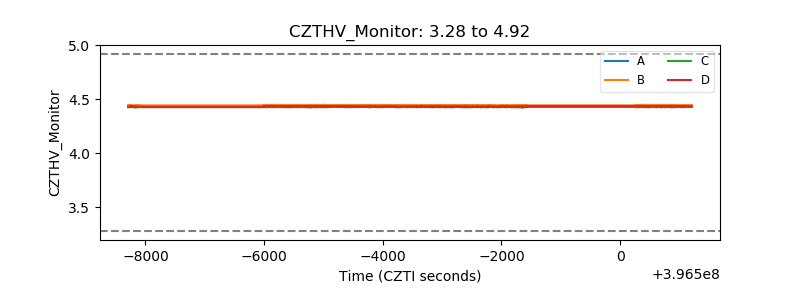 |
| D_VDD | 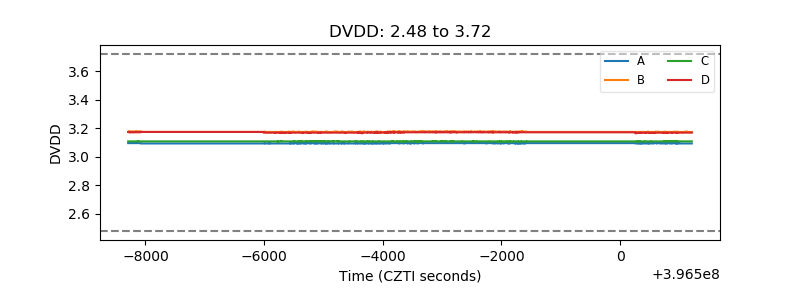 |
| Temperature 1 | 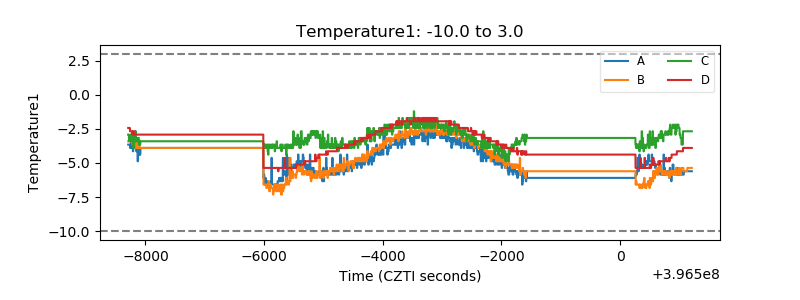 |
| Veto HV Monitor | 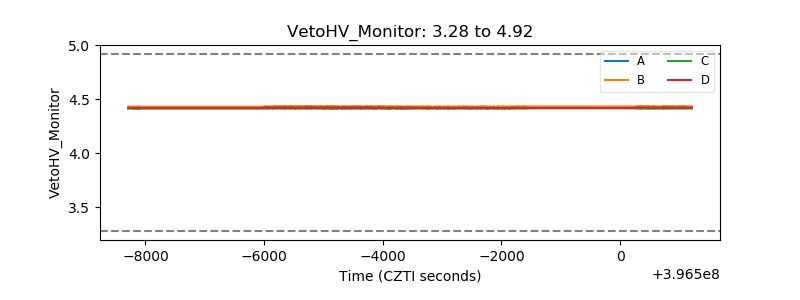 |
| Veto LLD |  |
| Alpha Counter | 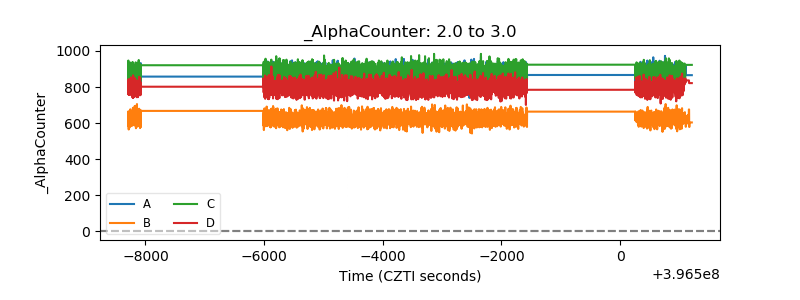 |
| _CPM_Rate | 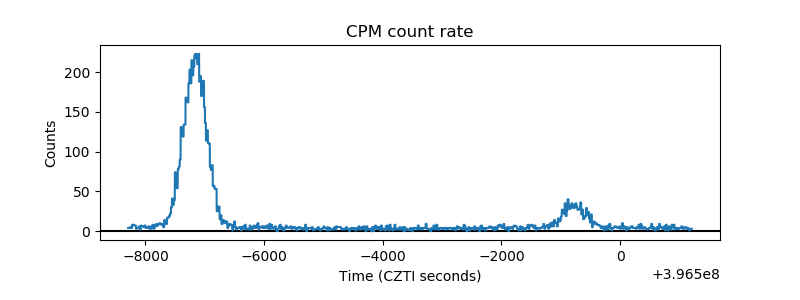 |
| CZT Counter | 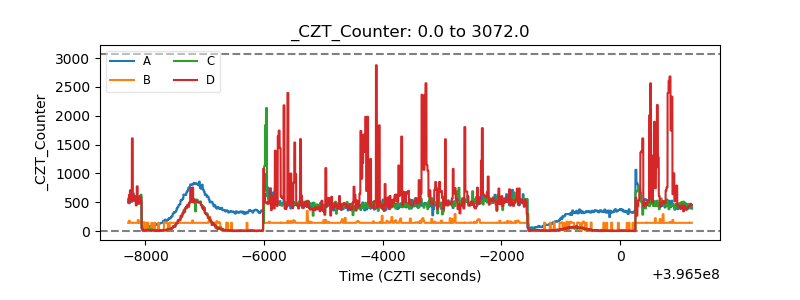 |
| +2.5 Volts monitor |  |
| +5 Volts monitor |  |
| _ROLL_ROT | 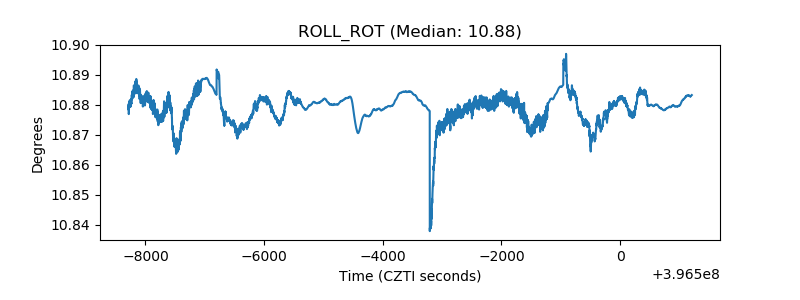 |
| _Roll_DEC | 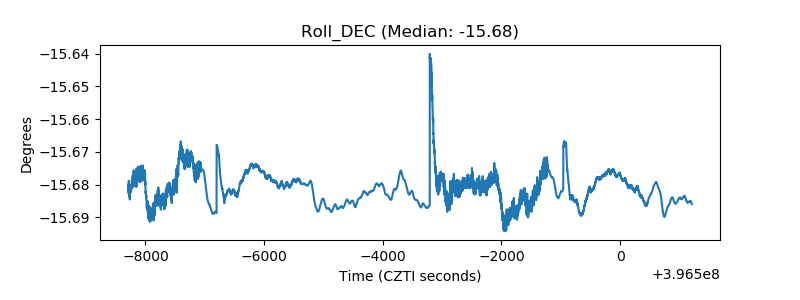 |
| _Roll_RA | 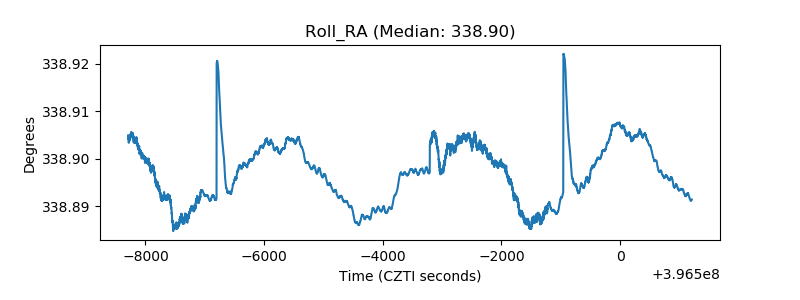 |
| Veto Counter | 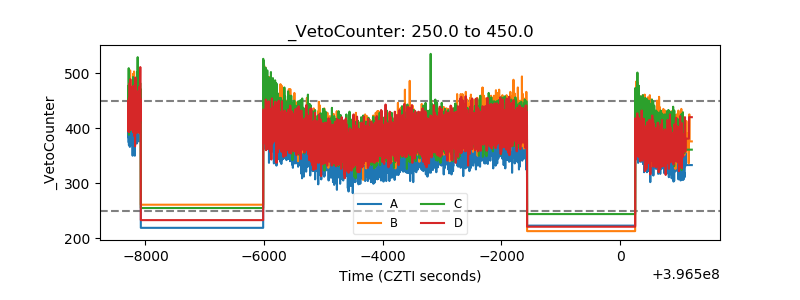 |