| Param | Original file | Final file |
|---|---|---|
| Filename | modeM0/AS1C07_010T01_9000005246_36902cztM0_level2.evt | modeM0/AS1C07_010T01_9000005246_36902cztM0_level2_quad_clean.evt |
| Size (bytes) | 129,994,560 | 16,061,760 |
| Size | 124.0 MB | 15.3 MB |
| Events in quadrant A | 1,025,999 | 115,157 |
| Events in quadrant B | 358,792 | 2,407 |
| Events in quadrant C | 1,067,671 | 116,110 |
| Events in quadrant D | 1,338,129 | 100,655 |
| Mode SS | |||
|---|---|---|---|
| Quadrant | BADHDUFLAG | Total packets | Discarded packets |
| A | 0 | 82 | 44 |
| B | 0 | 82 | 44 |
| C | 0 | 79 | 41 |
| D | 0 | 80 | 50 |
| Mode M9 | |||
|---|---|---|---|
| Quadrant | BADHDUFLAG | Total packets | Discarded packets |
| A | 0 | 11 | 0 |
| B | 0 | 11 | 0 |
| C | 0 | 11 | 0 |
| D | 0 | 12 | 0 |
| Mode M0 | |||
|---|---|---|---|
| Quadrant | BADHDUFLAG | Total packets | Discarded packets |
| A | 0 | 8299 | 4076 |
| B | 0 | 4123 | 1722 |
| C | 0 | 8347 | 4035 |
| D | 0 | 10958 | 5757 |
| Quadrant | Total seconds | Saturated seconds | Saturation percentage |
|---|---|---|---|
| A | 2034 | 2 | 0.098328% |
| B | 2377 | 2377 | 100.000000% |
| C | 2057 | 5 | 0.243072% |
| D | 1916 | 104 | 5.427975% |
Noise dominated data is calculated using 1-second bins in cleaned event files. If a bin has >2000 counts, and if more than 50% of those come from <1% of pixels, then it is considered to be noise-dominated and hence unusable.
| Quadrant | # 1 sec bins | Bins with >0 counts | Bins with >2000 counts | High rate bins dominated by noise | Noise dominated (total time) | Noise dominated (detector-on time) | Marked lightcurve |
|---|---|---|---|---|---|---|---|
| A | 4214 | 2387 | 1 | 1 | 0.02% | 0.04% | 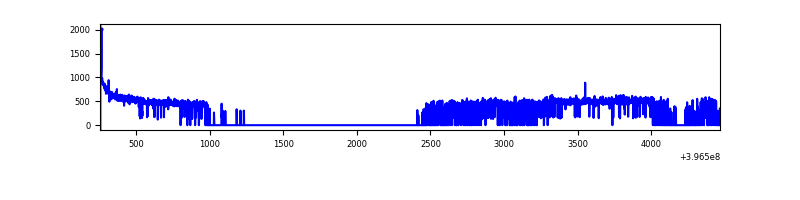 |
| B | 4210 | 2377 | 0 | 0 | 0.00% | 0.00% | 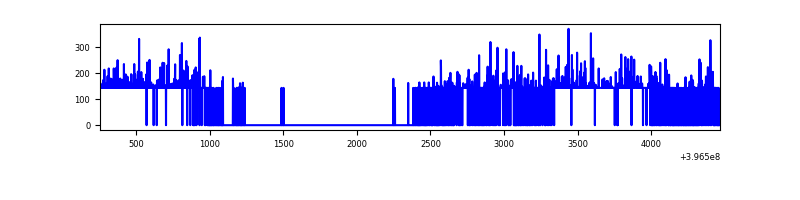 |
| C | 4205 | 2403 | 4 | 4 | 0.10% | 0.17% |  |
| D | 4196 | 2275 | 91 | 91 | 2.17% | 4.00% | 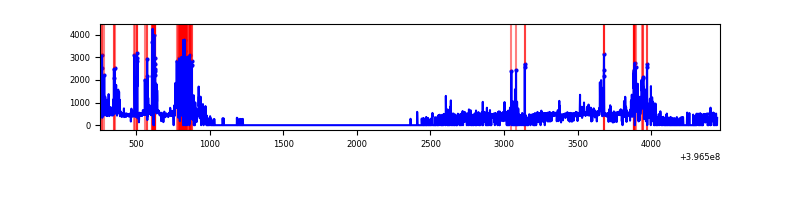 |
Top three noisy pixels from each quadrant. If the there are fewer than three noisy pixels in the level2.evt file, extra rows are filled as -1
| Pixel properties | Quadrant properties | ||||||
|---|---|---|---|---|---|---|---|
| Quadrant | DetID | PixID | Counts | Sigma | Mean | Median | Sigma |
| A | 10 | 83 | 100921 | 2040.23 | 235 | 229 | 49.4 |
| A | 12 | 189 | 9246 | 182.7 | 235 | 229 | 49.4 |
| A | 13 | 6 | 4196 | 80.38 | 235 | 229 | 49.4 |
| B | 12 | 243 | 329176 | 131781.11 | 5 | 5 | 2.5 |
| B | 12 | 144 | 6435 | 2574.2 | 5 | 5 | 2.5 |
| B | 0 | 213 | 342 | 134.92 | 5 | 5 | 2.5 |
| C | 15 | 214 | 90908 | 1627.01 | 231 | 232 | 55.7 |
| C | 0 | 10 | 44976 | 802.85 | 231 | 232 | 55.7 |
| C | 3 | 233 | 29622 | 527.35 | 231 | 232 | 55.7 |
| D | 13 | 249 | 274810 | 5098.0 | 212 | 206 | 53.9 |
| D | 12 | 233 | 86638 | 1604.6 | 212 | 206 | 53.9 |
| D | 1 | 52 | 51461 | 951.54 | 212 | 206 | 53.9 |
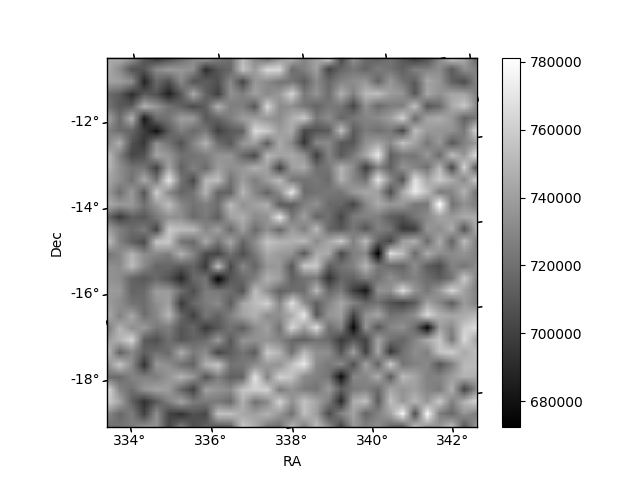
Histogram calculated using DETX and DETY for each event in the final _common_clean file
| Quadrant A |  |
 |
Quadrant B |
|---|---|---|---|
| Quadrant D |  |
 |
Quadrant C |
| Plot type | Count rate plots | Images |
|---|---|---|
| Comparison with Poisson distribution Blue bars denote a histogram of data divided into 1 sec bins. Red curve is a Poisson curve with rate = median count rate of data. |
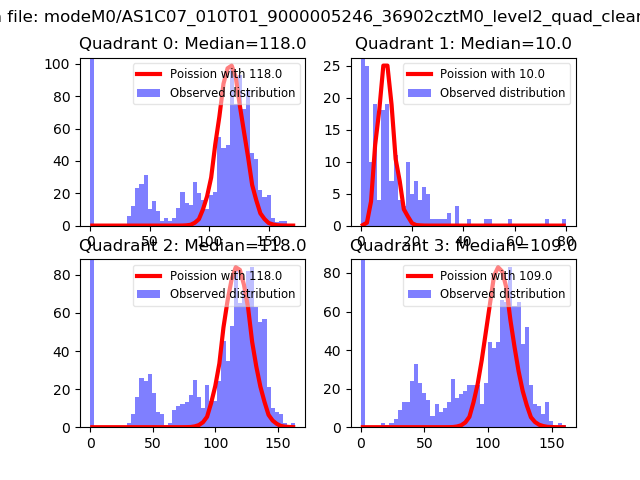 |
 |
| Quadrant-wise count rates Data is divided into 100 sec bins |
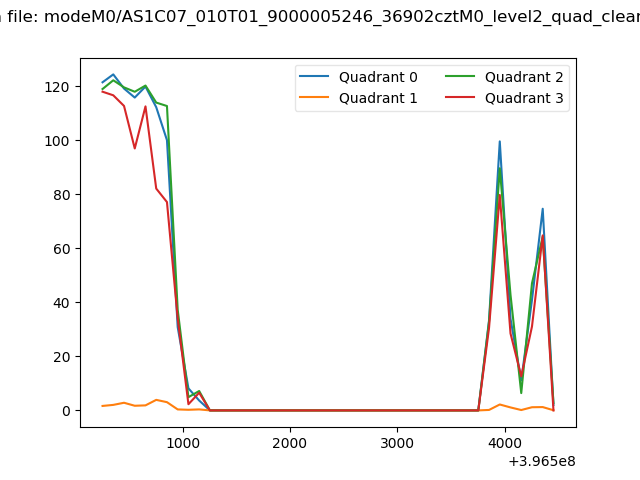 |
|
| Module-wise count rates for Quadrant A Data is divided into 100 sec bins |
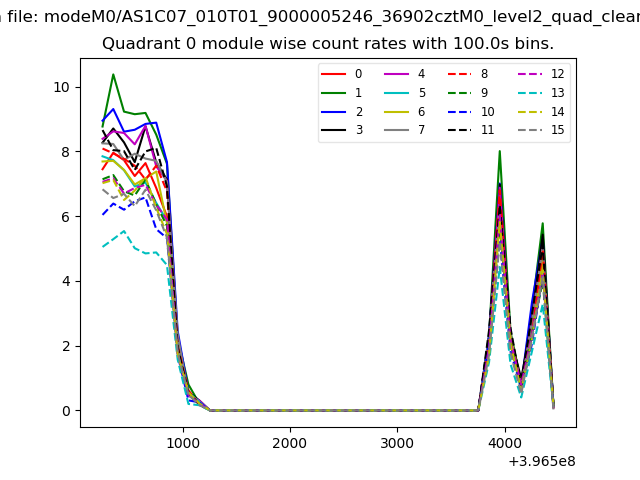 |
 |
| Module-wise count rates for Quadrant B Data is divided into 100 sec bins |
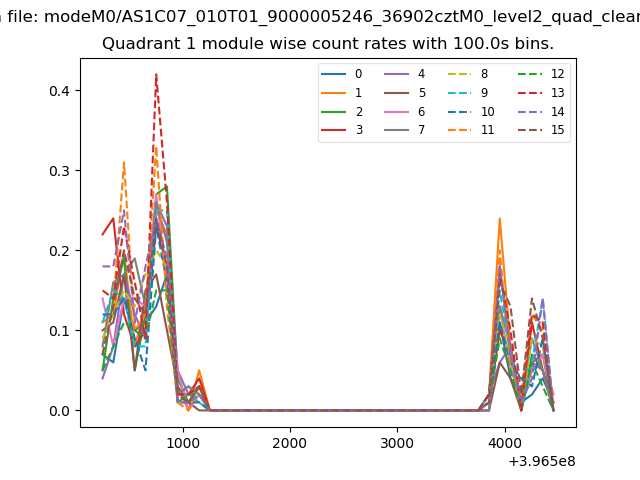 |
 |
| Module-wise count rates for Quadrant C Data is divided into 100 sec bins |
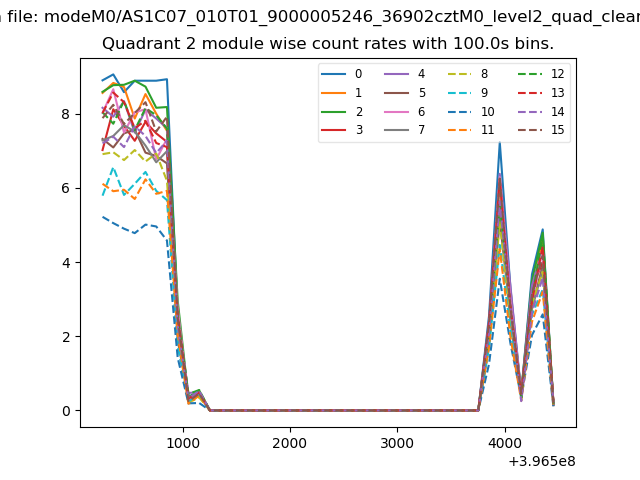 |
 |
| Module-wise count rates for Quadrant D Data is divided into 100 sec bins |
 |
 |
| Parameter | Plot |
|---|---|
| CZT HV Monitor | 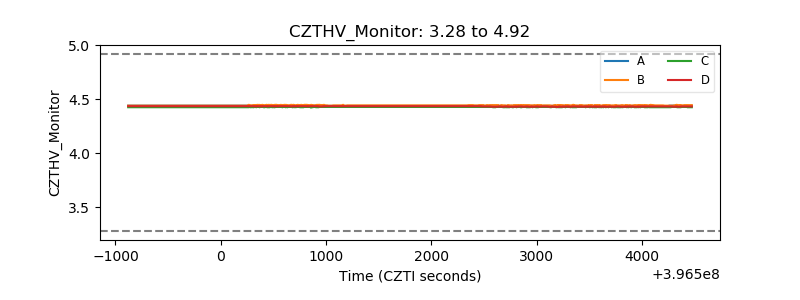 |
| D_VDD |  |
| Temperature 1 |  |
| Veto HV Monitor |  |
| Veto LLD |  |
| Alpha Counter | 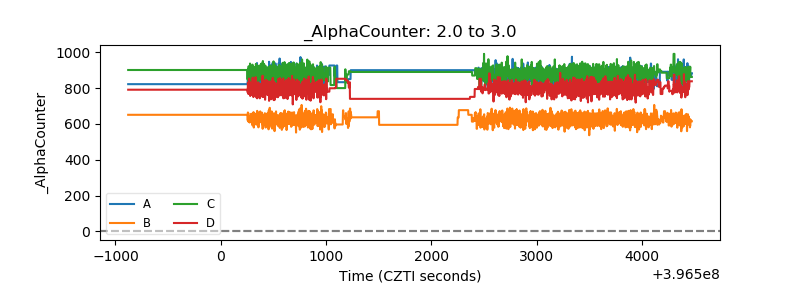 |
| _CPM_Rate | 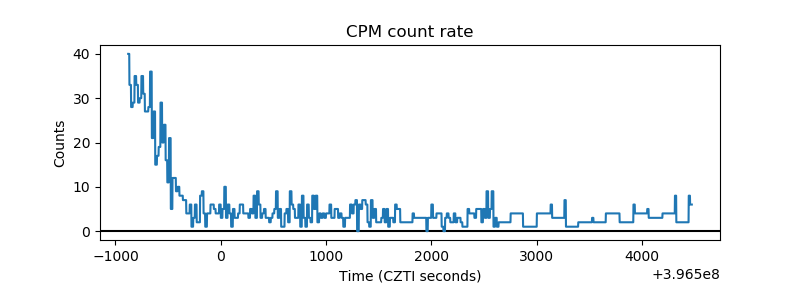 |
| CZT Counter |  |
| +2.5 Volts monitor |  |
| +5 Volts monitor |  |
| _ROLL_ROT |  |
| _Roll_DEC |  |
| _Roll_RA |  |
| Veto Counter |  |