| Param | Original file | Final file |
|---|---|---|
| Filename | modeM0/AS1C07_010T01_9000005246_36903cztM0_level2.evt | modeM0/AS1C07_010T01_9000005246_36903cztM0_level2_quad_clean.evt |
| Size (bytes) | 372,885,120 | 49,766,400 |
| Size | 355.6 MB | 47.5 MB |
| Events in quadrant A | 2,783,088 | 377,201 |
| Events in quadrant B | 866,583 | 6,073 |
| Events in quadrant C | 2,766,389 | 376,332 |
| Events in quadrant D | 4,479,118 | 342,857 |
| Mode SS | |||
|---|---|---|---|
| Quadrant | BADHDUFLAG | Total packets | Discarded packets |
| A | 0 | 118 | 0 |
| B | 0 | 118 | 0 |
| C | 0 | 118 | 0 |
| D | 0 | 118 | 0 |
| Mode M9 | |||
|---|---|---|---|
| Quadrant | BADHDUFLAG | Total packets | Discarded packets |
| A | 0 | 13 | 0 |
| B | 0 | 13 | 0 |
| C | 0 | 13 | 0 |
| D | 0 | 13 | 0 |
| Mode M0 | |||
|---|---|---|---|
| Quadrant | BADHDUFLAG | Total packets | Discarded packets |
| A | 0 | 11907 | 2 |
| B | 0 | 5820 | 1 |
| C | 0 | 11685 | 1 |
| D | 0 | 17261 | 1 |
| Quadrant | Total seconds | Saturated seconds | Saturation percentage |
|---|---|---|---|
| A | 5752 | 37 | 0.643255% |
| B | 5752 | 5752 | 100.000000% |
| C | 5752 | 6 | 0.104312% |
| D | 5752 | 497 | 8.640473% |
Noise dominated data is calculated using 1-second bins in cleaned event files. If a bin has >2000 counts, and if more than 50% of those come from <1% of pixels, then it is considered to be noise-dominated and hence unusable.
| Quadrant | # 1 sec bins | Bins with >0 counts | Bins with >2000 counts | High rate bins dominated by noise | Noise dominated (total time) | Noise dominated (detector-on time) | Marked lightcurve |
|---|---|---|---|---|---|---|---|
| A | 7095 | 5753 | 28 | 28 | 0.39% | 0.49% | 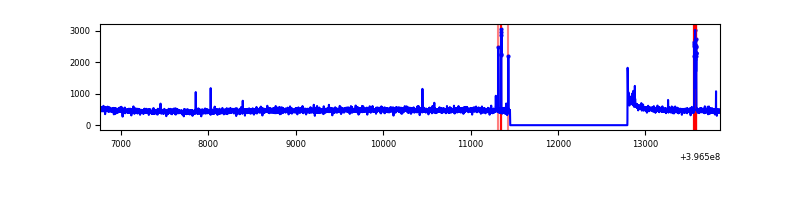 |
| B | 7094 | 5751 | 0 | 0 | 0.00% | 0.00% | 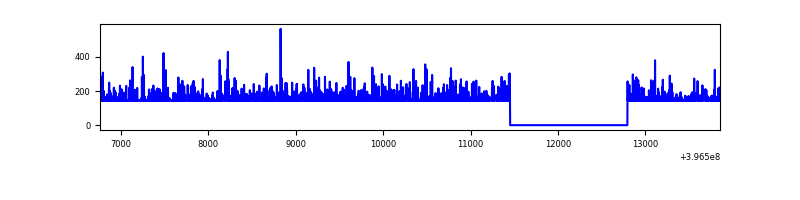 |
| C | 7095 | 5753 | 5 | 5 | 0.07% | 0.09% | 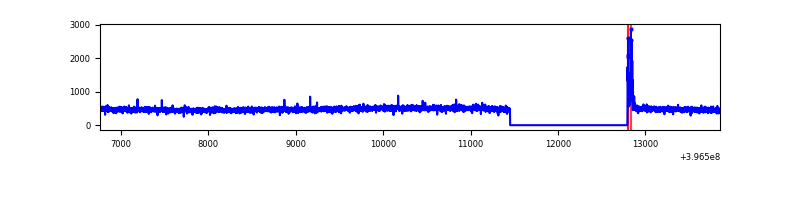 |
| D | 7095 | 5753 | 472 | 472 | 6.65% | 8.20% | 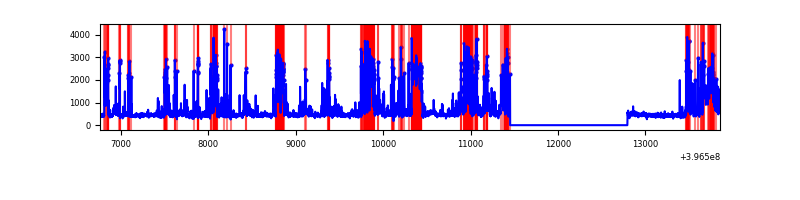 |
Top three noisy pixels from each quadrant. If the there are fewer than three noisy pixels in the level2.evt file, extra rows are filled as -1
| Pixel properties | Quadrant properties | ||||||
|---|---|---|---|---|---|---|---|
| Quadrant | DetID | PixID | Counts | Sigma | Mean | Median | Sigma |
| A | 10 | 83 | 182646 | 1384.8 | 648 | 634 | 131.4 |
| A | 15 | 223 | 84360 | 637.01 | 648 | 634 | 131.4 |
| A | 13 | 6 | 13010 | 94.16 | 648 | 634 | 131.4 |
| B | 12 | 243 | 798641 | 196213.4 | 11 | 11 | 4.1 |
| B | 12 | 144 | 15207 | 3733.47 | 11 | 11 | 4.1 |
| B | 0 | 229 | 2106 | 514.72 | 11 | 11 | 4.1 |
| C | 15 | 214 | 245475 | 1644.93 | 632 | 636 | 148.8 |
| C | 0 | 10 | 55819 | 370.74 | 632 | 636 | 148.8 |
| C | 13 | 61 | 4251 | 24.29 | 632 | 636 | 148.8 |
| D | 13 | 249 | 1081916 | 7091.68 | 617 | 601 | 152.5 |
| D | 12 | 17 | 350970 | 2297.85 | 617 | 601 | 152.5 |
| D | 10 | 253 | 277567 | 1816.45 | 617 | 601 | 152.5 |
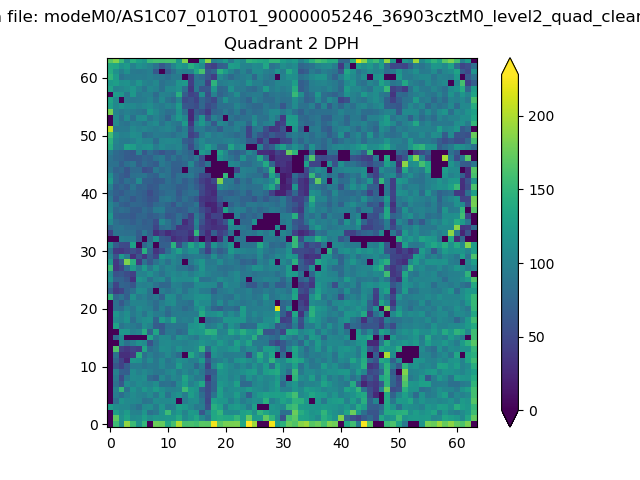
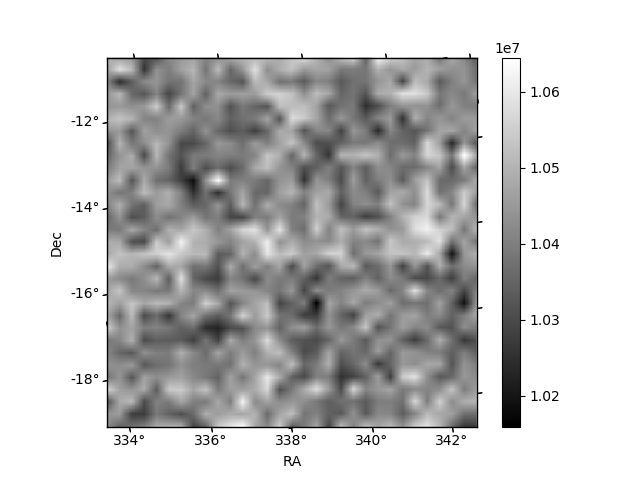
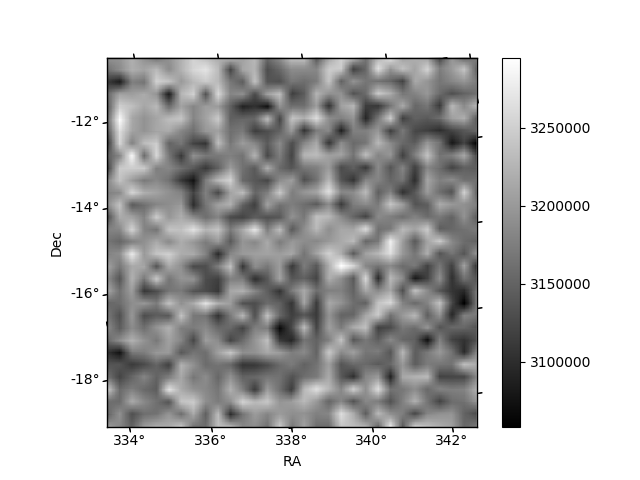
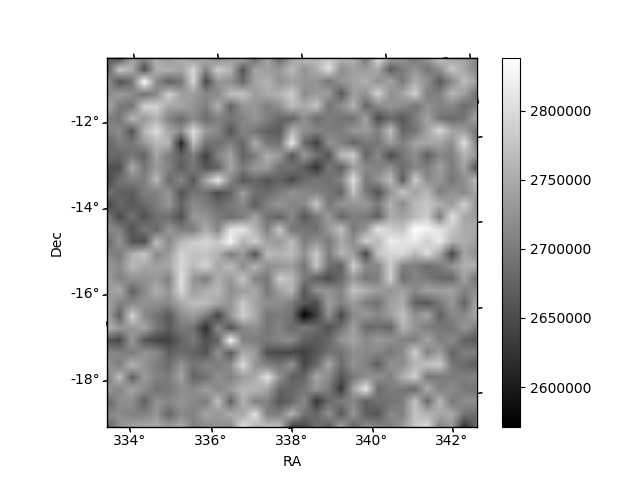
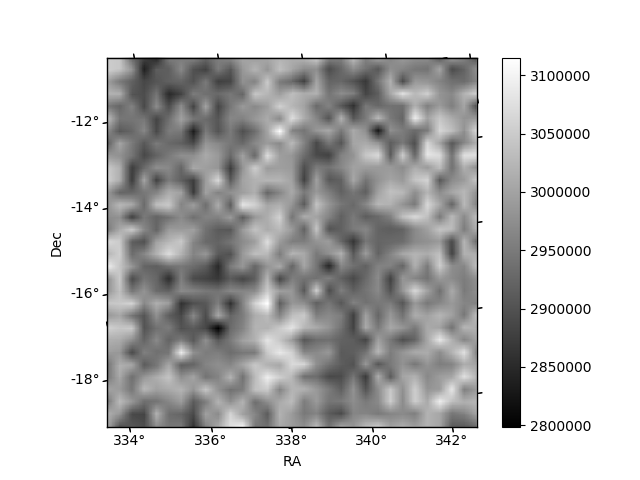
Histogram calculated using DETX and DETY for each event in the final _common_clean file
| Quadrant A | 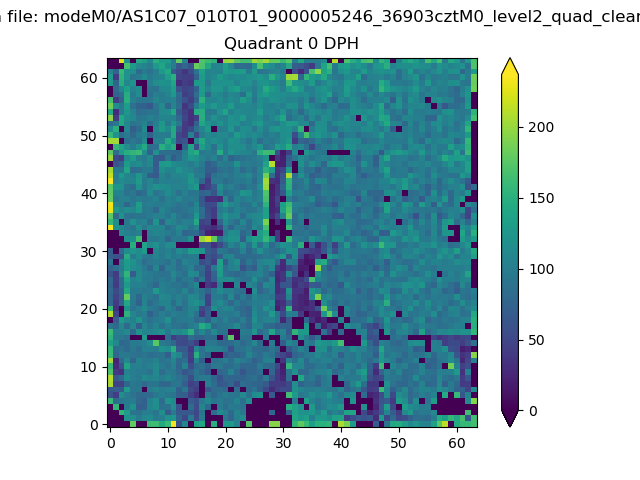 |
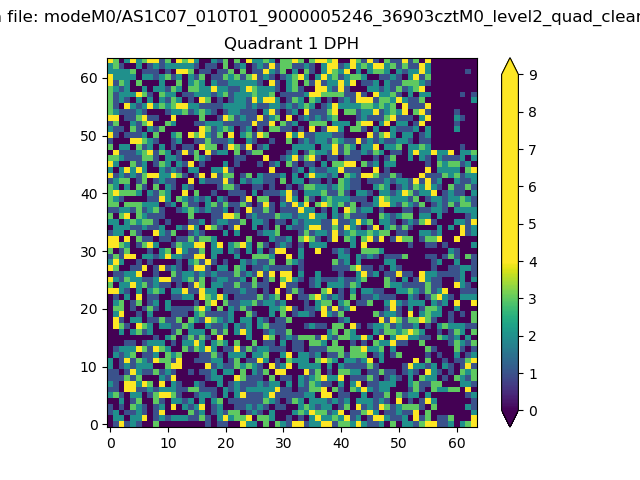 |
Quadrant B |
|---|---|---|---|
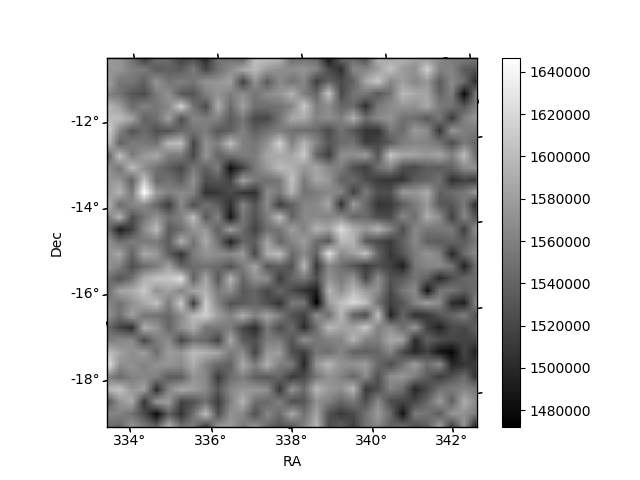
| Quadrant D | 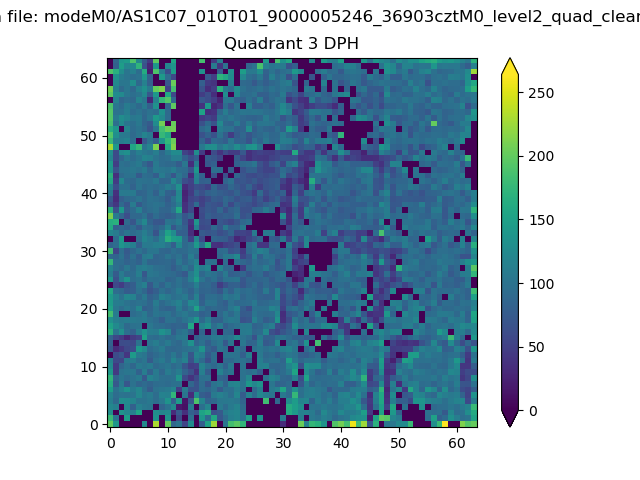 |
 |
Quadrant C |
| Plot type | Count rate plots | Images |
|---|---|---|
| Comparison with Poisson distribution Blue bars denote a histogram of data divided into 1 sec bins. Red curve is a Poisson curve with rate = median count rate of data. |
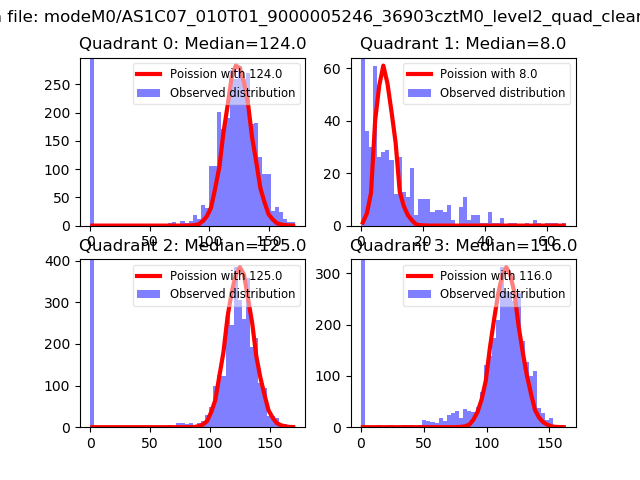 |
 |
| Quadrant-wise count rates Data is divided into 100 sec bins |
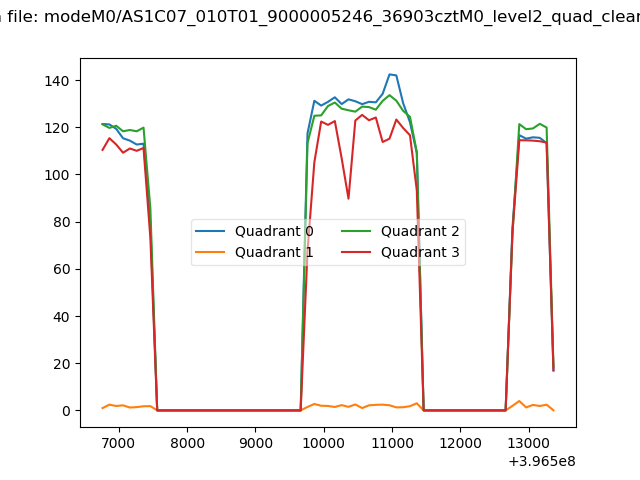 |
|
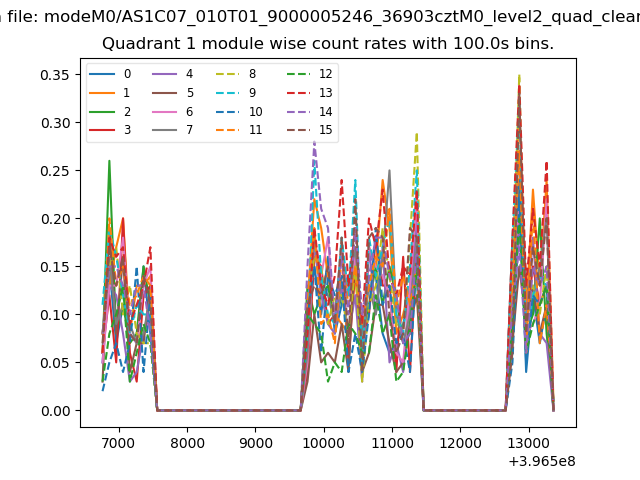
| Module-wise count rates for Quadrant A Data is divided into 100 sec bins |
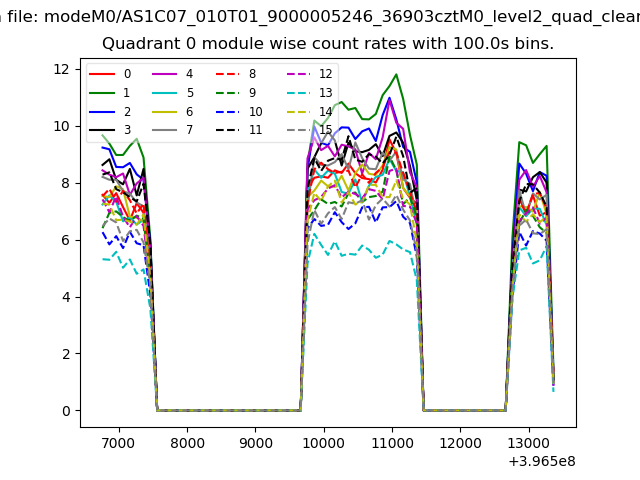 |
 |
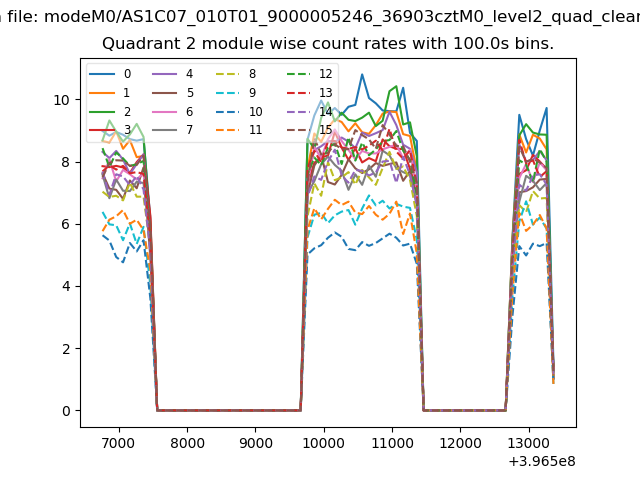
| Module-wise count rates for Quadrant B Data is divided into 100 sec bins |
 |
 |
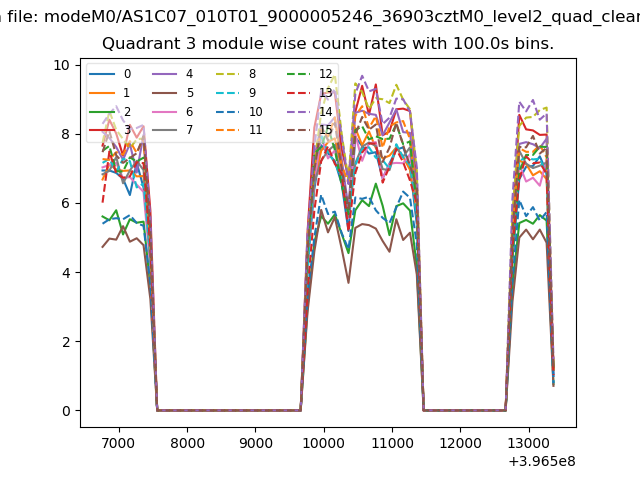
| Module-wise count rates for Quadrant C Data is divided into 100 sec bins |
 |
 |
| Module-wise count rates for Quadrant D Data is divided into 100 sec bins |
 |
 |
| Parameter | Plot |
|---|---|
| CZT HV Monitor |  |
| D_VDD | 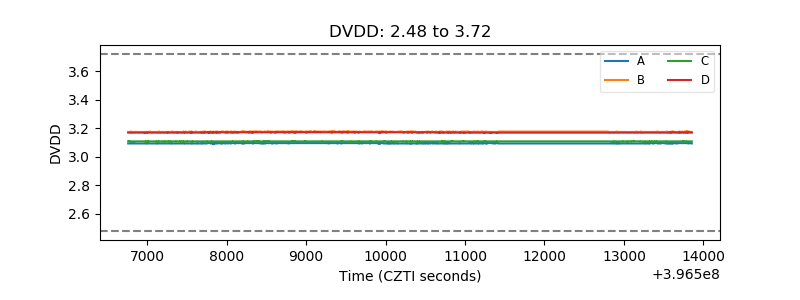 |
| Temperature 1 |  |
| Veto HV Monitor | 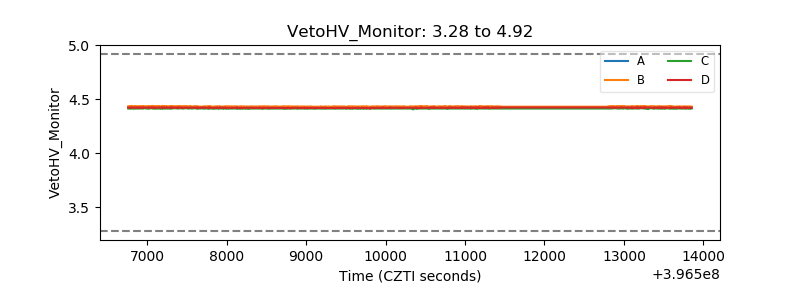 |
| Veto LLD | 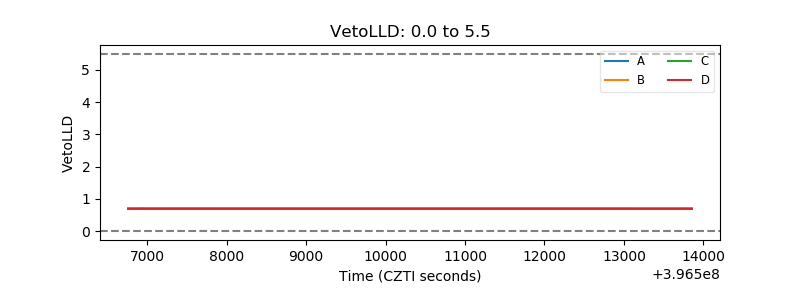 |
| Alpha Counter | 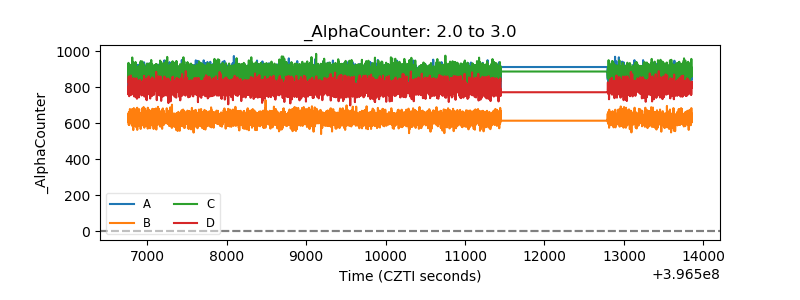 |
| _CPM_Rate | 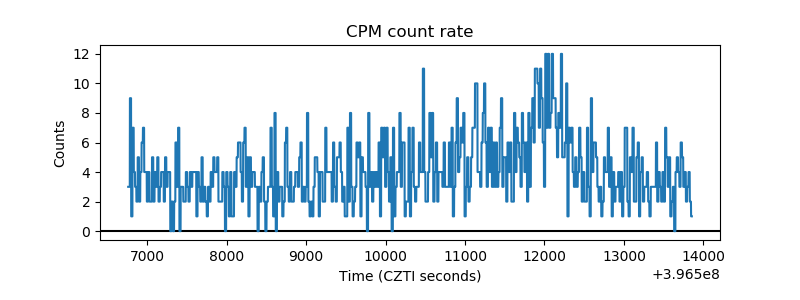 |
| CZT Counter | 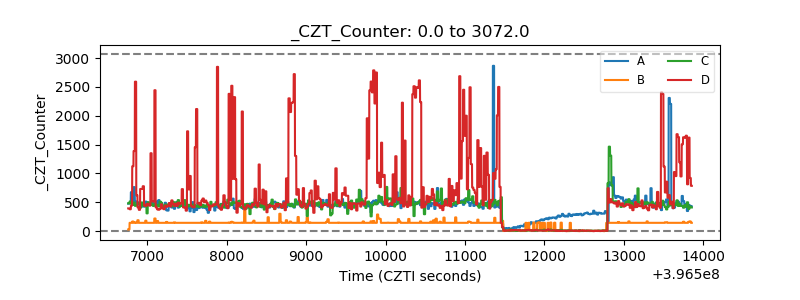 |
| +2.5 Volts monitor |  |
| +5 Volts monitor |  |
| _ROLL_ROT | 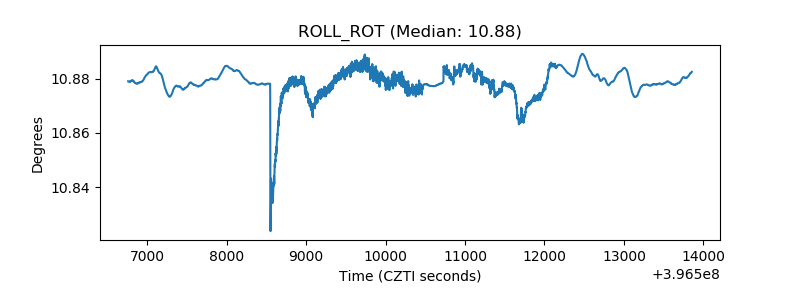 |
| _Roll_DEC | 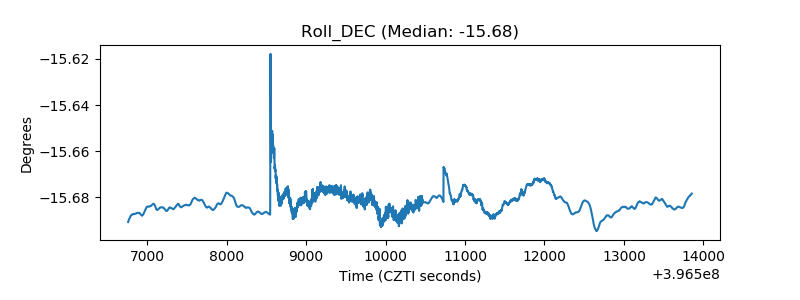 |
| _Roll_RA | 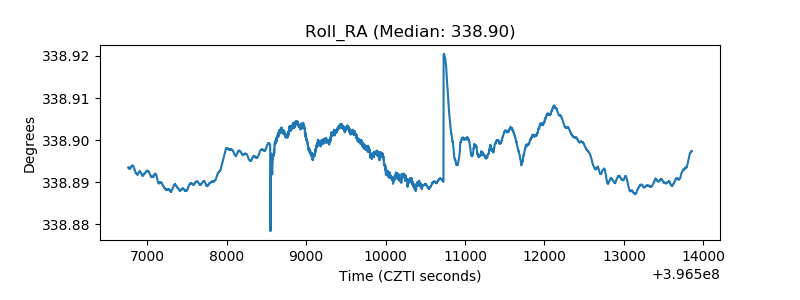 |
| Veto Counter | 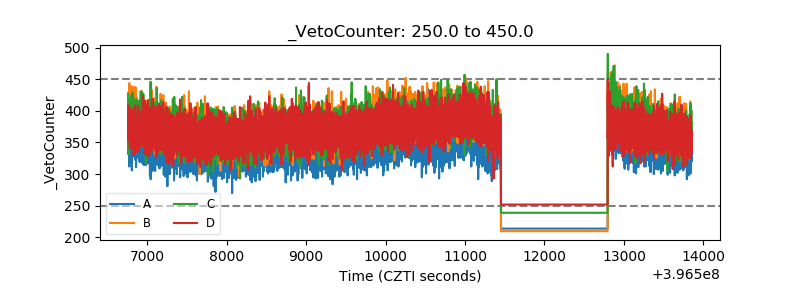 |