| Param | Original file | Final file |
|---|---|---|
| Filename | modeM0/AS1C07_010T01_9000005246_36904cztM0_level2.evt | modeM0/AS1C07_010T01_9000005246_36904cztM0_level2_quad_clean.evt |
| Size (bytes) | 413,544,960 | 47,332,800 |
| Size | 394.4 MB | 45.1 MB |
| Events in quadrant A | 3,235,826 | 350,946 |
| Events in quadrant B | 884,442 | 5,361 |
| Events in quadrant C | 2,860,620 | 343,897 |
| Events in quadrant D | 5,138,374 | 320,757 |
| Mode SS | |||
|---|---|---|---|
| Quadrant | BADHDUFLAG | Total packets | Discarded packets |
| A | 0 | 122 | 0 |
| B | 0 | 122 | 0 |
| C | 0 | 122 | 0 |
| D | 0 | 122 | 0 |
| Mode M9 | |||
|---|---|---|---|
| Quadrant | BADHDUFLAG | Total packets | Discarded packets |
| A | 0 | 18 | 0 |
| B | 0 | 19 | 1 |
| C | 0 | 19 | 2 |
| D | 0 | 19 | 2 |
| Mode M0 | |||
|---|---|---|---|
| Quadrant | BADHDUFLAG | Total packets | Discarded packets |
| A | 0 | 13485 | 194 |
| B | 0 | 5968 | 33 |
| C | 0 | 12233 | 197 |
| D | 0 | 19324 | 112 |
| Quadrant | Total seconds | Saturated seconds | Saturation percentage |
|---|---|---|---|
| A | 5851 | 70 | 1.196377% |
| B | 5889 | 5889 | 100.000000% |
| C | 5847 | 15 | 0.256542% |
| D | 5859 | 701 | 11.964499% |
Noise dominated data is calculated using 1-second bins in cleaned event files. If a bin has >2000 counts, and if more than 50% of those come from <1% of pixels, then it is considered to be noise-dominated and hence unusable.
| Quadrant | # 1 sec bins | Bins with >0 counts | Bins with >2000 counts | High rate bins dominated by noise | Noise dominated (total time) | Noise dominated (detector-on time) | Marked lightcurve |
|---|---|---|---|---|---|---|---|
| A | 7240 | 5883 | 37 | 37 | 0.51% | 0.63% | 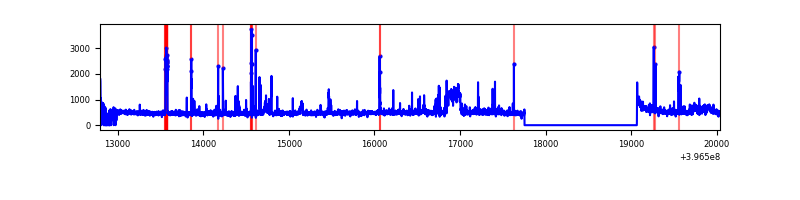 |
| B | 7239 | 5888 | 0 | 0 | 0.00% | 0.00% | 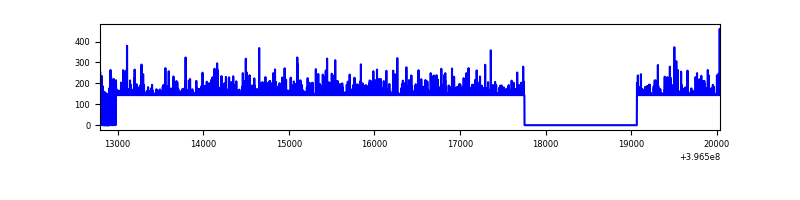 |
| C | 7240 | 5880 | 12 | 12 | 0.17% | 0.20% | 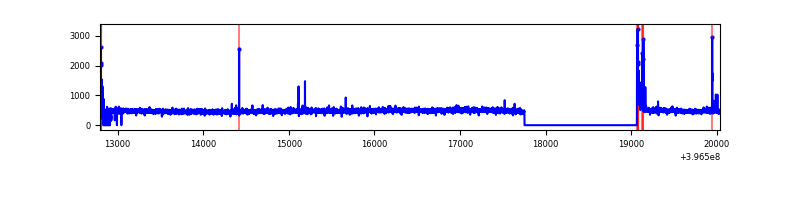 |
| D | 7240 | 5889 | 668 | 668 | 9.23% | 11.34% | 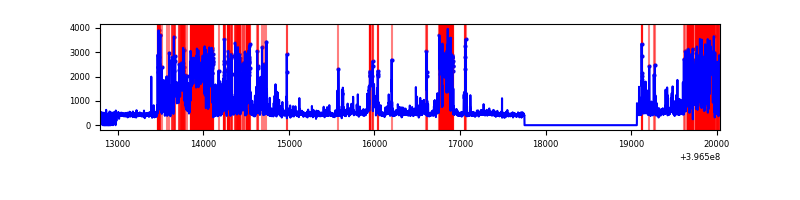 |
Top three noisy pixels from each quadrant. If the there are fewer than three noisy pixels in the level2.evt file, extra rows are filled as -1
| Pixel properties | Quadrant properties | ||||||
|---|---|---|---|---|---|---|---|
| Quadrant | DetID | PixID | Counts | Sigma | Mean | Median | Sigma |
| A | 15 | 223 | 340636 | 2543.37 | 658 | 644 | 133.7 |
| A | 10 | 83 | 218163 | 1627.19 | 658 | 644 | 133.7 |
| A | 7 | 16 | 102383 | 761.08 | 658 | 644 | 133.7 |
| B | 12 | 243 | 817561 | 197439.75 | 12 | 12 | 4.1 |
| B | 12 | 144 | 15658 | 3778.54 | 12 | 12 | 4.1 |
| B | 0 | 189 | 808 | 192.24 | 12 | 12 | 4.1 |
| C | 15 | 214 | 247765 | 1636.45 | 643 | 646 | 151.0 |
| C | 0 | 10 | 99777 | 656.45 | 643 | 646 | 151.0 |
| C | 13 | 61 | 4277 | 24.04 | 643 | 646 | 151.0 |
| D | 10 | 253 | 1035673 | 6774.65 | 617 | 600 | 152.8 |
| D | 13 | 249 | 653555 | 4273.65 | 617 | 600 | 152.8 |
| D | 12 | 233 | 597622 | 3907.57 | 617 | 600 | 152.8 |
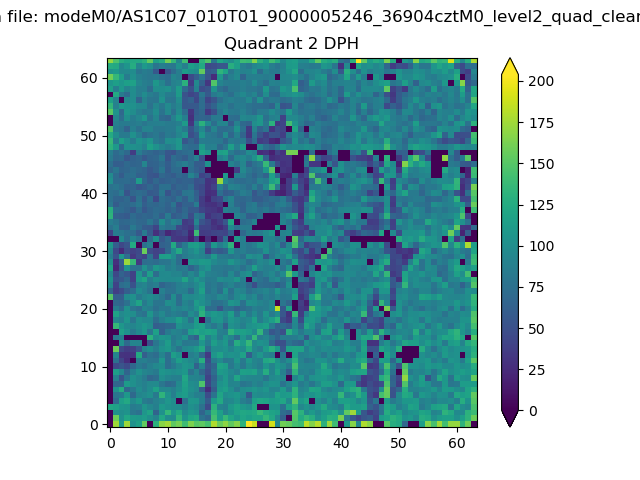
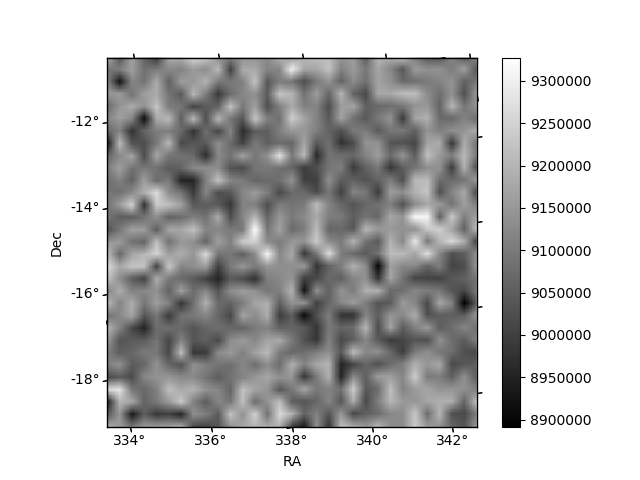
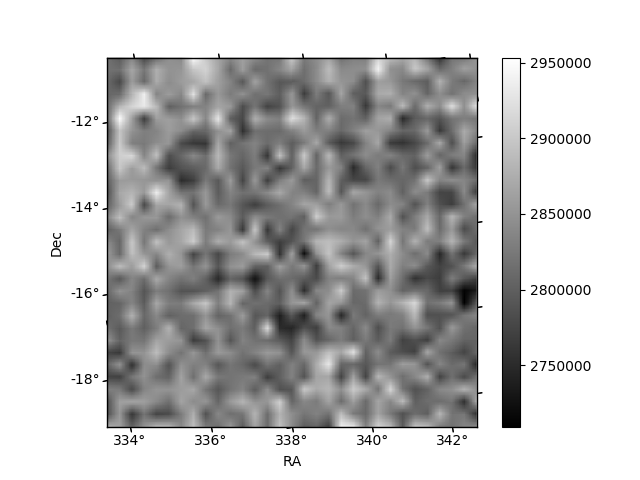
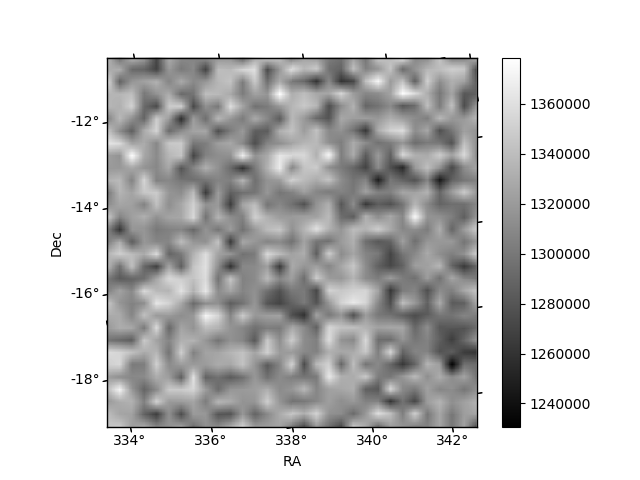
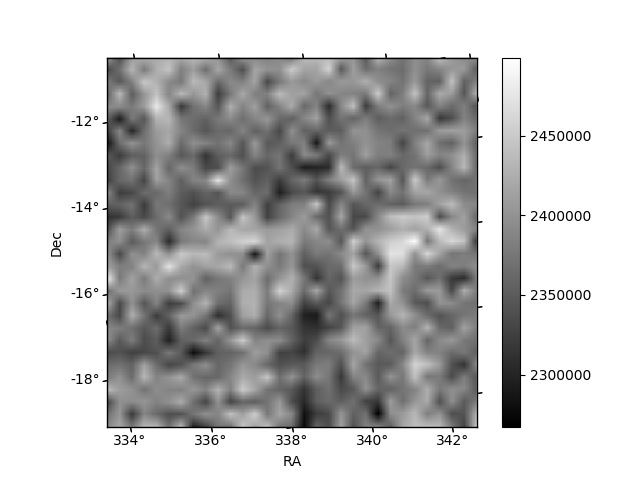
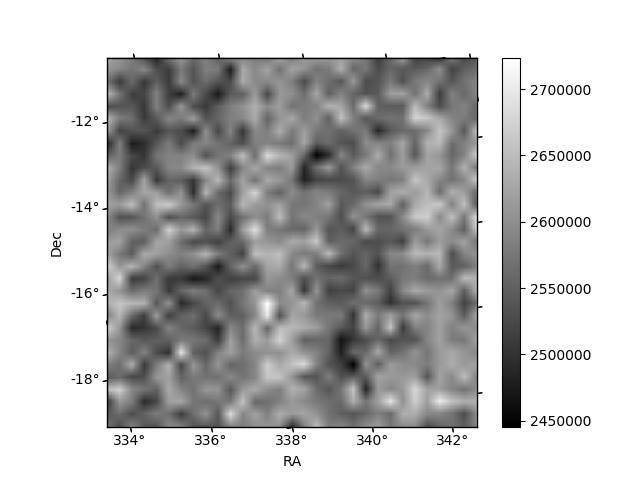
Histogram calculated using DETX and DETY for each event in the final _common_clean file
| Quadrant A | 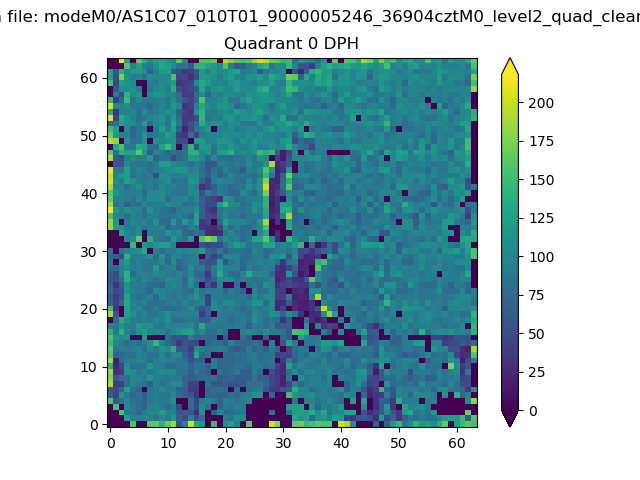 |
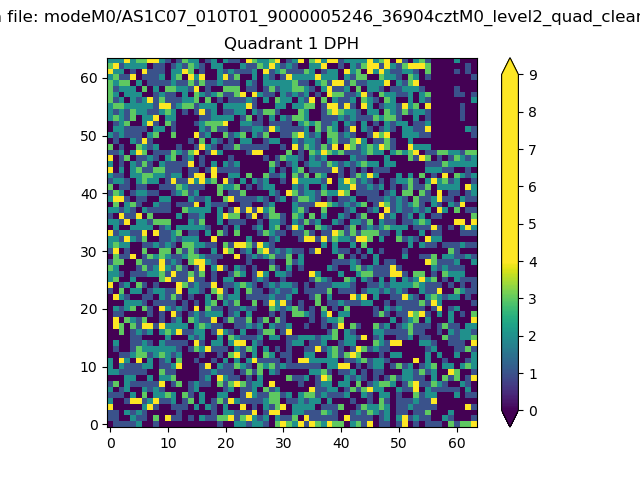 |
Quadrant B |
|---|---|---|---|
| Quadrant D | 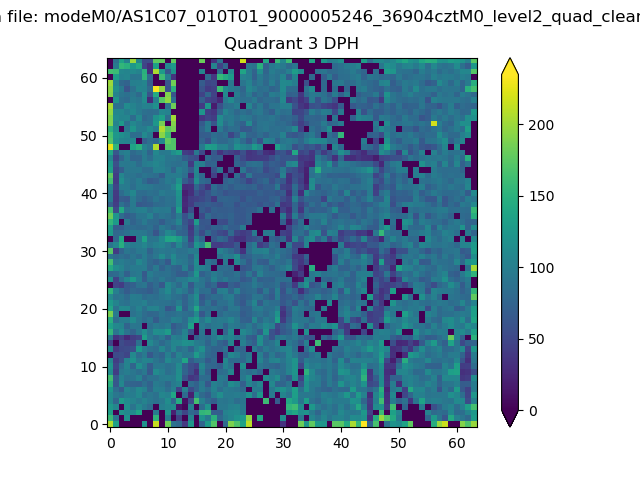 |
 |
Quadrant C |
| Plot type | Count rate plots | Images |
|---|---|---|
| Comparison with Poisson distribution Blue bars denote a histogram of data divided into 1 sec bins. Red curve is a Poisson curve with rate = median count rate of data. |
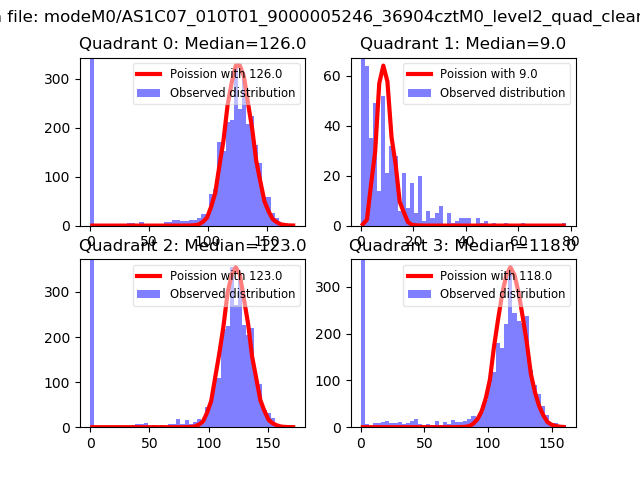 |
 |
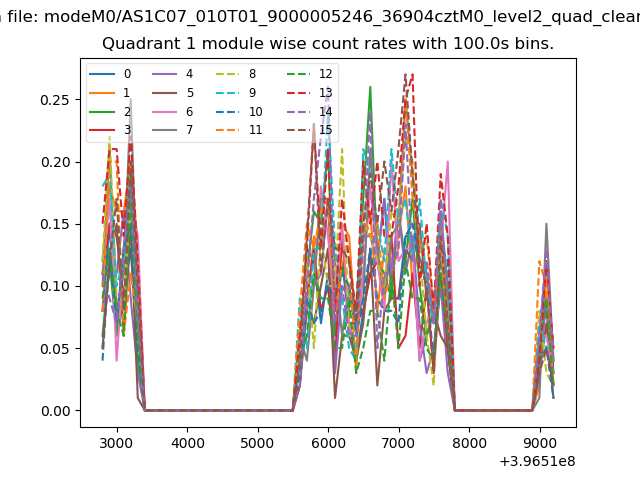
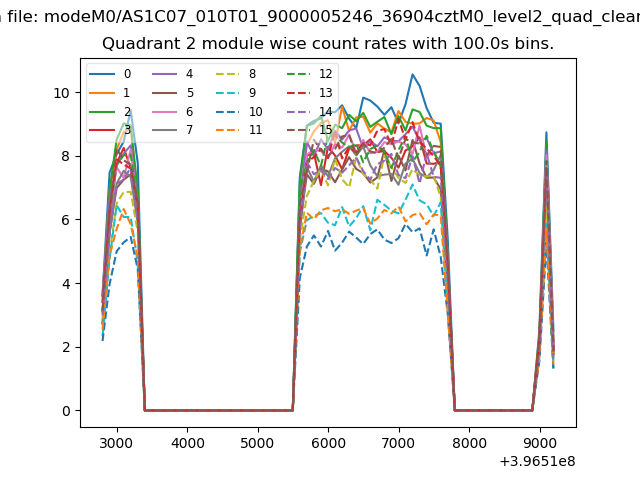
| Quadrant-wise count rates Data is divided into 100 sec bins |
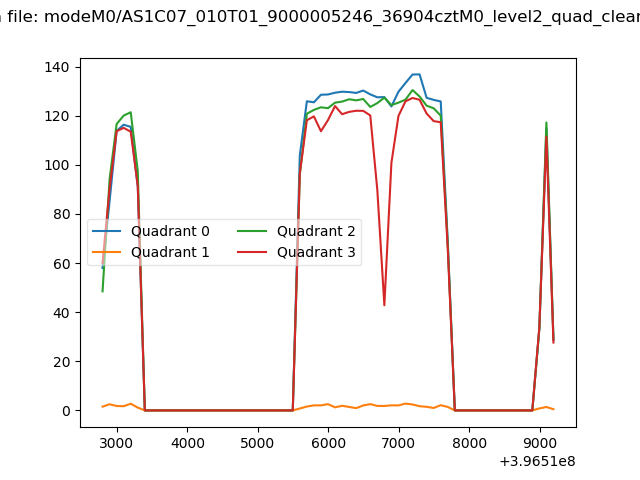 |
|
| Module-wise count rates for Quadrant A Data is divided into 100 sec bins |
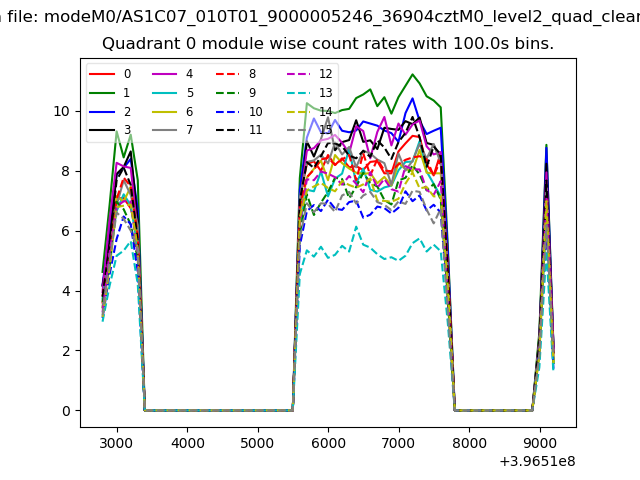 |
 |
| Module-wise count rates for Quadrant B Data is divided into 100 sec bins |
 |
 |
| Module-wise count rates for Quadrant C Data is divided into 100 sec bins |
 |
 |
| Module-wise count rates for Quadrant D Data is divided into 100 sec bins |
 |
 |
| Parameter | Plot |
|---|---|
| CZT HV Monitor | 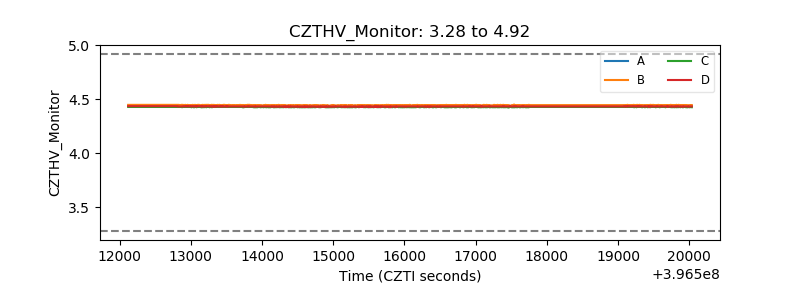 |
| D_VDD |  |
| Temperature 1 | 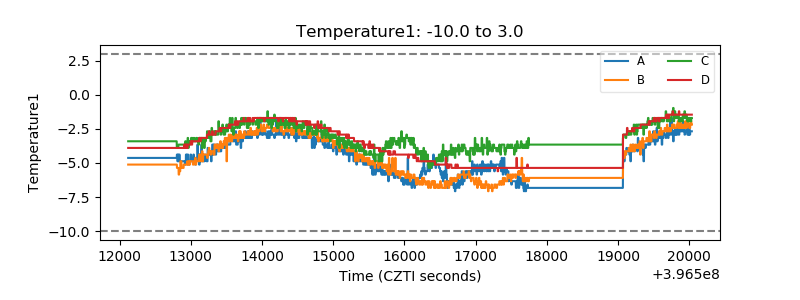 |
| Veto HV Monitor | 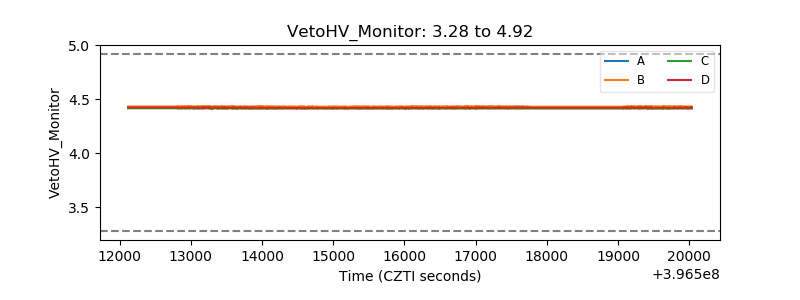 |
| Veto LLD | 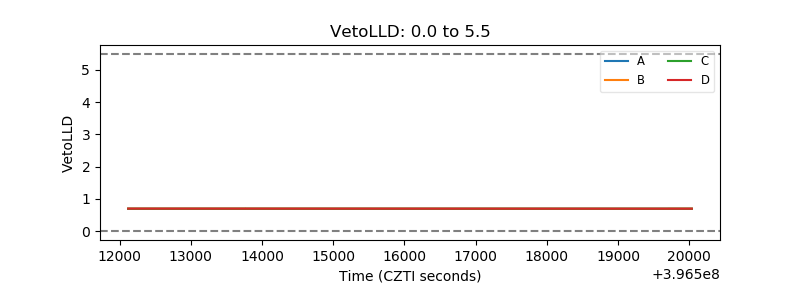 |
| Alpha Counter | 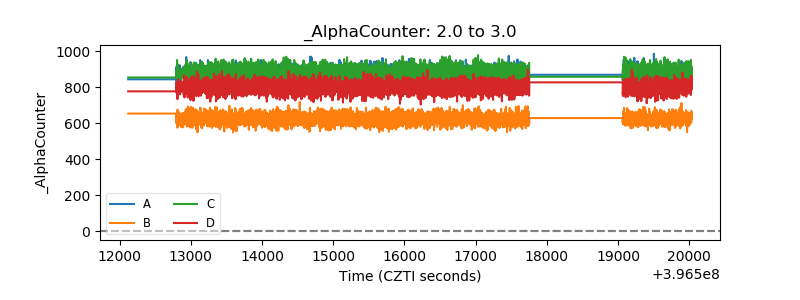 |
| _CPM_Rate | 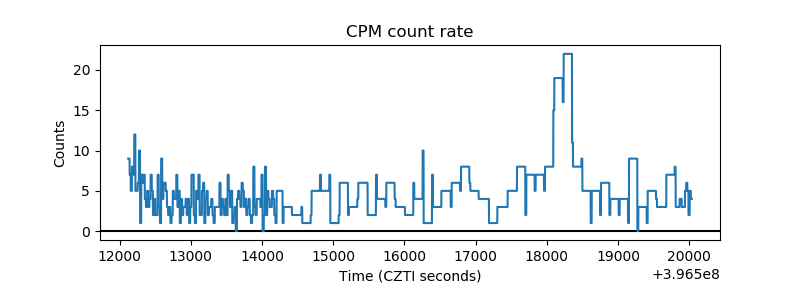 |
| CZT Counter | 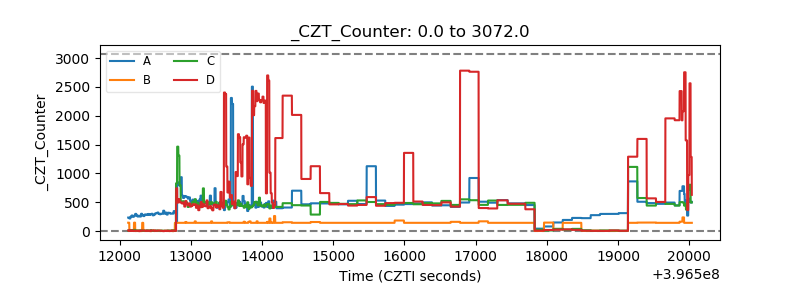 |
| +2.5 Volts monitor |  |
| +5 Volts monitor |  |
| _ROLL_ROT | 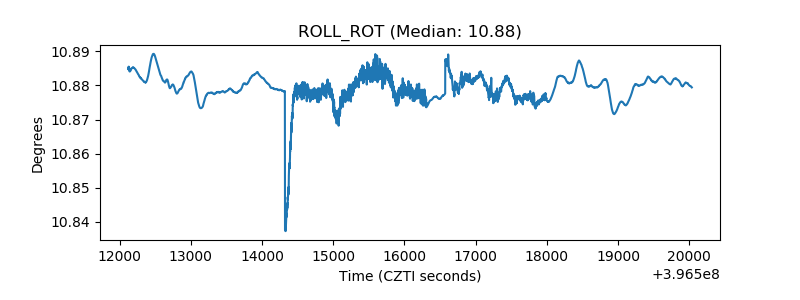 |
| _Roll_DEC | 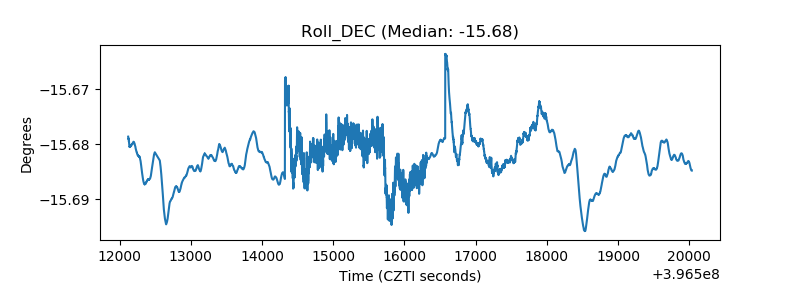 |
| _Roll_RA | 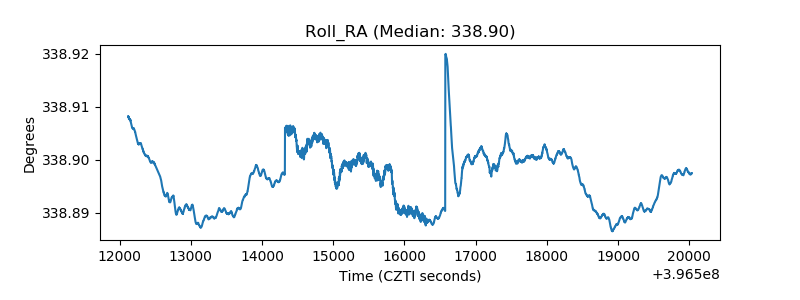 |
| Veto Counter | 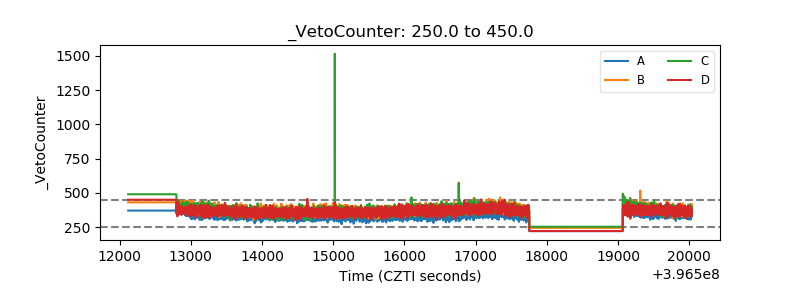 |