| Param | Original file | Final file |
|---|---|---|
| Filename | modeM0/AS1C07_010T01_9000005246_36906cztM0_level2.evt | modeM0/AS1C07_010T01_9000005246_36906cztM0_level2_quad_clean.evt |
| Size (bytes) | 1,812,499,200 | 235,791,360 |
| Size | 1.7 GB | 224.9 MB |
| Events in quadrant A | 14,291,098 | 1,769,212 |
| Events in quadrant B | 4,289,979 | 28,884 |
| Events in quadrant C | 13,919,953 | 1,744,950 |
| Events in quadrant D | 20,446,508 | 1,641,117 |
| Mode SS | |||
|---|---|---|---|
| Quadrant | BADHDUFLAG | Total packets | Discarded packets |
| A | 0 | 578 | 0 |
| B | 0 | 578 | 0 |
| C | 0 | 578 | 0 |
| D | 0 | 578 | 0 |
| Mode M9 | |||
|---|---|---|---|
| Quadrant | BADHDUFLAG | Total packets | Discarded packets |
| A | 0 | 81 | 0 |
| B | 0 | 81 | 0 |
| C | 0 | 81 | 0 |
| D | 0 | 82 | 0 |
| Mode M0 | |||
|---|---|---|---|
| Quadrant | BADHDUFLAG | Total packets | Discarded packets |
| A | 0 | 60438 | 8 |
| B | 0 | 28685 | 7 |
| C | 0 | 58413 | 7 |
| D | 0 | 79812 | 7 |
| Quadrant | Total seconds | Saturated seconds | Saturation percentage |
|---|---|---|---|
| A | 28347 | 225 | 0.793735% |
| B | 28347 | 28347 | 100.000000% |
| C | 28347 | 63 | 0.222246% |
| D | 28347 | 1908 | 6.730871% |
Noise dominated data is calculated using 1-second bins in cleaned event files. If a bin has >2000 counts, and if more than 50% of those come from <1% of pixels, then it is considered to be noise-dominated and hence unusable.
| Quadrant | # 1 sec bins | Bins with >0 counts | Bins with >2000 counts | High rate bins dominated by noise | Noise dominated (total time) | Noise dominated (detector-on time) | Marked lightcurve |
|---|---|---|---|---|---|---|---|
| A | 38628 | 28353 | 144 | 144 | 0.37% | 0.51% | 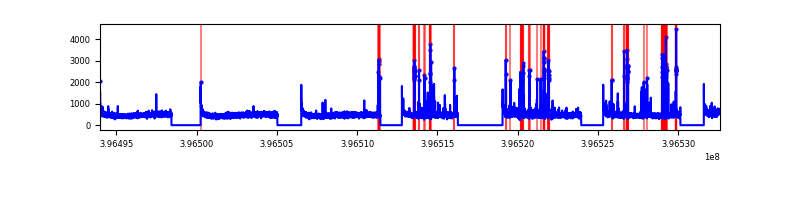 |
| B | 38627 | 28346 | 2 | 2 | 0.01% | 0.01% | 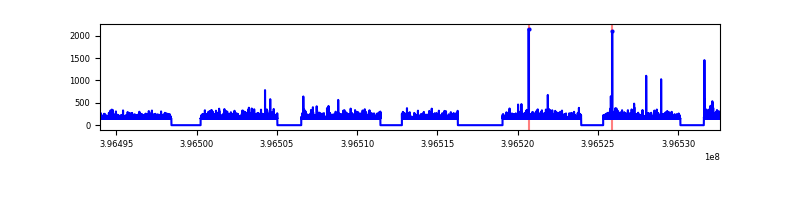 |
| C | 38628 | 28353 | 55 | 55 | 0.14% | 0.19% | 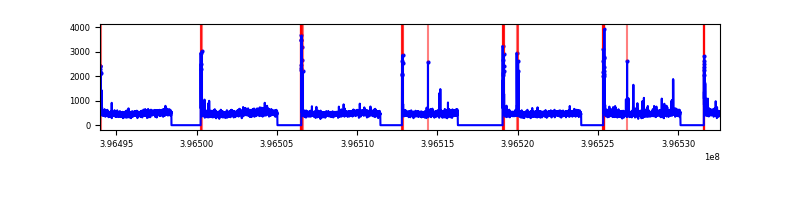 |
| D | 38628 | 28353 | 1715 | 1715 | 4.44% | 6.05% | 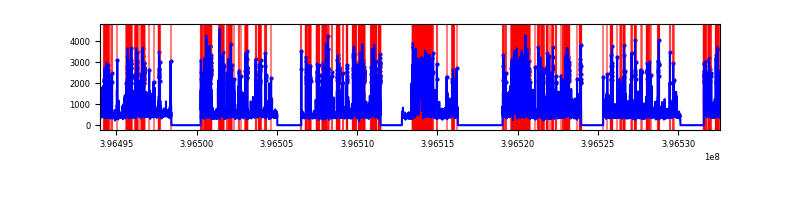 |
Top three noisy pixels from each quadrant. If the there are fewer than three noisy pixels in the level2.evt file, extra rows are filled as -1
| Pixel properties | Quadrant properties | ||||||
|---|---|---|---|---|---|---|---|
| Quadrant | DetID | PixID | Counts | Sigma | Mean | Median | Sigma |
| A | 10 | 83 | 985419 | 1533.39 | 3202 | 3138 | 640.6 |
| A | 15 | 223 | 613570 | 952.91 | 3202 | 3138 | 640.6 |
| A | 7 | 16 | 189922 | 291.58 | 3202 | 3138 | 640.6 |
| B | 12 | 243 | 3931588 | 280081.93 | 62 | 61 | 14.0 |
| B | 12 | 144 | 75699 | 5388.45 | 62 | 61 | 14.0 |
| B | 5 | 255 | 8569 | 606.11 | 62 | 61 | 14.0 |
| C | 15 | 214 | 1197706 | 1647.13 | 3125 | 3149 | 725.2 |
| C | 0 | 10 | 412080 | 563.86 | 3125 | 3149 | 725.2 |
| C | 0 | 207 | 75028 | 99.11 | 3125 | 3149 | 725.2 |
| D | 13 | 249 | 2959453 | 3946.3 | 3071 | 2991 | 749.2 |
| D | 12 | 233 | 1860742 | 2479.74 | 3071 | 2991 | 749.2 |
| D | 10 | 253 | 1111161 | 1479.19 | 3071 | 2991 | 749.2 |
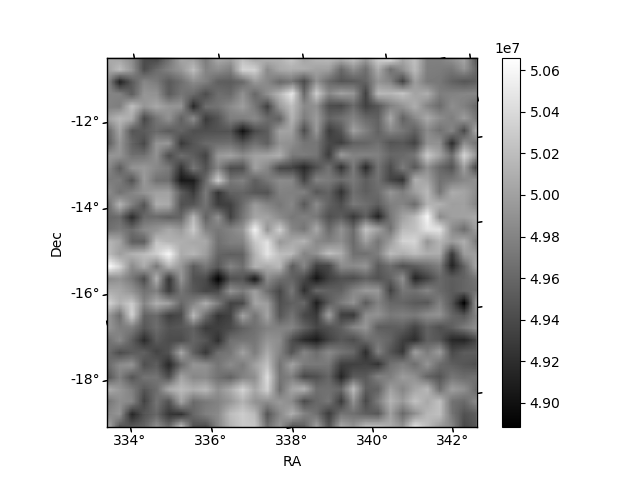
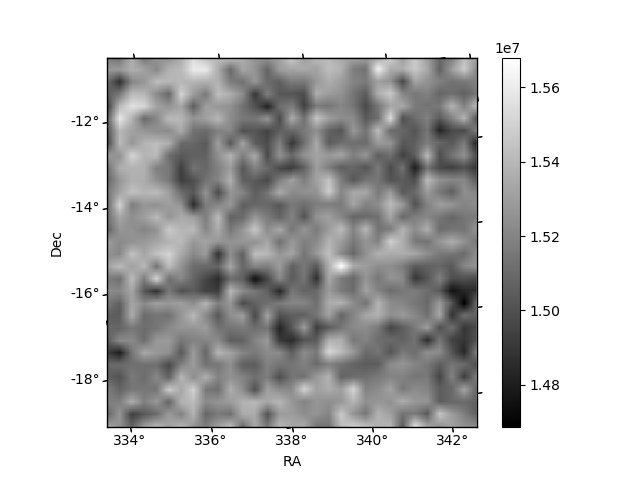
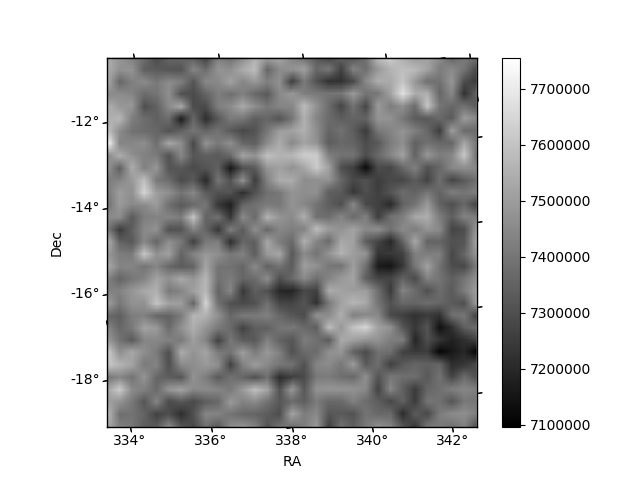
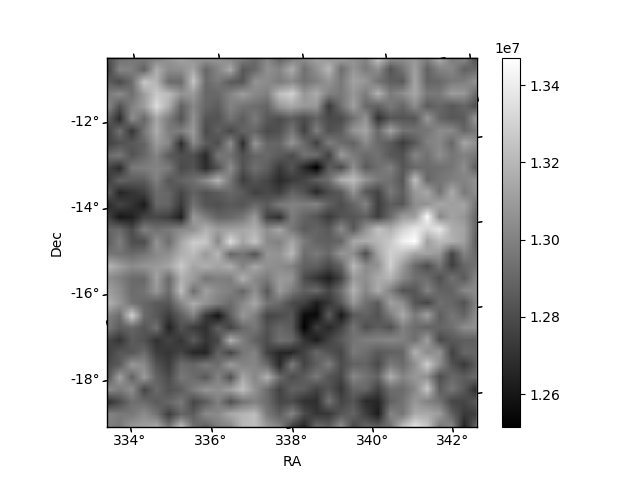
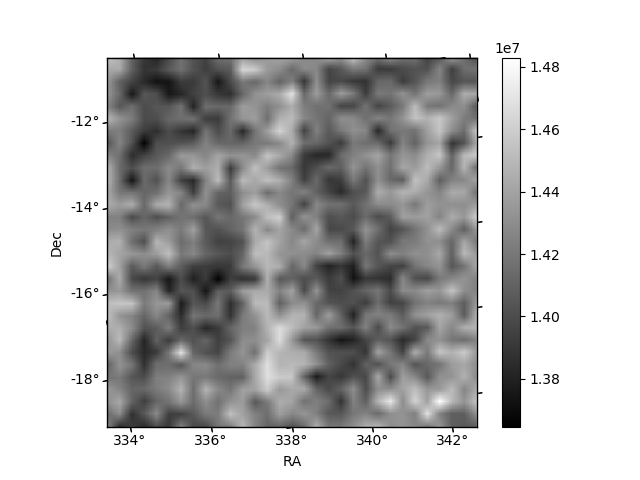
Histogram calculated using DETX and DETY for each event in the final _common_clean file
| Quadrant A | 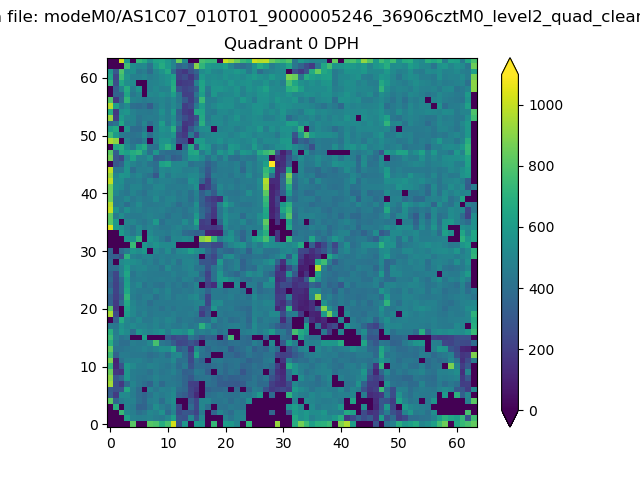 |
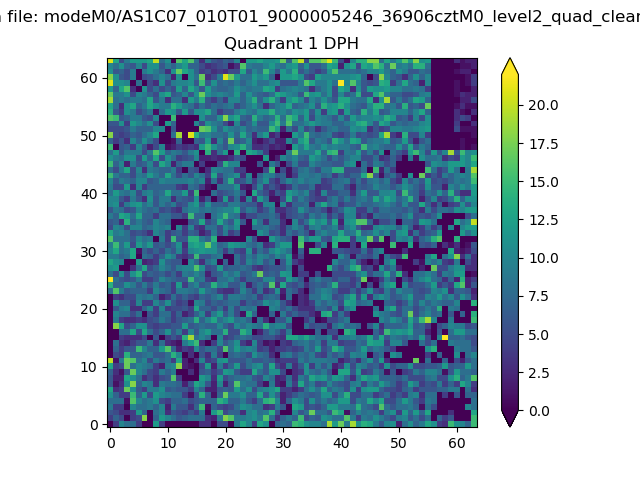 |
Quadrant B |
|---|---|---|---|
| Quadrant D |  |
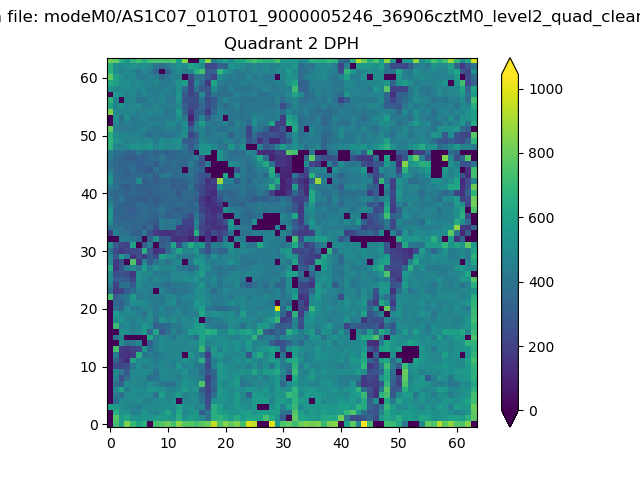 |
Quadrant C |
| Plot type | Count rate plots | Images |
|---|---|---|
| Comparison with Poisson distribution Blue bars denote a histogram of data divided into 1 sec bins. Red curve is a Poisson curve with rate = median count rate of data. |
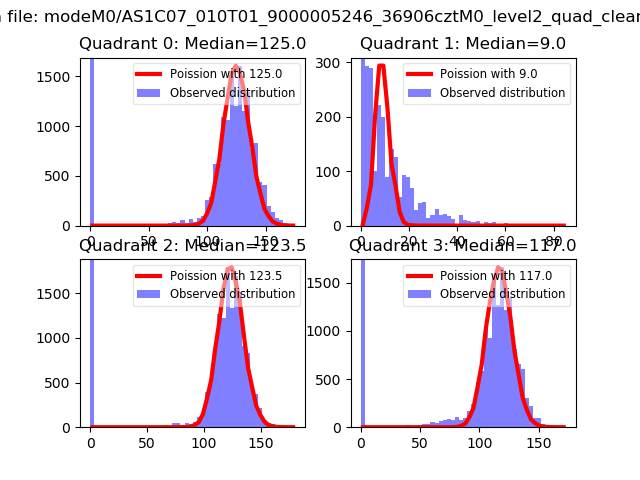 |
 |
| Quadrant-wise count rates Data is divided into 100 sec bins |
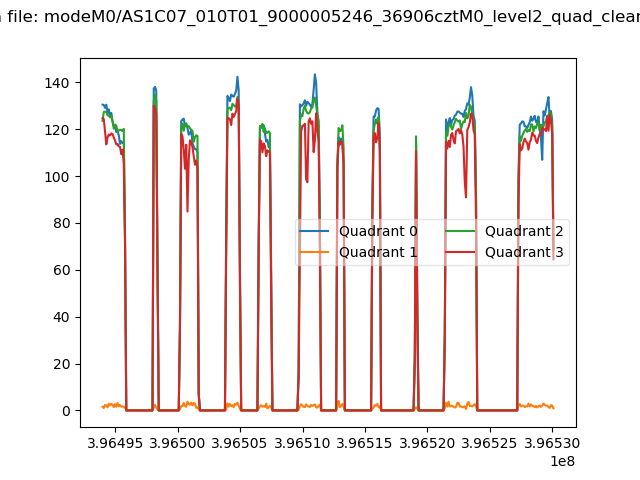 |
|
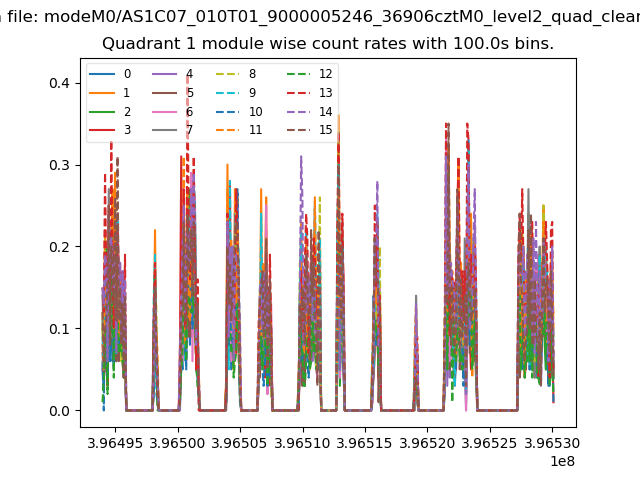
| Module-wise count rates for Quadrant A Data is divided into 100 sec bins |
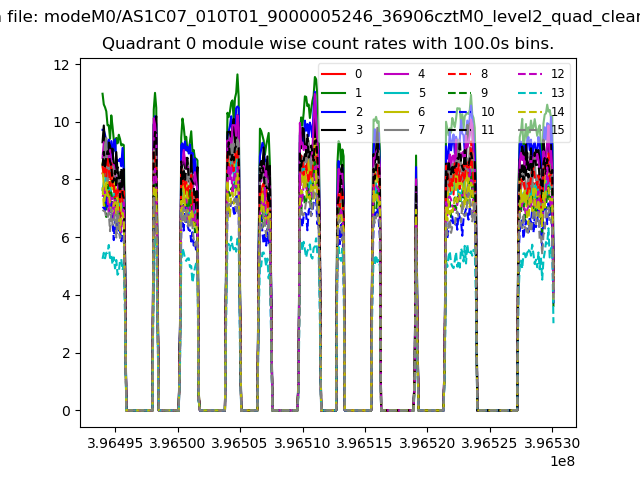 |
 |
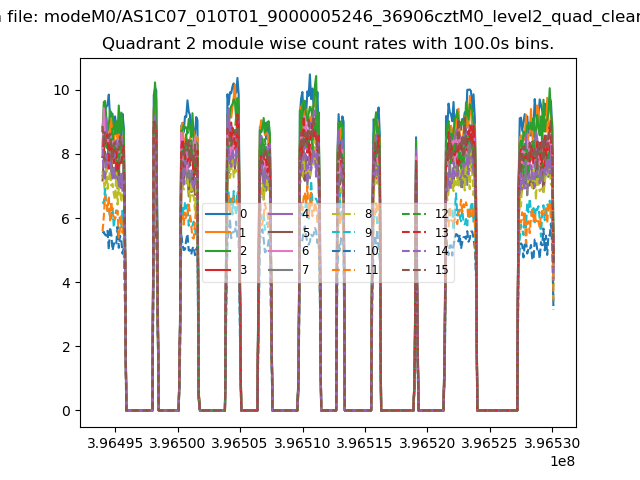
| Module-wise count rates for Quadrant B Data is divided into 100 sec bins |
 |
 |
| Module-wise count rates for Quadrant C Data is divided into 100 sec bins |
 |
 |
| Module-wise count rates for Quadrant D Data is divided into 100 sec bins |
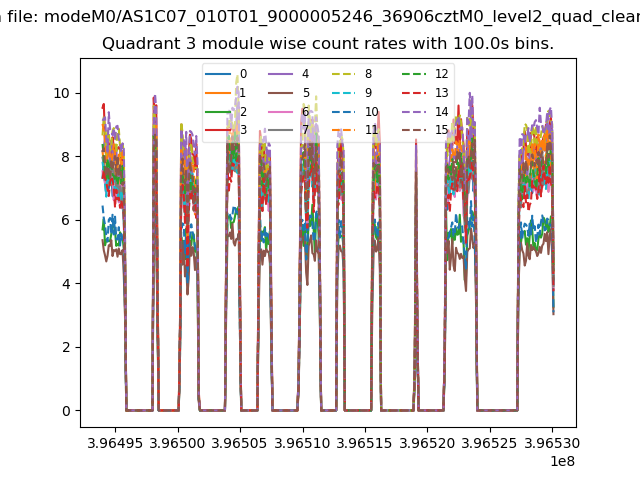 |
 |
| Parameter | Plot |
|---|---|
| CZT HV Monitor | 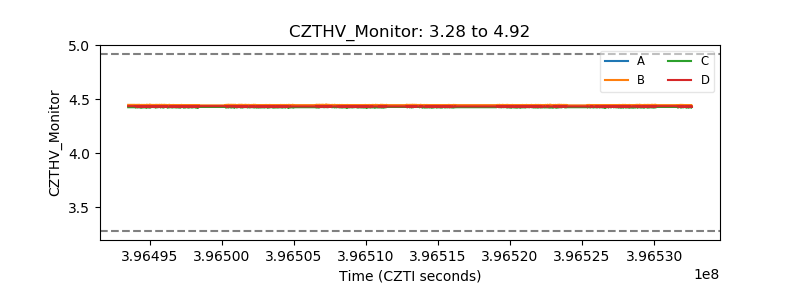 |
| D_VDD | 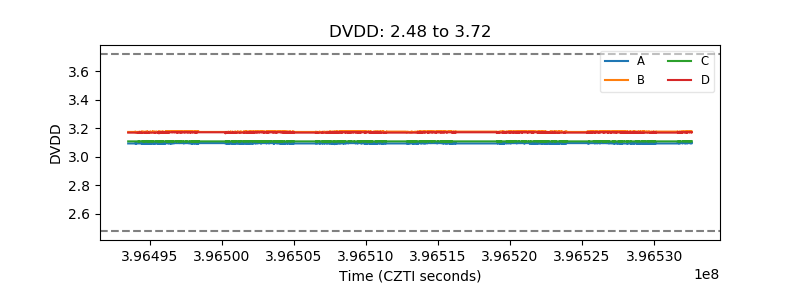 |
| Temperature 1 | 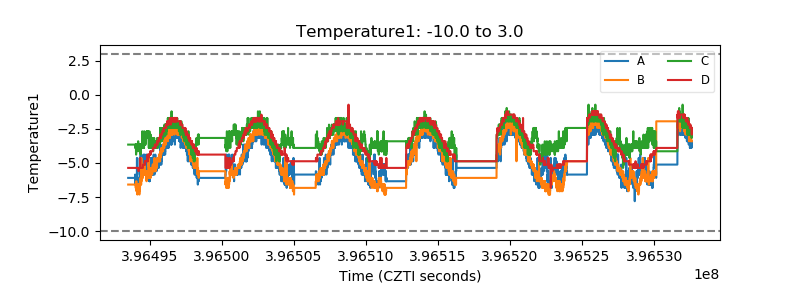 |
| Veto HV Monitor | 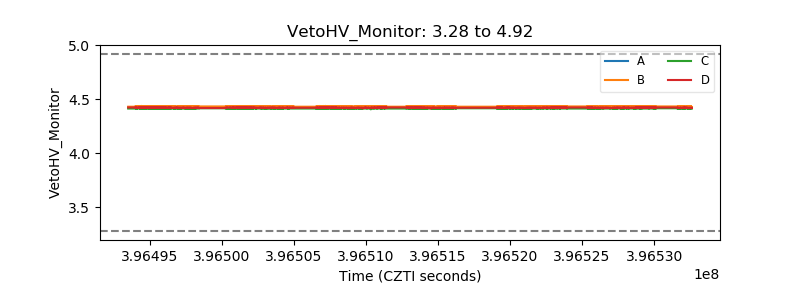 |
| Veto LLD | 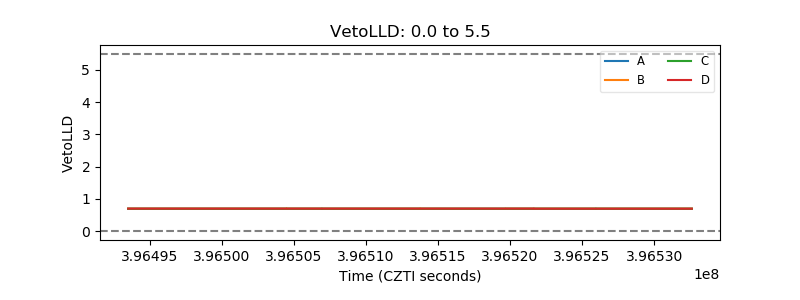 |
| Alpha Counter | 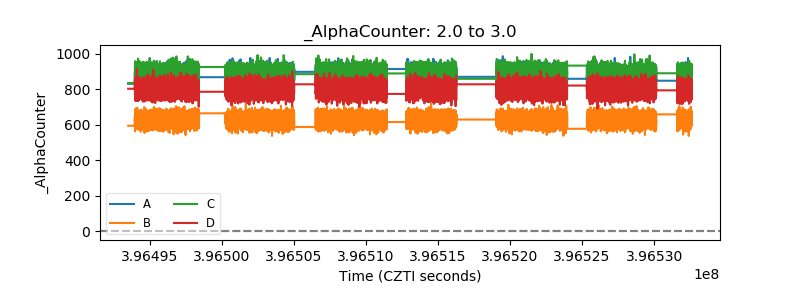 |
| _CPM_Rate | 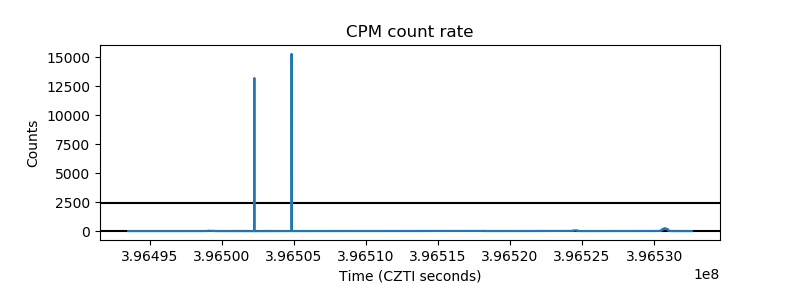 |
| CZT Counter | 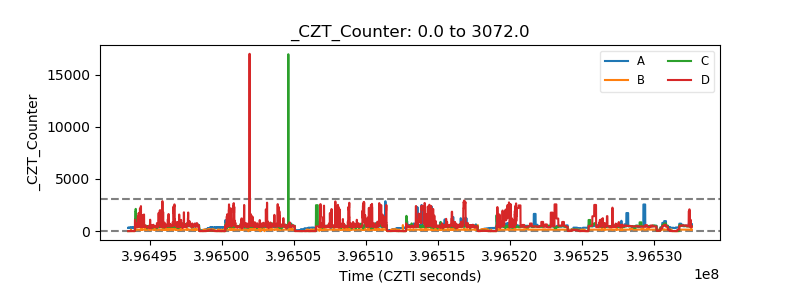 |
| +2.5 Volts monitor | 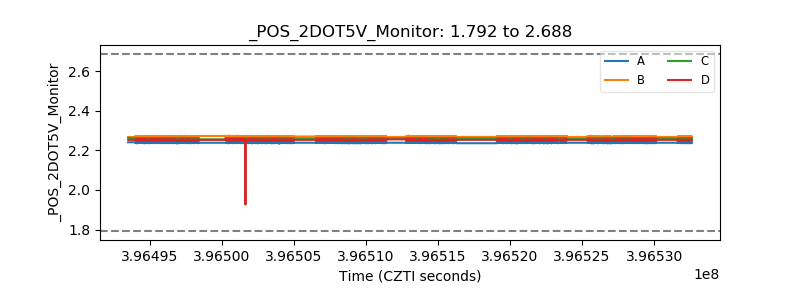 |
| +5 Volts monitor | 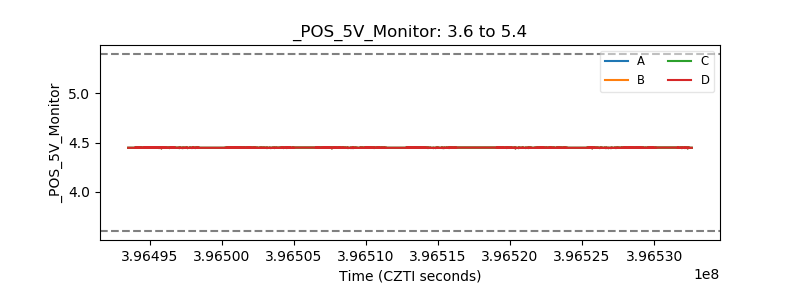 |
| _ROLL_ROT | 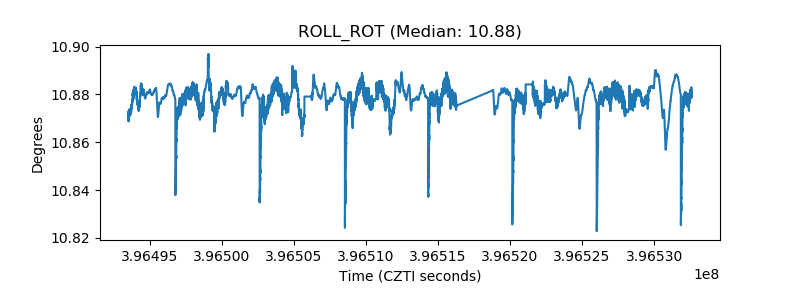 |
| _Roll_DEC | 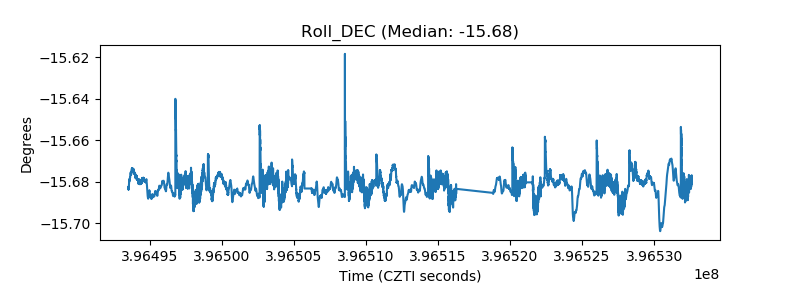 |
| _Roll_RA | 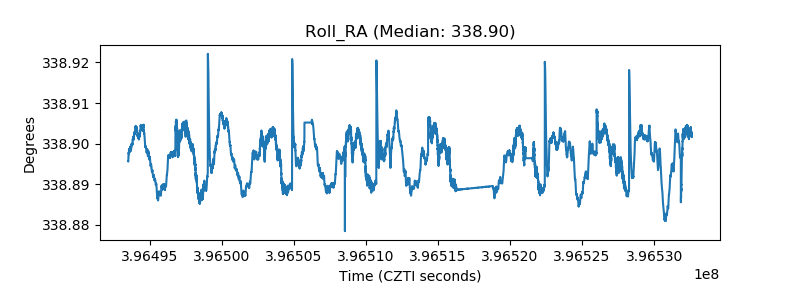 |
| Veto Counter | 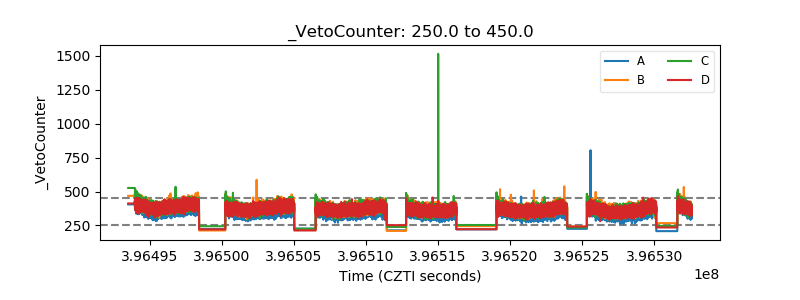 |