| Param | Original file | Final file |
|---|---|---|
| Filename | modeM0/AS1C07_010T01_9000005246_36907cztM0_level2.evt | modeM0/AS1C07_010T01_9000005246_36907cztM0_level2_quad_clean.evt |
| Size (bytes) | 1,290,447,360 | 177,154,560 |
| Size | 1.2 GB | 168.9 MB |
| Events in quadrant A | 10,605,485 | 1,370,355 |
| Events in quadrant B | 3,011,874 | 21,176 |
| Events in quadrant C | 9,846,991 | 1,332,902 |
| Events in quadrant D | 14,252,596 | 1,265,579 |
| Mode SS | |||
|---|---|---|---|
| Quadrant | BADHDUFLAG | Total packets | Discarded packets |
| A | 0 | 406 | 0 |
| B | 0 | 406 | 0 |
| C | 0 | 406 | 0 |
| D | 0 | 406 | 0 |
| Mode M9 | |||
|---|---|---|---|
| Quadrant | BADHDUFLAG | Total packets | Discarded packets |
| A | 0 | 57 | 0 |
| B | 0 | 57 | 0 |
| C | 0 | 57 | 0 |
| D | 0 | 57 | 0 |
| Mode M0 | |||
|---|---|---|---|
| Quadrant | BADHDUFLAG | Total packets | Discarded packets |
| A | 0 | 44263 | 5 |
| B | 0 | 20135 | 4 |
| C | 0 | 41298 | 4 |
| D | 0 | 55910 | 4 |
| Quadrant | Total seconds | Saturated seconds | Saturation percentage |
|---|---|---|---|
| A | 19880 | 228 | 1.146881% |
| B | 19880 | 19880 | 100.000000% |
| C | 19880 | 94 | 0.472837% |
| D | 19880 | 1379 | 6.936620% |
Noise dominated data is calculated using 1-second bins in cleaned event files. If a bin has >2000 counts, and if more than 50% of those come from <1% of pixels, then it is considered to be noise-dominated and hence unusable.
| Quadrant | # 1 sec bins | Bins with >0 counts | Bins with >2000 counts | High rate bins dominated by noise | Noise dominated (total time) | Noise dominated (detector-on time) | Marked lightcurve |
|---|---|---|---|---|---|---|---|
| A | 25612 | 19884 | 149 | 149 | 0.58% | 0.75% | 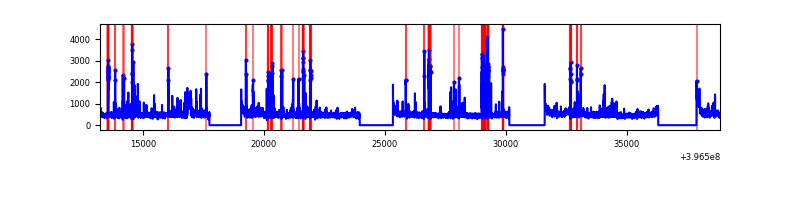 |
| B | 25611 | 19879 | 2 | 2 | 0.01% | 0.01% | 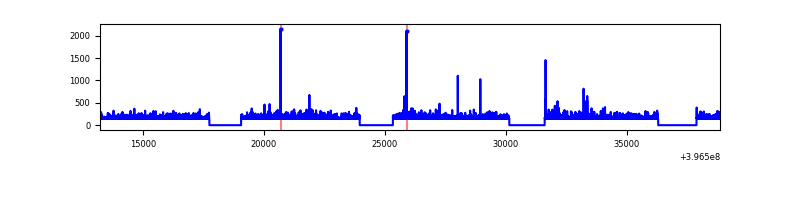 |
| C | 25612 | 19884 | 75 | 75 | 0.29% | 0.38% | 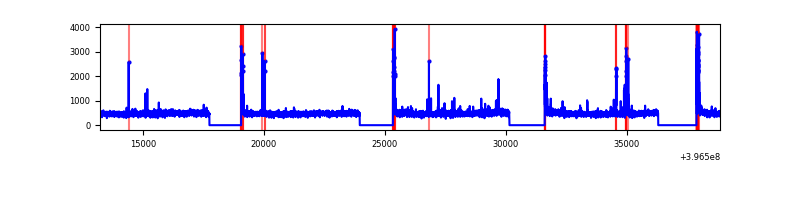 |
| D | 25612 | 19884 | 1230 | 1230 | 4.80% | 6.19% | 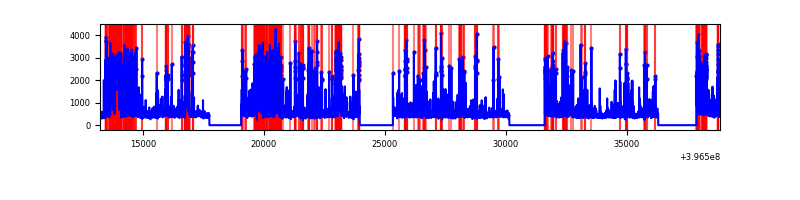 |
Top three noisy pixels from each quadrant. If the there are fewer than three noisy pixels in the level2.evt file, extra rows are filled as -1
| Pixel properties | Quadrant properties | ||||||
|---|---|---|---|---|---|---|---|
| Quadrant | DetID | PixID | Counts | Sigma | Mean | Median | Sigma |
| A | 15 | 223 | 918512 | 2036.08 | 2239 | 2189 | 450.0 |
| A | 10 | 83 | 653652 | 1447.56 | 2239 | 2189 | 450.0 |
| A | 7 | 16 | 244195 | 537.74 | 2239 | 2189 | 450.0 |
| B | 12 | 243 | 2758001 | 267441.42 | 43 | 42 | 10.3 |
| B | 12 | 144 | 52666 | 5102.99 | 43 | 42 | 10.3 |
| B | 5 | 255 | 7734 | 745.9 | 43 | 42 | 10.3 |
| C | 15 | 214 | 833497 | 1640.72 | 2188 | 2203 | 506.7 |
| C | 0 | 10 | 361615 | 709.37 | 2188 | 2203 | 506.7 |
| C | 0 | 207 | 116347 | 225.28 | 2188 | 2203 | 506.7 |
| D | 13 | 249 | 1361900 | 2598.89 | 2137 | 2080 | 523.2 |
| D | 12 | 233 | 1326470 | 2531.17 | 2137 | 2080 | 523.2 |
| D | 10 | 253 | 1039788 | 1983.27 | 2137 | 2080 | 523.2 |
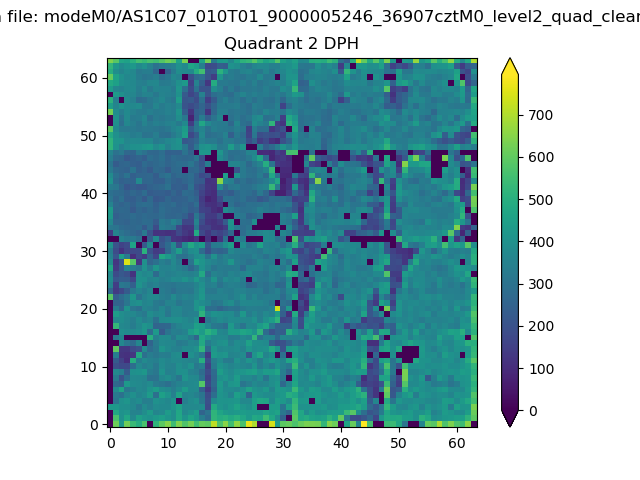
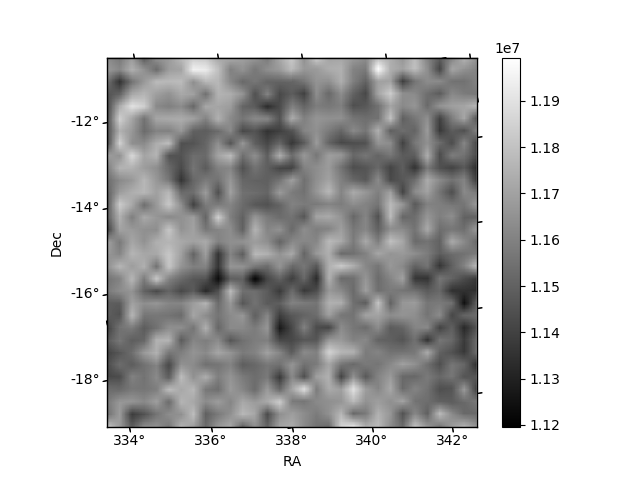
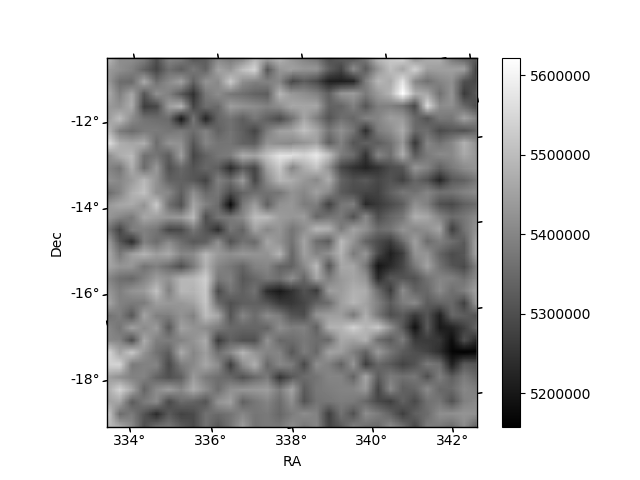
Histogram calculated using DETX and DETY for each event in the final _common_clean file
| Quadrant A |  |
 |
Quadrant B |
|---|---|---|---|
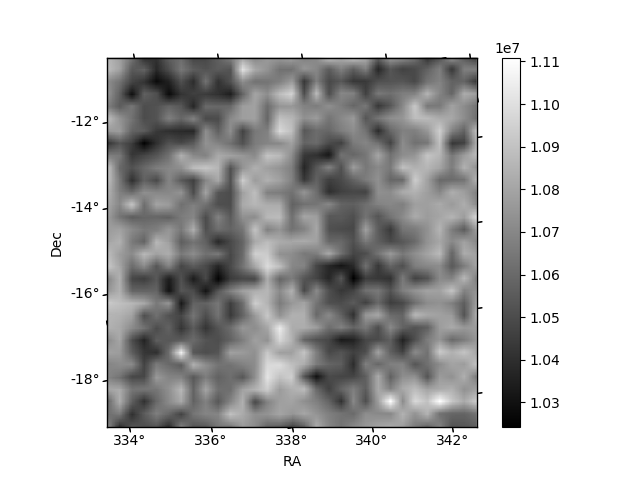
| Quadrant D |  |
 |
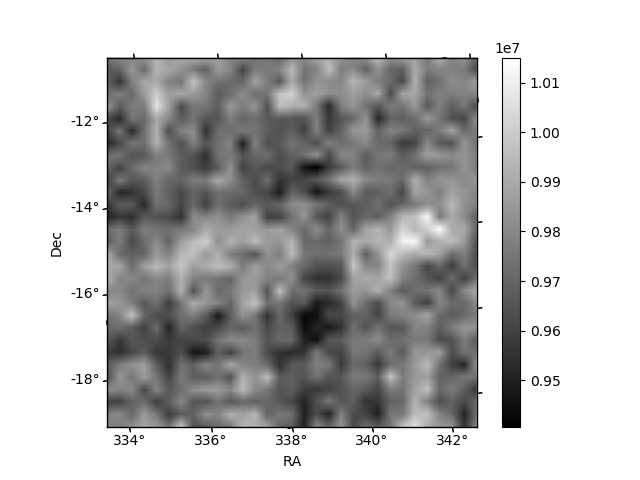
Quadrant C |
| Plot type | Count rate plots | Images |
|---|---|---|
| Comparison with Poisson distribution Blue bars denote a histogram of data divided into 1 sec bins. Red curve is a Poisson curve with rate = median count rate of data. |
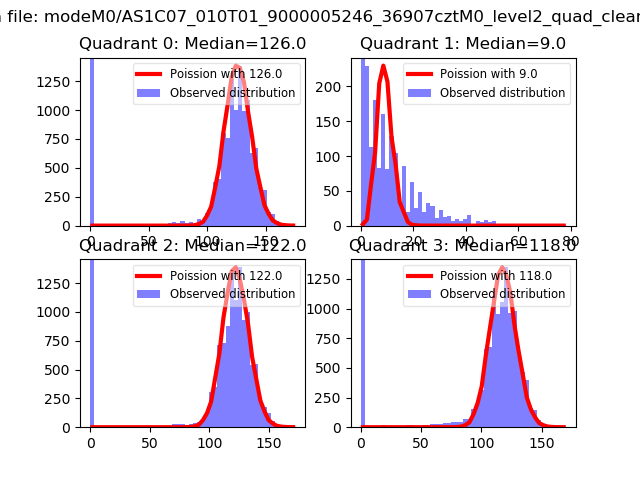 |
 |
| Quadrant-wise count rates Data is divided into 100 sec bins |
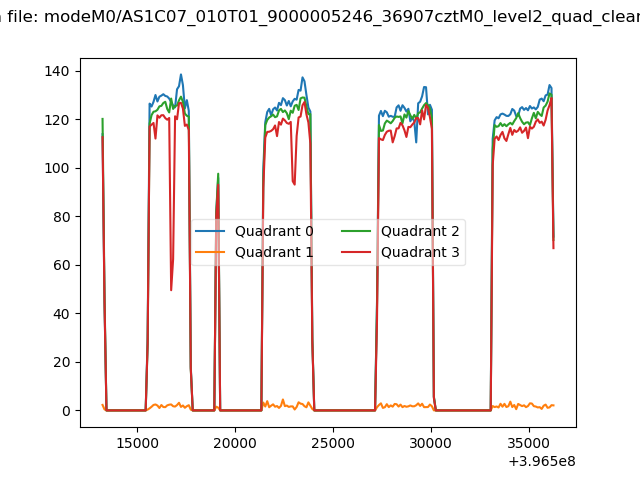 |
|
| Module-wise count rates for Quadrant A Data is divided into 100 sec bins |
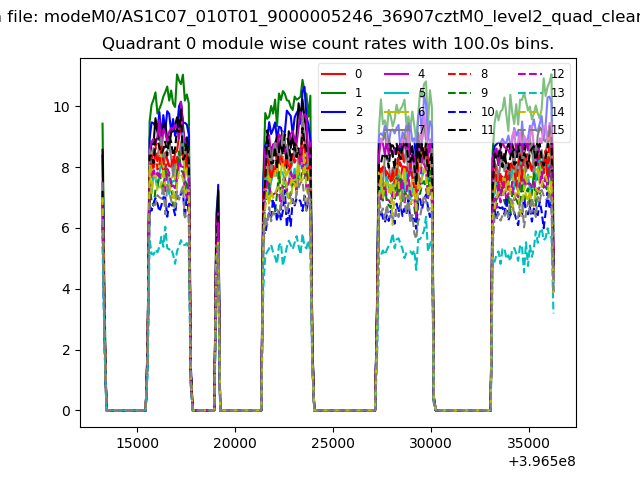 |
 |
| Module-wise count rates for Quadrant B Data is divided into 100 sec bins |
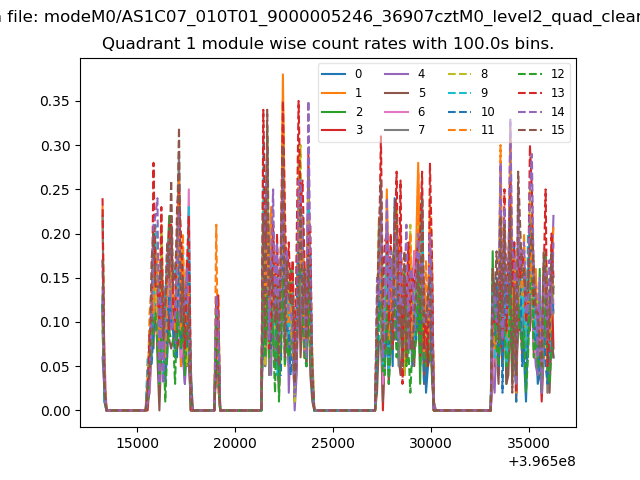 |
 |
| Module-wise count rates for Quadrant C Data is divided into 100 sec bins |
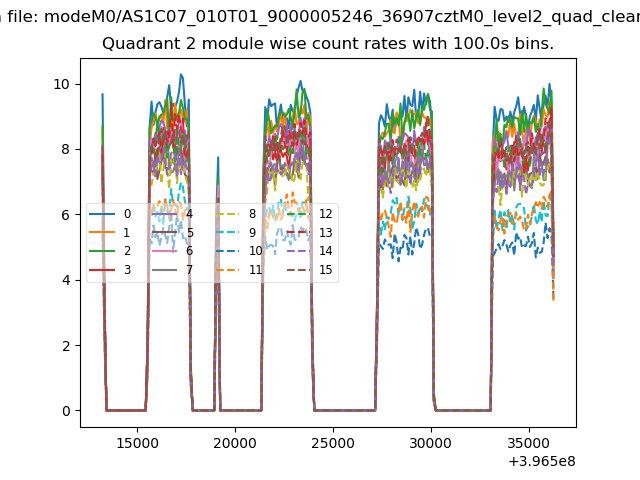 |
 |
| Module-wise count rates for Quadrant D Data is divided into 100 sec bins |
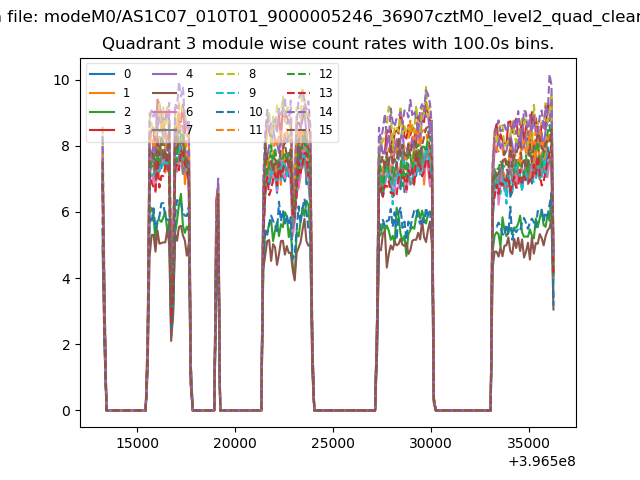 |
 |
| Parameter | Plot |
|---|---|
| CZT HV Monitor | 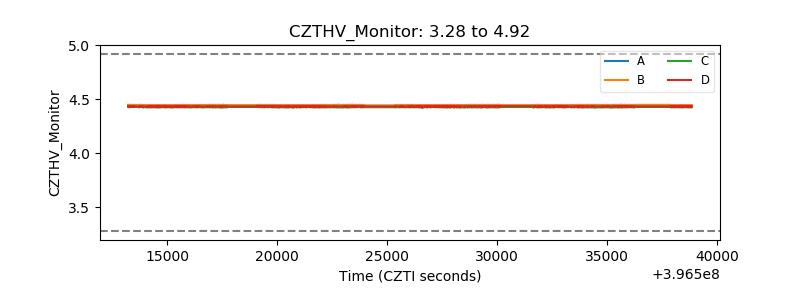 |
| D_VDD | 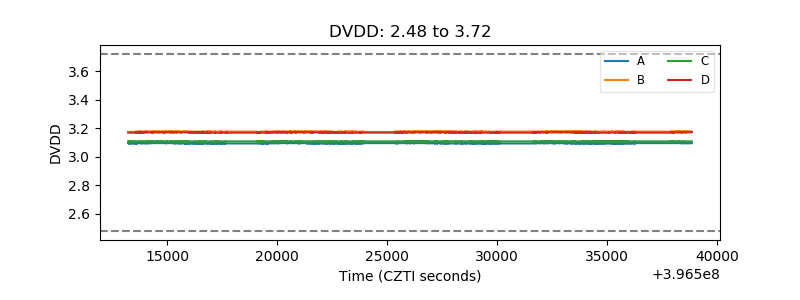 |
| Temperature 1 | 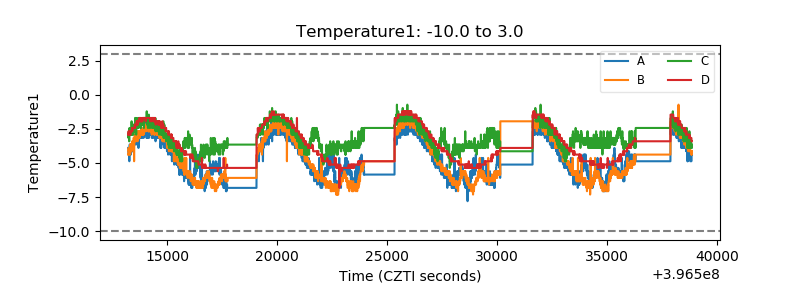 |
| Veto HV Monitor | 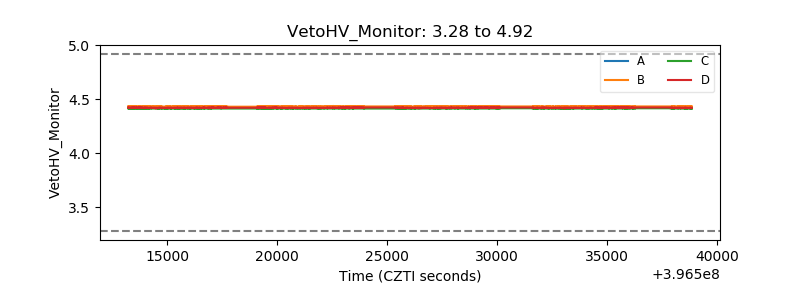 |
| Veto LLD | 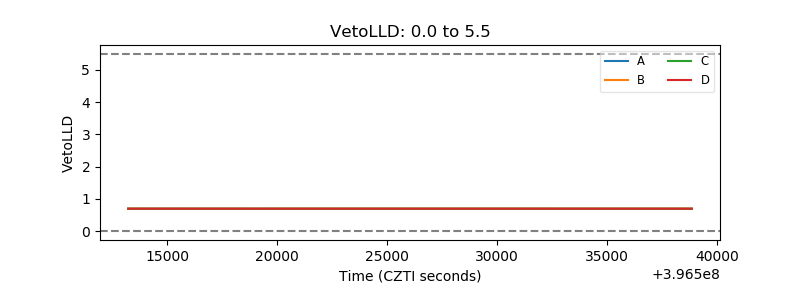 |
| Alpha Counter | 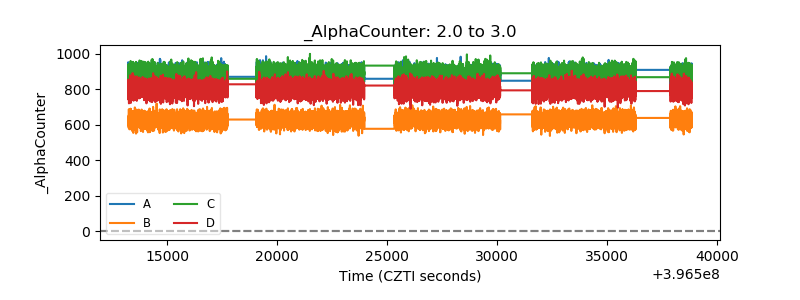 |
| _CPM_Rate | 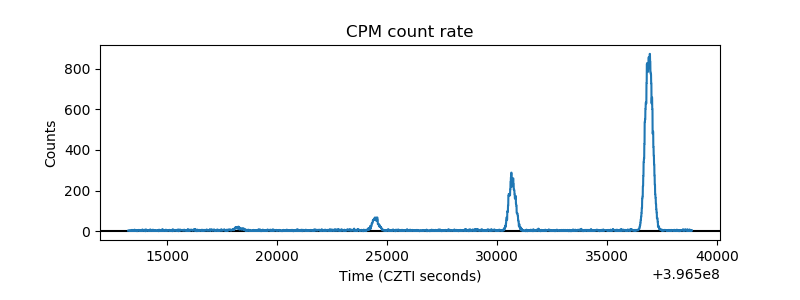 |
| CZT Counter | 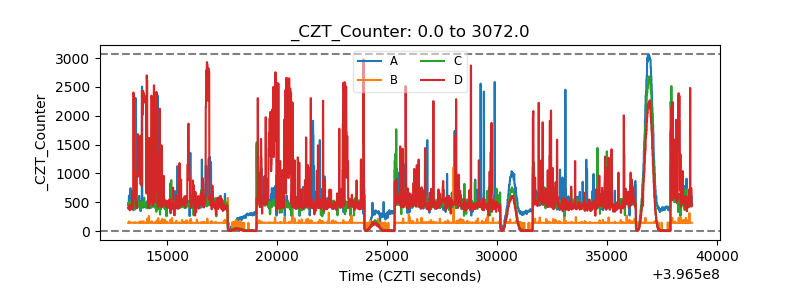 |
| +2.5 Volts monitor |  |
| +5 Volts monitor | 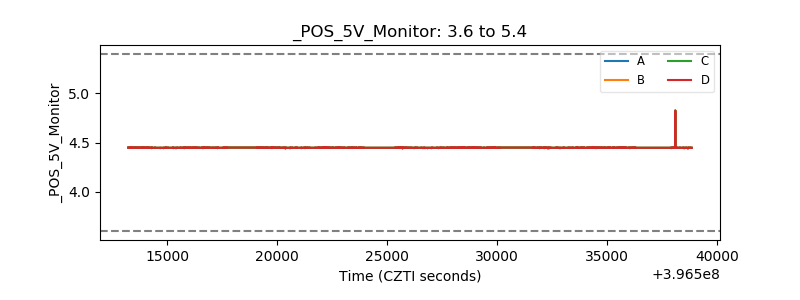 |
| _ROLL_ROT | 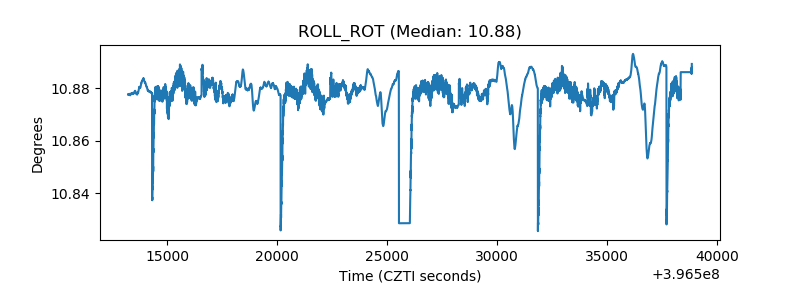 |
| _Roll_DEC | 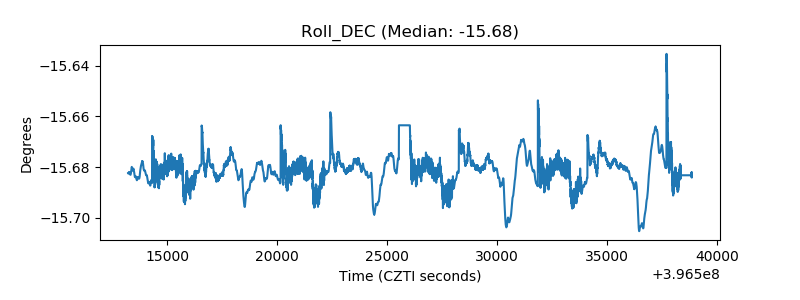 |
| _Roll_RA | 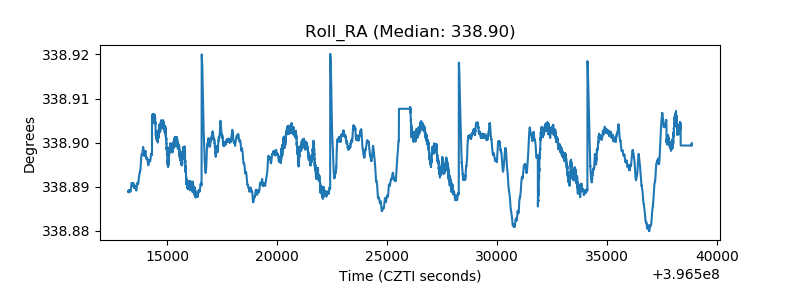 |
| Veto Counter | 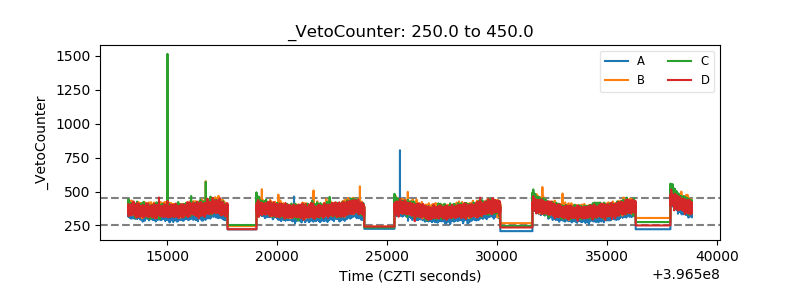 |