| Param | Original file | Final file |
|---|---|---|
| Filename | modeM0/AS1C07_010T01_9000005246_36910cztM0_level2.evt | modeM0/AS1C07_010T01_9000005246_36910cztM0_level2_quad_clean.evt |
| Size (bytes) | 330,186,240 | 67,265,280 |
| Size | 314.9 MB | 64.1 MB |
| Events in quadrant A | 2,783,672 | 563,672 |
| Events in quadrant B | 812,806 | 9,387 |
| Events in quadrant C | 2,828,556 | 555,077 |
| Events in quadrant D | 3,203,518 | 530,771 |
| Mode SS | |||
|---|---|---|---|
| Quadrant | BADHDUFLAG | Total packets | Discarded packets |
| A | 0 | 112 | 0 |
| B | 0 | 112 | 0 |
| C | 0 | 112 | 0 |
| D | 0 | 112 | 0 |
| Mode M9 | |||
|---|---|---|---|
| Quadrant | BADHDUFLAG | Total packets | Discarded packets |
| A | 0 | 36 | 0 |
| B | 0 | 36 | 0 |
| C | 0 | 36 | 0 |
| D | 0 | 36 | 0 |
| Mode M0 | |||
|---|---|---|---|
| Quadrant | BADHDUFLAG | Total packets | Discarded packets |
| A | 0 | 11668 | 3 |
| B | 0 | 5434 | 2 |
| C | 0 | 11526 | 2 |
| D | 0 | 13183 | 2 |
| Quadrant | Total seconds | Saturated seconds | Saturation percentage |
|---|---|---|---|
| A | 5364 | 20 | 0.372856% |
| B | 5364 | 5364 | 100.000000% |
| C | 5364 | 44 | 0.820283% |
| D | 5364 | 114 | 2.125280% |
Noise dominated data is calculated using 1-second bins in cleaned event files. If a bin has >2000 counts, and if more than 50% of those come from <1% of pixels, then it is considered to be noise-dominated and hence unusable.
| Quadrant | # 1 sec bins | Bins with >0 counts | Bins with >2000 counts | High rate bins dominated by noise | Noise dominated (total time) | Noise dominated (detector-on time) | Marked lightcurve |
|---|---|---|---|---|---|---|---|
| A | 8920 | 5366 | 3 | 3 | 0.03% | 0.06% | 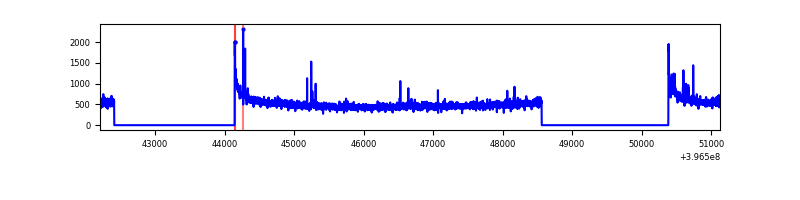 |
| B | 8919 | 5363 | 0 | 0 | 0.00% | 0.00% | 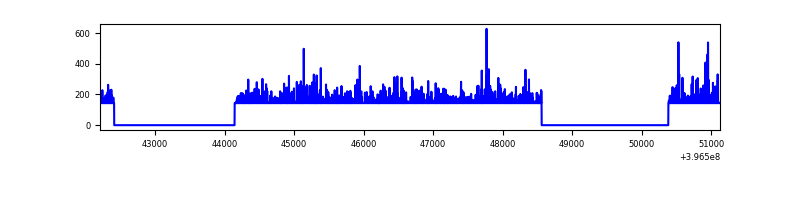 |
| C | 8920 | 5366 | 31 | 31 | 0.35% | 0.58% | 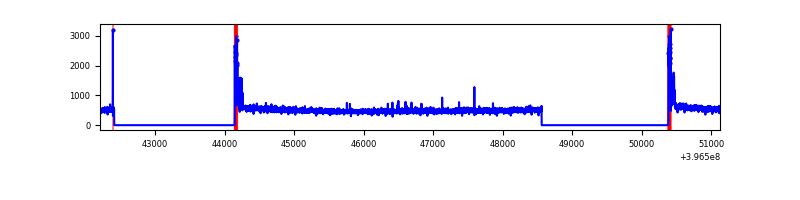 |
| D | 8920 | 5366 | 111 | 111 | 1.24% | 2.07% | 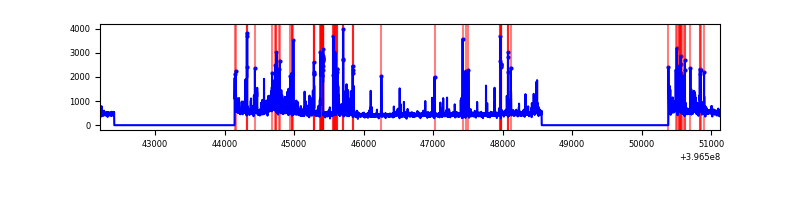 |
Top three noisy pixels from each quadrant. If the there are fewer than three noisy pixels in the level2.evt file, extra rows are filled as -1
| Pixel properties | Quadrant properties | ||||||
|---|---|---|---|---|---|---|---|
| Quadrant | DetID | PixID | Counts | Sigma | Mean | Median | Sigma |
| A | 10 | 83 | 230212 | 1782.11 | 640 | 628 | 128.8 |
| A | 15 | 223 | 27338 | 207.33 | 640 | 628 | 128.8 |
| A | 9 | 143 | 24416 | 184.65 | 640 | 628 | 128.8 |
| B | 12 | 243 | 744825 | 181482.78 | 11 | 11 | 4.1 |
| B | 12 | 144 | 13642 | 3321.36 | 11 | 11 | 4.1 |
| B | 5 | 255 | 2151 | 521.44 | 11 | 11 | 4.1 |
| C | 15 | 214 | 230989 | 1570.65 | 625 | 630 | 146.7 |
| C | 0 | 10 | 153609 | 1043.06 | 625 | 630 | 146.7 |
| C | 15 | 159 | 6357 | 39.05 | 625 | 630 | 146.7 |
| D | 4 | 239 | 180000 | 1180.98 | 621 | 606 | 151.9 |
| D | 2 | 153 | 134779 | 883.28 | 621 | 606 | 151.9 |
| D | 7 | 38 | 98292 | 643.08 | 621 | 606 | 151.9 |
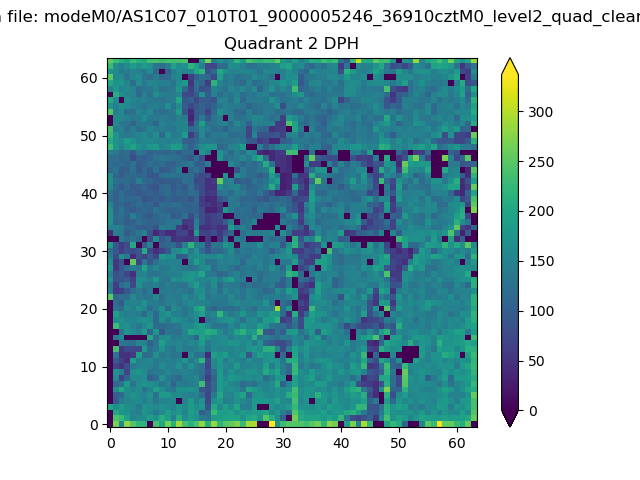
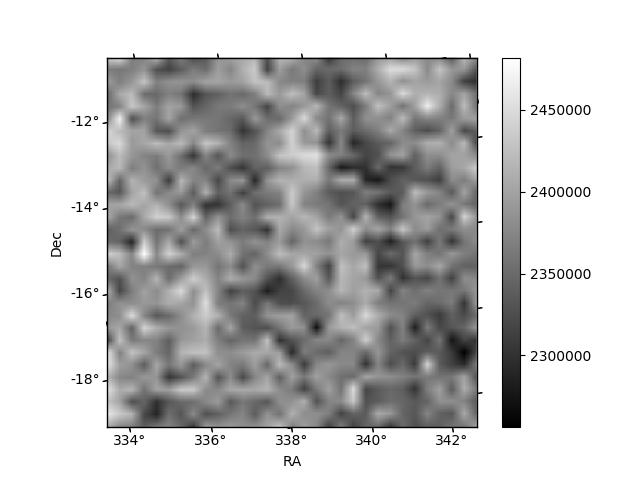
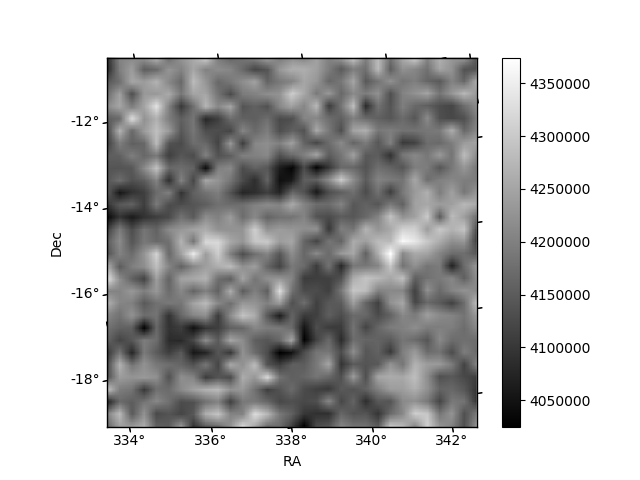
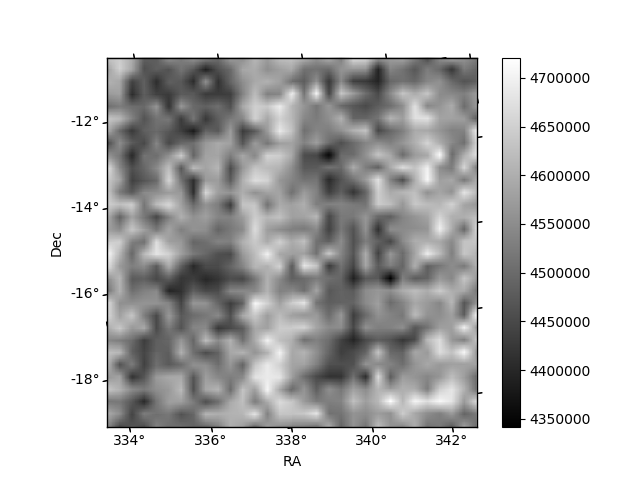
Histogram calculated using DETX and DETY for each event in the final _common_clean file
| Quadrant A | 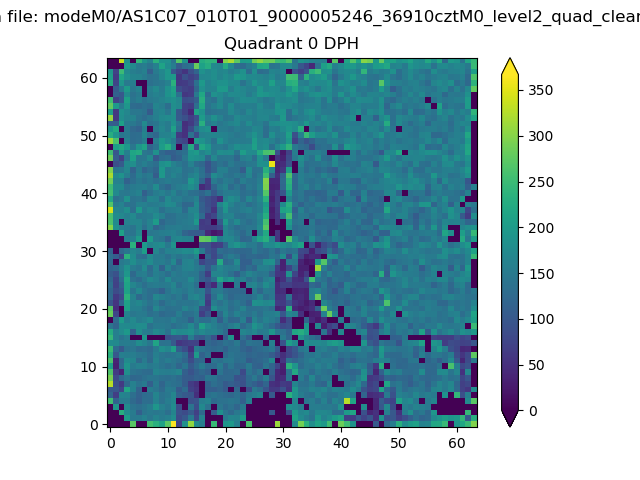 |
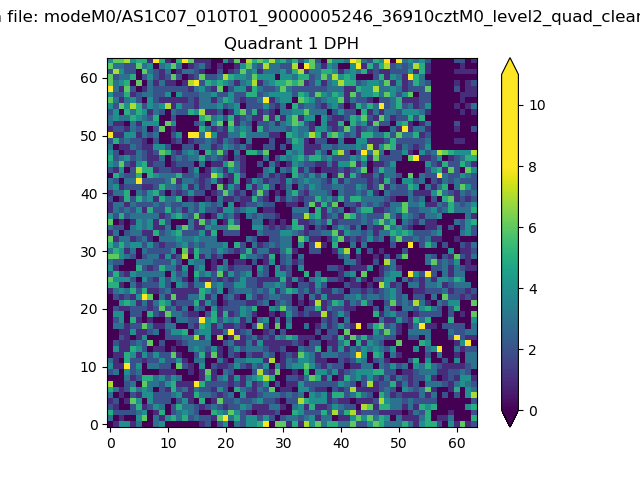 |
Quadrant B |
|---|---|---|---|
| Quadrant D | 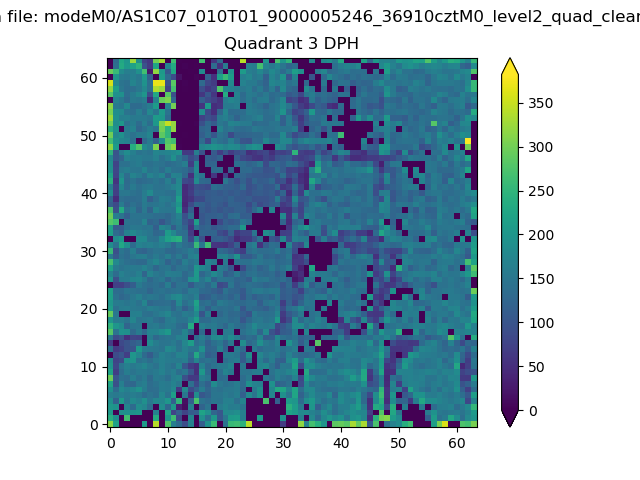 |
 |
Quadrant C |
| Plot type | Count rate plots | Images |
|---|---|---|
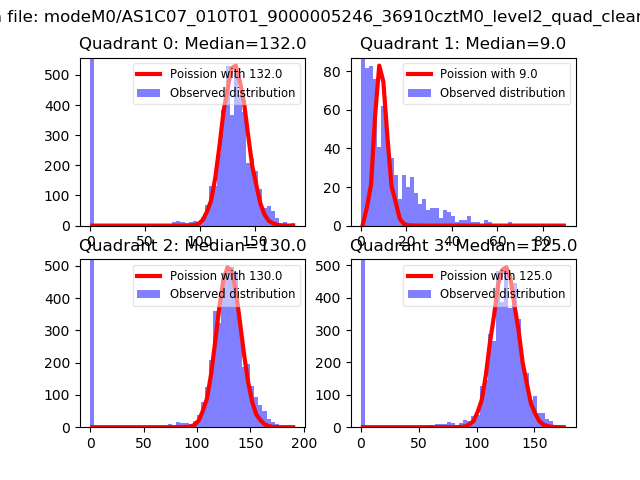
| Comparison with Poisson distribution Blue bars denote a histogram of data divided into 1 sec bins. Red curve is a Poisson curve with rate = median count rate of data. |
 |
 |
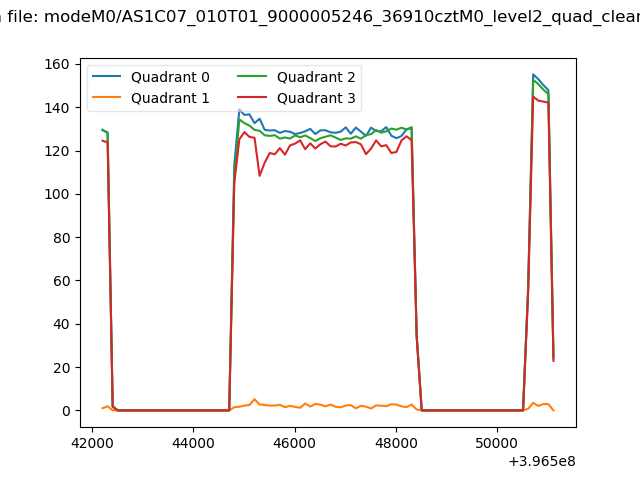
| Quadrant-wise count rates Data is divided into 100 sec bins |
 |
|
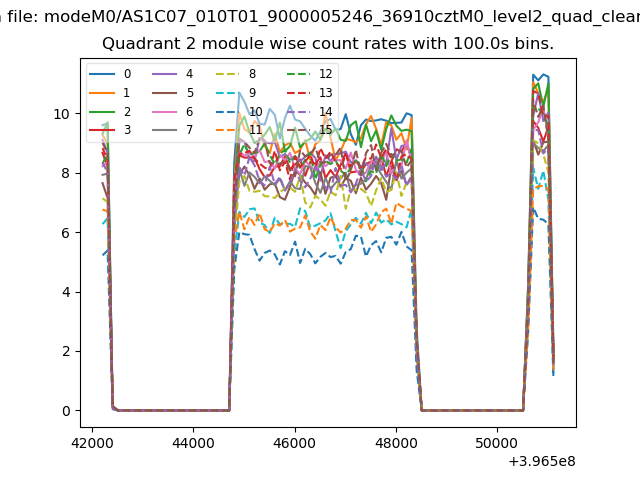
| Module-wise count rates for Quadrant A Data is divided into 100 sec bins |
 |
 |
| Module-wise count rates for Quadrant B Data is divided into 100 sec bins |
 |
 |
| Module-wise count rates for Quadrant C Data is divided into 100 sec bins |
 |
 |
| Module-wise count rates for Quadrant D Data is divided into 100 sec bins |
 |
 |
| Parameter | Plot |
|---|---|
| CZT HV Monitor | 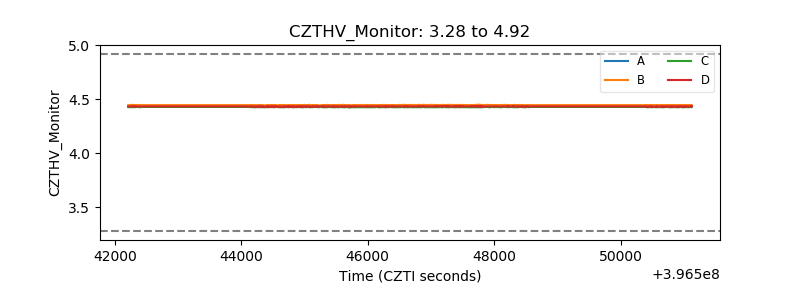 |
| D_VDD | 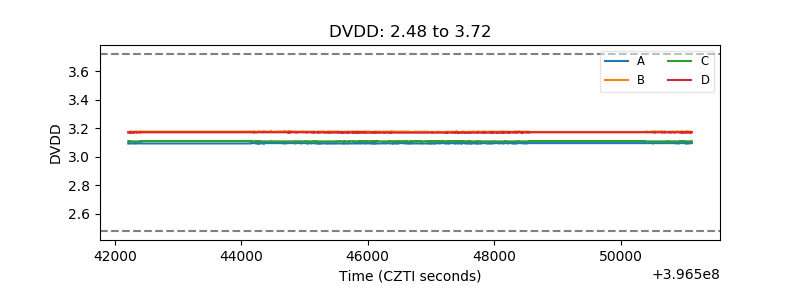 |
| Temperature 1 | 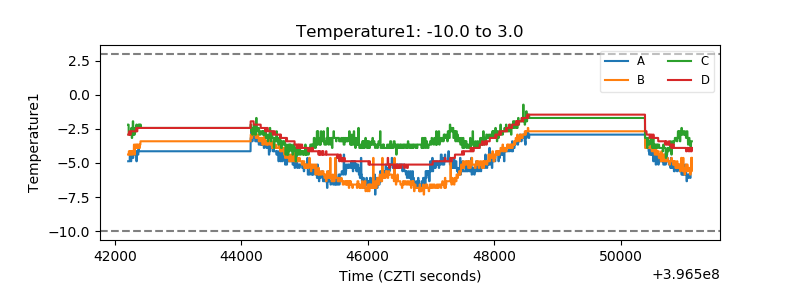 |
| Veto HV Monitor | 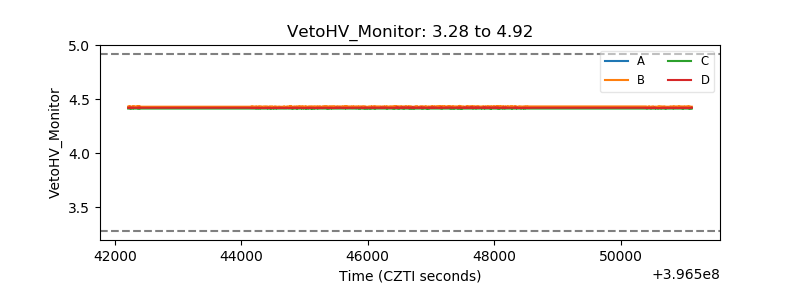 |
| Veto LLD |  |
| Alpha Counter | 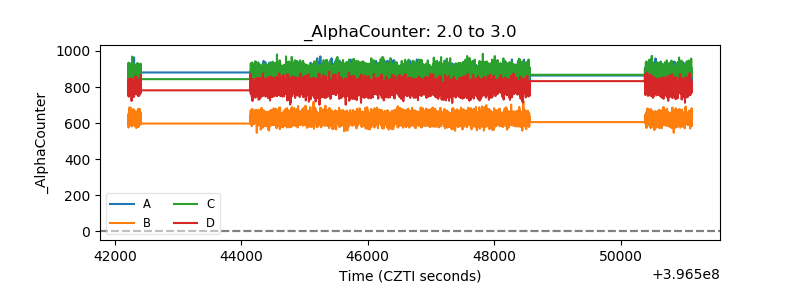 |
| _CPM_Rate | 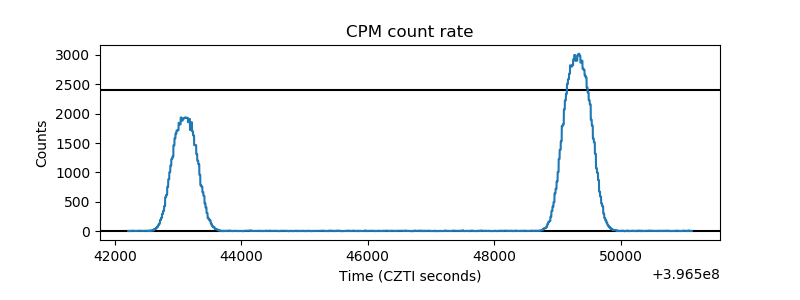 |
| CZT Counter | 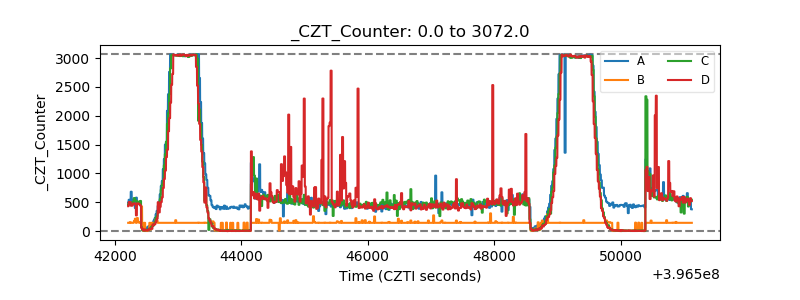 |
| +2.5 Volts monitor |  |
| +5 Volts monitor |  |
| _ROLL_ROT | 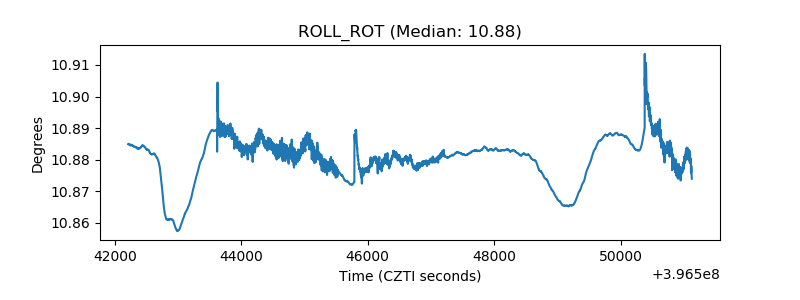 |
| _Roll_DEC | 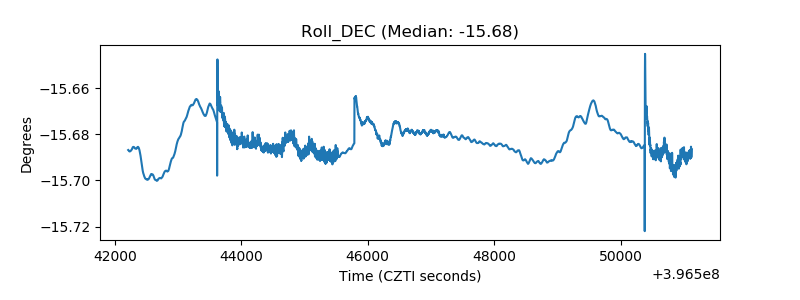 |
| _Roll_RA |  |
| Veto Counter |  |