| Param | Original file | Final file |
|---|---|---|
| Filename | modeM0/AS1C07_010T01_9000005246_36912cztM0_level2.evt | modeM0/AS1C07_010T01_9000005246_36912cztM0_level2_quad_clean.evt |
| Size (bytes) | 315,077,760 | 71,156,160 |
| Size | 300.5 MB | 67.9 MB |
| Events in quadrant A | 2,617,648 | 606,303 |
| Events in quadrant B | 752,154 | 8,364 |
| Events in quadrant C | 2,818,456 | 610,563 |
| Events in quadrant D | 3,008,594 | 577,354 |
| Mode SS | |||
|---|---|---|---|
| Quadrant | BADHDUFLAG | Total packets | Discarded packets |
| A | 0 | 100 | 0 |
| B | 0 | 100 | 0 |
| C | 0 | 100 | 0 |
| D | 0 | 100 | 0 |
| Mode M9 | |||
|---|---|---|---|
| Quadrant | BADHDUFLAG | Total packets | Discarded packets |
| A | 0 | 30 | 0 |
| B | 0 | 30 | 0 |
| C | 0 | 30 | 0 |
| D | 0 | 31 | 0 |
| Mode M0 | |||
|---|---|---|---|
| Quadrant | BADHDUFLAG | Total packets | Discarded packets |
| A | 0 | 10845 | 3 |
| B | 0 | 5039 | 2 |
| C | 0 | 11227 | 2 |
| D | 0 | 12219 | 2 |
| Quadrant | Total seconds | Saturated seconds | Saturation percentage |
|---|---|---|---|
| A | 4997 | 9 | 0.180108% |
| B | 4997 | 4997 | 100.000000% |
| C | 4997 | 49 | 0.980588% |
| D | 4997 | 156 | 3.121873% |
Noise dominated data is calculated using 1-second bins in cleaned event files. If a bin has >2000 counts, and if more than 50% of those come from <1% of pixels, then it is considered to be noise-dominated and hence unusable.
| Quadrant | # 1 sec bins | Bins with >0 counts | Bins with >2000 counts | High rate bins dominated by noise | Noise dominated (total time) | Noise dominated (detector-on time) | Marked lightcurve |
|---|---|---|---|---|---|---|---|
| A | 7060 | 4998 | 5 | 5 | 0.07% | 0.10% | 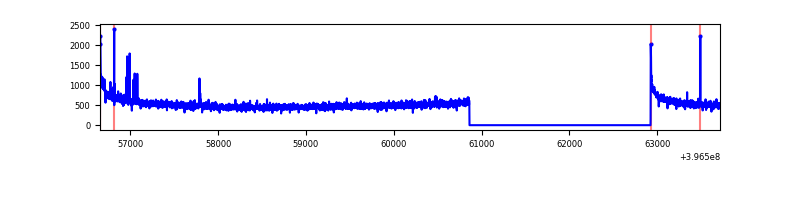 |
| B | 7059 | 4996 | 0 | 0 | 0.00% | 0.00% | 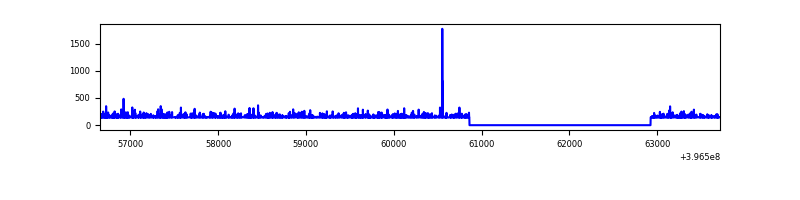 |
| C | 7060 | 4998 | 32 | 32 | 0.45% | 0.64% | 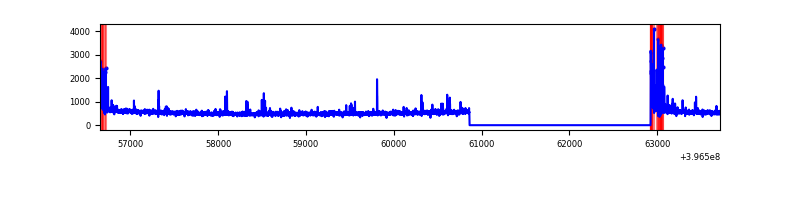 |
| D | 7060 | 4998 | 126 | 126 | 1.78% | 2.52% | 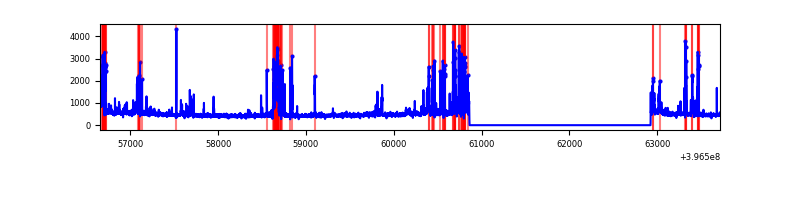 |
Top three noisy pixels from each quadrant. If the there are fewer than three noisy pixels in the level2.evt file, extra rows are filled as -1
| Pixel properties | Quadrant properties | ||||||
|---|---|---|---|---|---|---|---|
| Quadrant | DetID | PixID | Counts | Sigma | Mean | Median | Sigma |
| A | 10 | 83 | 214962 | 1774.05 | 607 | 595 | 120.8 |
| A | 9 | 143 | 31642 | 256.94 | 607 | 595 | 120.8 |
| A | 13 | 6 | 13168 | 104.05 | 607 | 595 | 120.8 |
| B | 12 | 243 | 694850 | 192701.47 | 9 | 9 | 3.6 |
| B | 12 | 144 | 12878 | 3568.98 | 9 | 9 | 3.6 |
| B | 0 | 229 | 2574 | 711.36 | 9 | 9 | 3.6 |
| C | 15 | 214 | 215271 | 1534.49 | 605 | 611 | 139.9 |
| C | 0 | 10 | 184337 | 1313.36 | 605 | 611 | 139.9 |
| C | 15 | 208 | 38904 | 273.74 | 605 | 611 | 139.9 |
| D | 13 | 249 | 399471 | 2766.59 | 593 | 580 | 144.2 |
| D | 13 | 171 | 188211 | 1301.35 | 593 | 580 | 144.2 |
| D | 12 | 233 | 37452 | 255.73 | 593 | 580 | 144.2 |
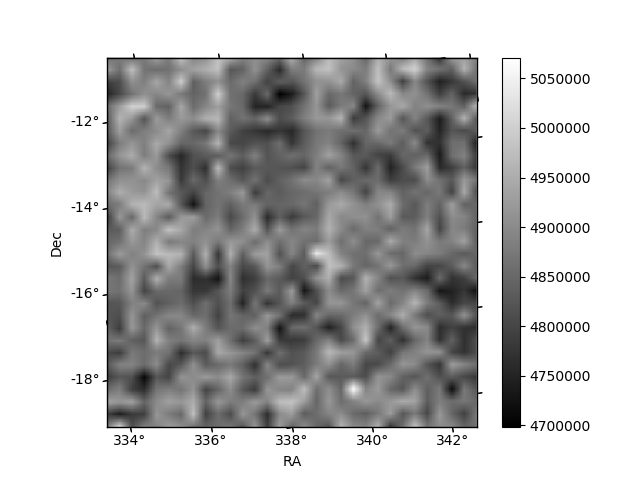
Histogram calculated using DETX and DETY for each event in the final _common_clean file
| Quadrant A |  |
 |
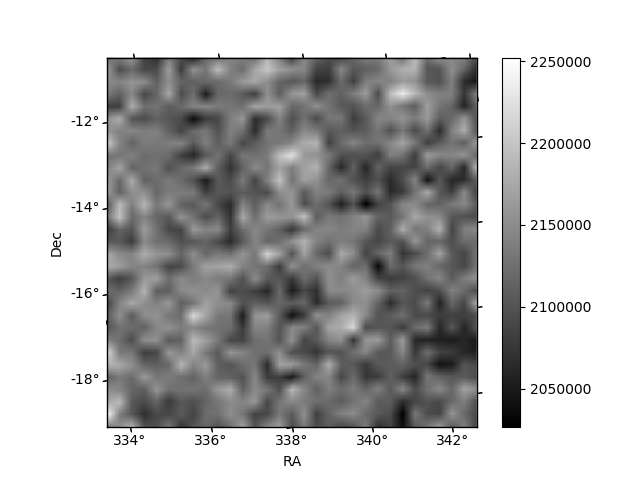
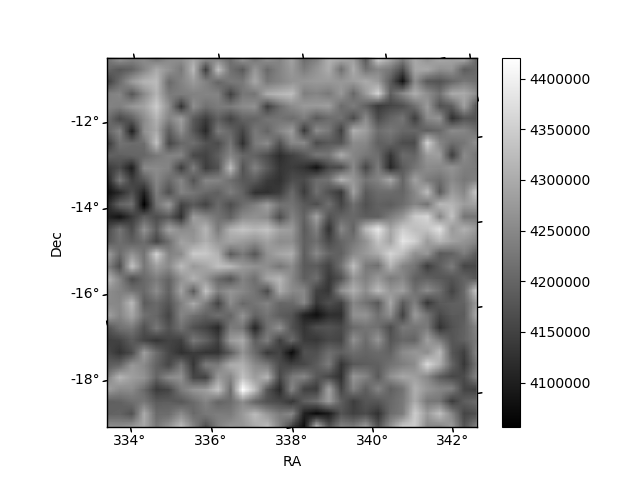
Quadrant B |
|---|---|---|---|
| Quadrant D |  |
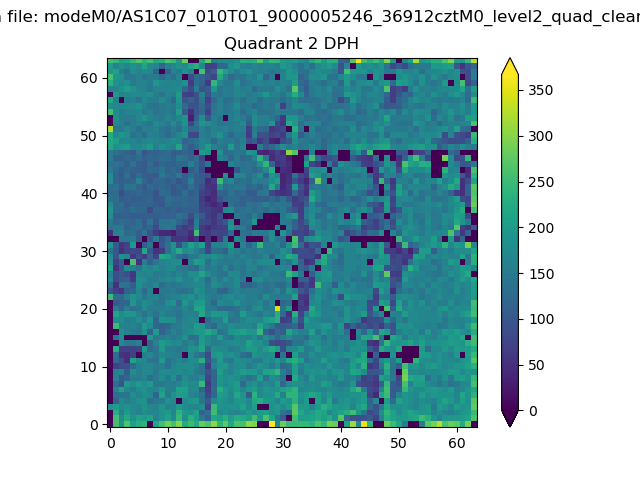 |
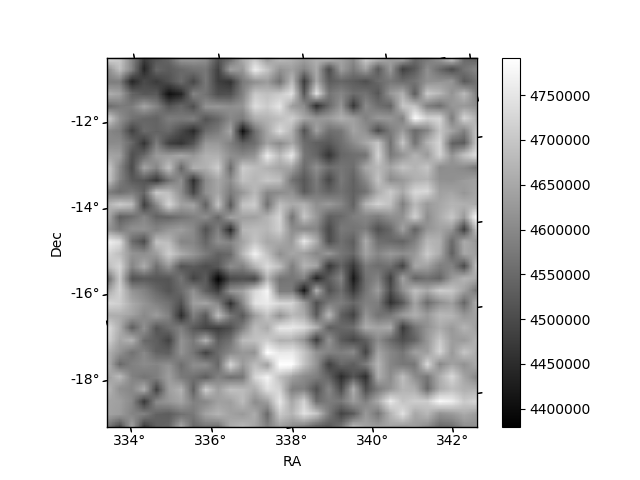
Quadrant C |
| Plot type | Count rate plots | Images |
|---|---|---|
| Comparison with Poisson distribution Blue bars denote a histogram of data divided into 1 sec bins. Red curve is a Poisson curve with rate = median count rate of data. |
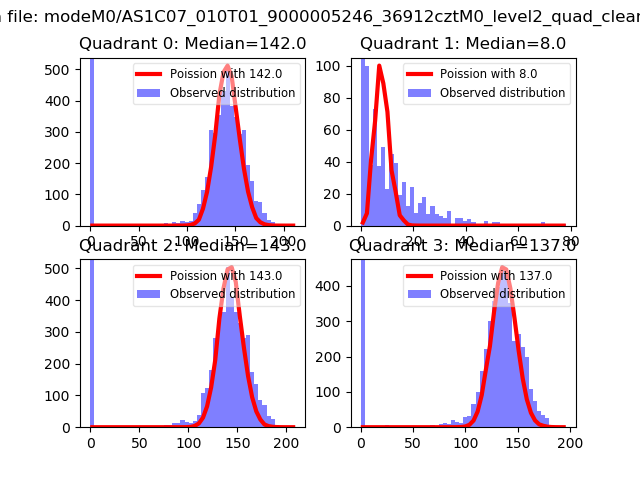 |
 |
| Quadrant-wise count rates Data is divided into 100 sec bins |
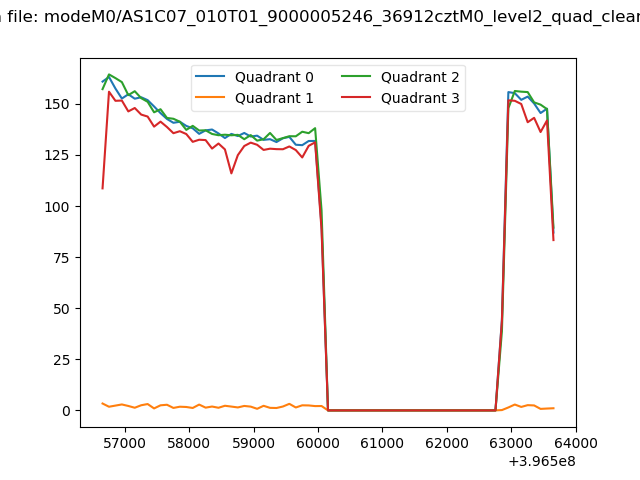 |
|
| Module-wise count rates for Quadrant A Data is divided into 100 sec bins |
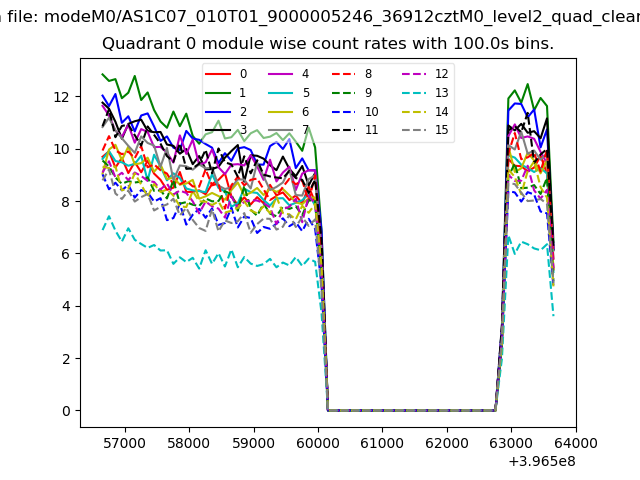 |
 |
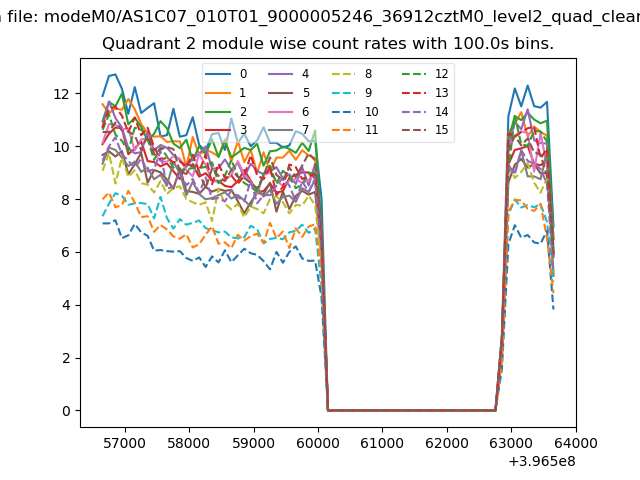
| Module-wise count rates for Quadrant B Data is divided into 100 sec bins |
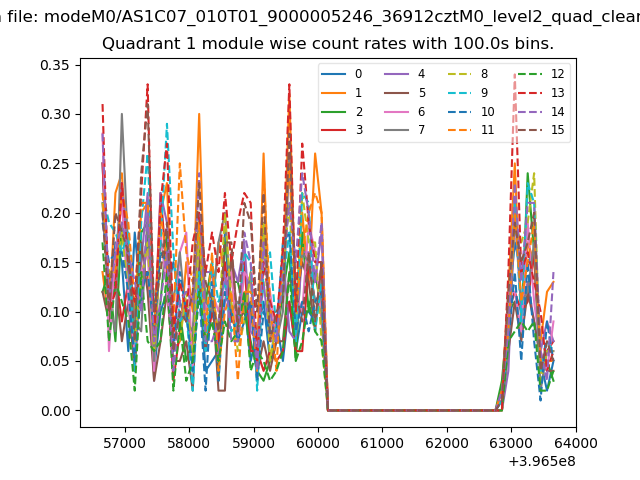 |
 |
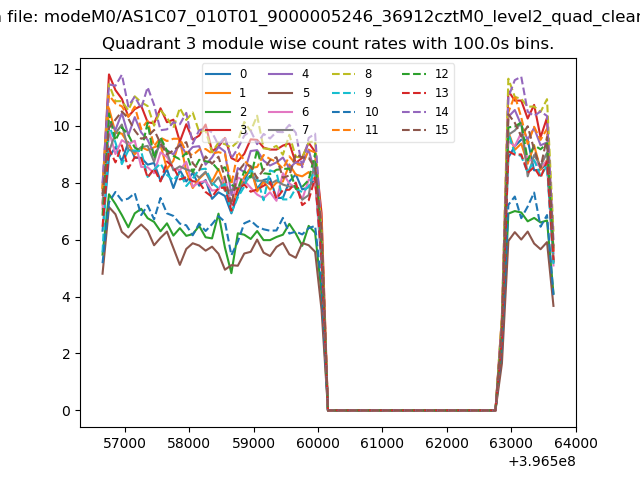
| Module-wise count rates for Quadrant C Data is divided into 100 sec bins |
 |
 |
| Module-wise count rates for Quadrant D Data is divided into 100 sec bins |
 |
 |
| Parameter | Plot |
|---|---|
| CZT HV Monitor | 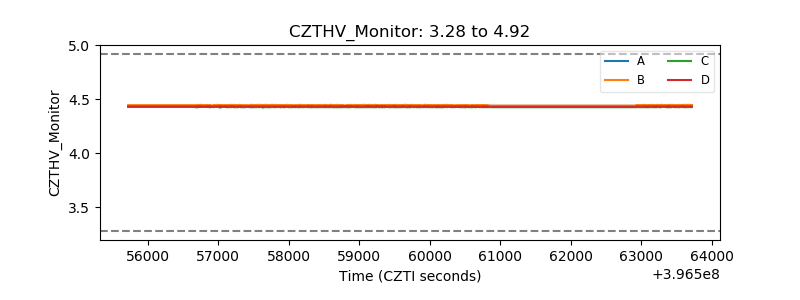 |
| D_VDD |  |
| Temperature 1 | 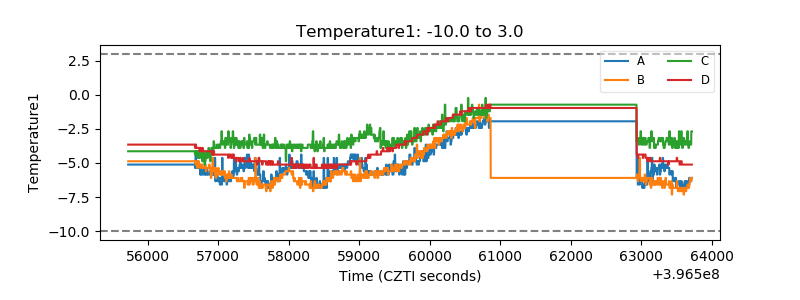 |
| Veto HV Monitor | 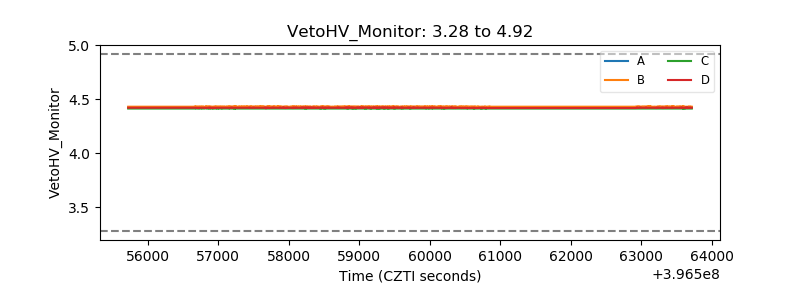 |
| Veto LLD | 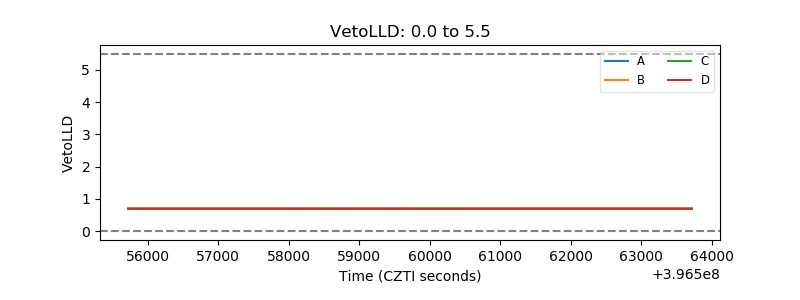 |
| Alpha Counter | 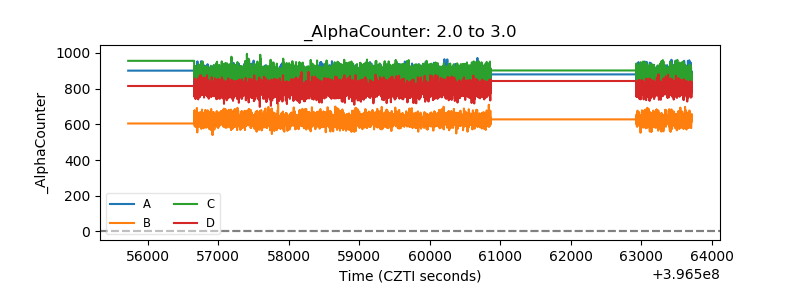 |
| _CPM_Rate | 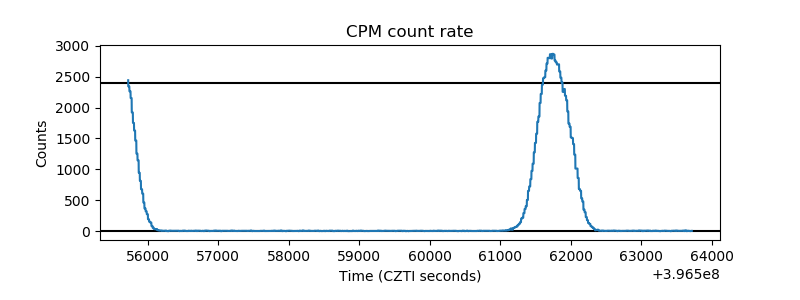 |
| CZT Counter | 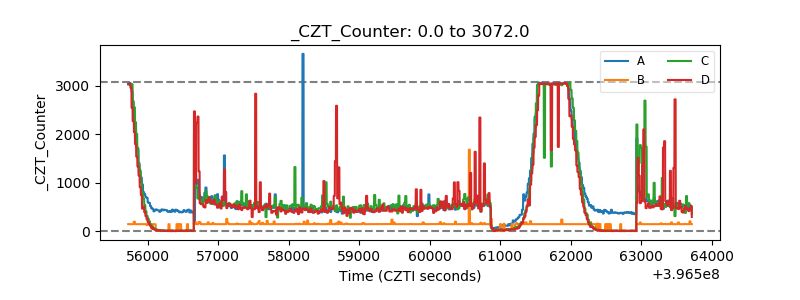 |
| +2.5 Volts monitor |  |
| +5 Volts monitor | 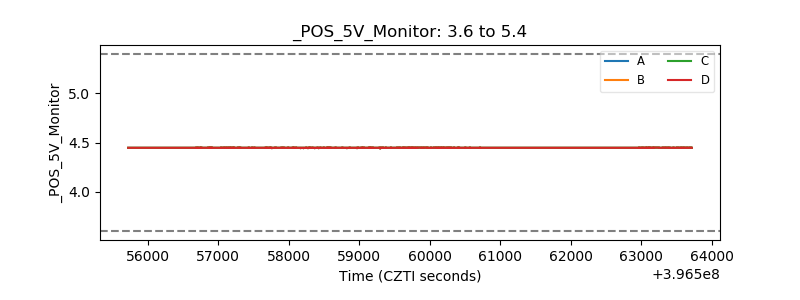 |
| _ROLL_ROT | 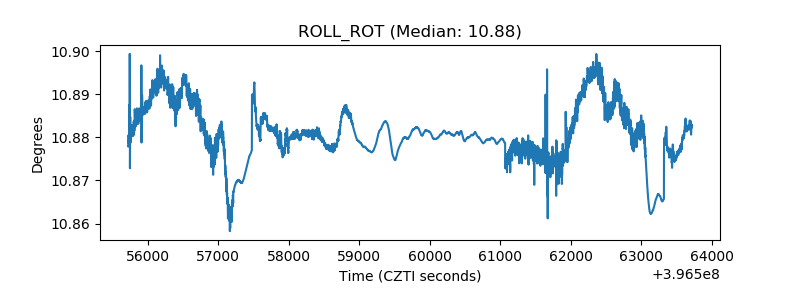 |
| _Roll_DEC | 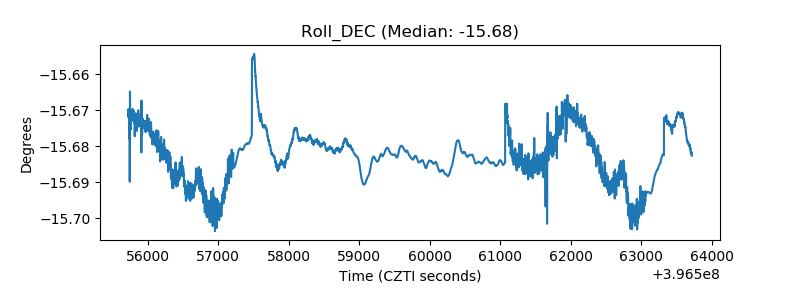 |
| _Roll_RA | 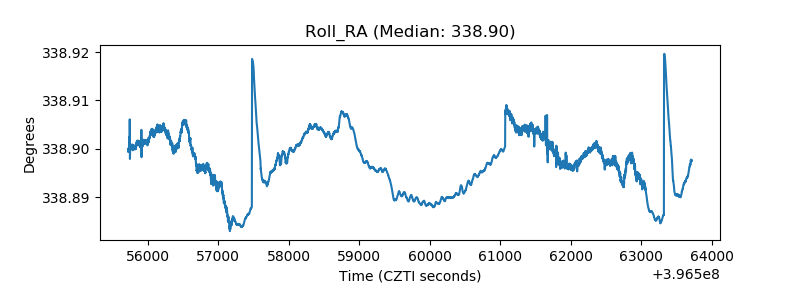 |
| Veto Counter | 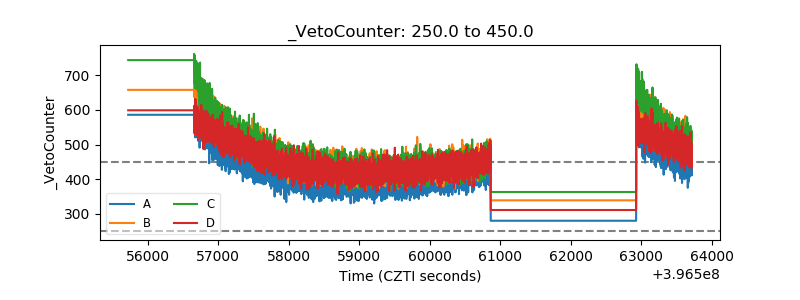 |