| Param | Original file | Final file |
|---|---|---|
| Filename | modeM0/AS1C07_010T01_9000005246_36914cztM0_level2.evt | modeM0/AS1C07_010T01_9000005246_36914cztM0_level2_quad_clean.evt |
| Size (bytes) | 310,040,640 | 55,745,280 |
| Size | 295.7 MB | 53.2 MB |
| Events in quadrant A | 2,529,129 | 449,390 |
| Events in quadrant B | 749,419 | 6,957 |
| Events in quadrant C | 2,642,717 | 452,177 |
| Events in quadrant D | 3,121,879 | 426,550 |
| Mode SS | |||
|---|---|---|---|
| Quadrant | BADHDUFLAG | Total packets | Discarded packets |
| A | 0 | 106 | 0 |
| B | 0 | 106 | 0 |
| C | 0 | 106 | 0 |
| D | 0 | 106 | 0 |
| Mode M9 | |||
|---|---|---|---|
| Quadrant | BADHDUFLAG | Total packets | Discarded packets |
| A | 0 | 42 | 0 |
| B | 0 | 42 | 0 |
| C | 0 | 42 | 0 |
| D | 0 | 42 | 0 |
| Mode M0 | |||
|---|---|---|---|
| Quadrant | BADHDUFLAG | Total packets | Discarded packets |
| A | 0 | 10640 | 3 |
| B | 0 | 5033 | 2 |
| C | 0 | 10729 | 2 |
| D | 0 | 12645 | 2 |
| Quadrant | Total seconds | Saturated seconds | Saturation percentage |
|---|---|---|---|
| A | 4999 | 12 | 0.240048% |
| B | 4999 | 4999 | 100.000000% |
| C | 4999 | 49 | 0.980196% |
| D | 4999 | 180 | 3.600720% |
Noise dominated data is calculated using 1-second bins in cleaned event files. If a bin has >2000 counts, and if more than 50% of those come from <1% of pixels, then it is considered to be noise-dominated and hence unusable.
| Quadrant | # 1 sec bins | Bins with >0 counts | Bins with >2000 counts | High rate bins dominated by noise | Noise dominated (total time) | Noise dominated (detector-on time) | Marked lightcurve |
|---|---|---|---|---|---|---|---|
| A | 9244 | 5001 | 3 | 3 | 0.03% | 0.06% | 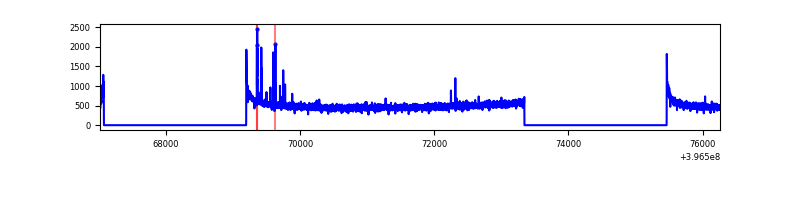 |
| B | 9243 | 4998 | 0 | 0 | 0.00% | 0.00% | 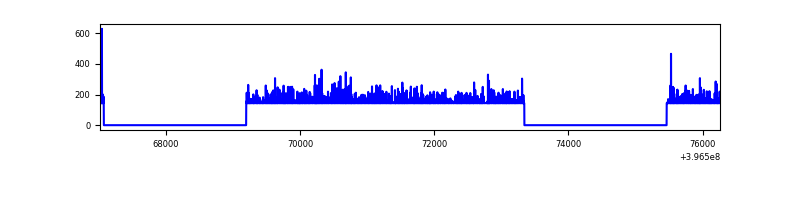 |
| C | 9244 | 5001 | 41 | 41 | 0.44% | 0.82% | 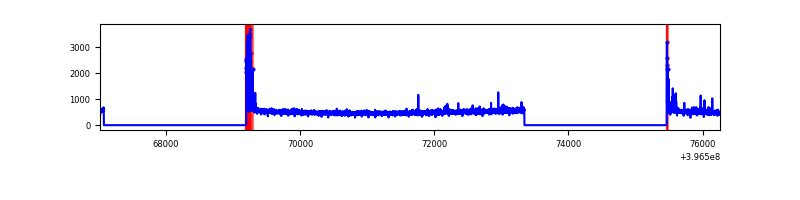 |
| D | 9244 | 5001 | 162 | 162 | 1.75% | 3.24% | 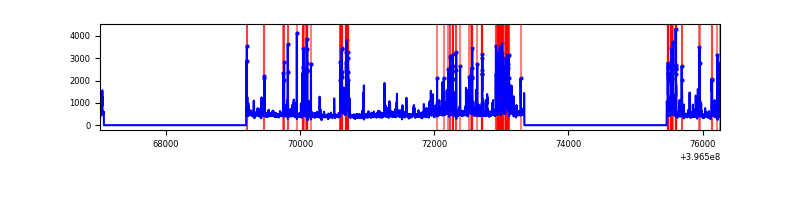 |
Top three noisy pixels from each quadrant. If the there are fewer than three noisy pixels in the level2.evt file, extra rows are filled as -1
| Pixel properties | Quadrant properties | ||||||
|---|---|---|---|---|---|---|---|
| Quadrant | DetID | PixID | Counts | Sigma | Mean | Median | Sigma |
| A | 10 | 83 | 213743 | 1834.17 | 579 | 568 | 116.2 |
| A | 9 | 143 | 54850 | 467.05 | 579 | 568 | 116.2 |
| A | 13 | 6 | 11861 | 97.17 | 579 | 568 | 116.2 |
| B | 12 | 243 | 695601 | 195261.14 | 9 | 9 | 3.6 |
| B | 12 | 144 | 12573 | 3526.87 | 9 | 9 | 3.6 |
| B | 5 | 255 | 1125 | 313.27 | 9 | 9 | 3.6 |
| C | 15 | 214 | 214831 | 1614.73 | 574 | 579 | 132.7 |
| C | 0 | 10 | 171571 | 1288.7 | 574 | 579 | 132.7 |
| C | 0 | 207 | 18150 | 132.43 | 574 | 579 | 132.7 |
| D | 13 | 171 | 396867 | 2858.31 | 567 | 553 | 138.7 |
| D | 10 | 253 | 164205 | 1180.3 | 567 | 553 | 138.7 |
| D | 2 | 153 | 159228 | 1144.4 | 567 | 553 | 138.7 |
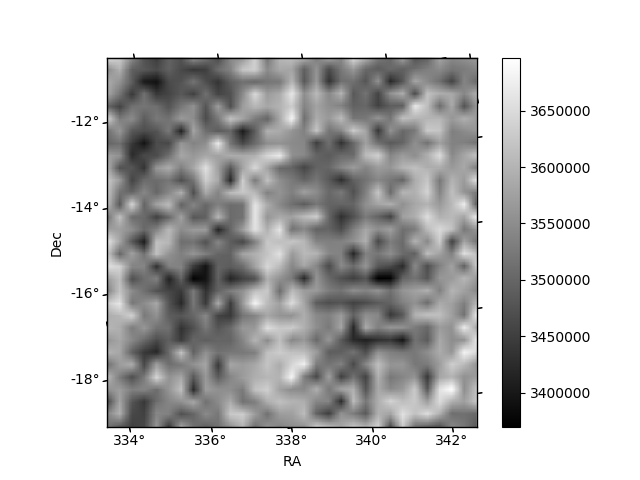
Histogram calculated using DETX and DETY for each event in the final _common_clean file
| Quadrant A |  |
 |
Quadrant B |
|---|---|---|---|
| Quadrant D |  |
 |
Quadrant C |
| Plot type | Count rate plots | Images |
|---|---|---|
| Comparison with Poisson distribution Blue bars denote a histogram of data divided into 1 sec bins. Red curve is a Poisson curve with rate = median count rate of data. |
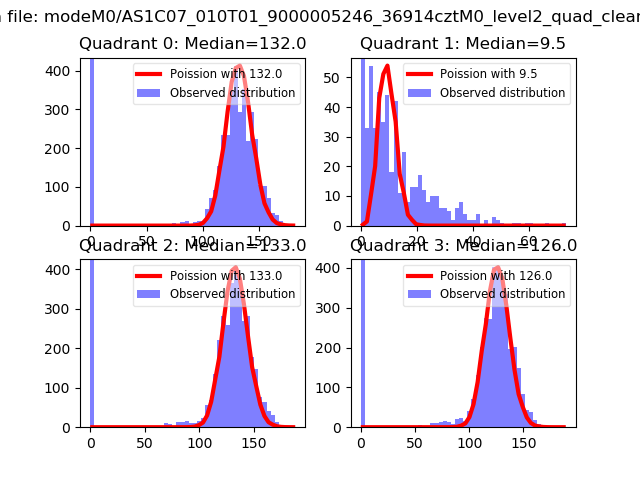 |
 |
| Quadrant-wise count rates Data is divided into 100 sec bins |
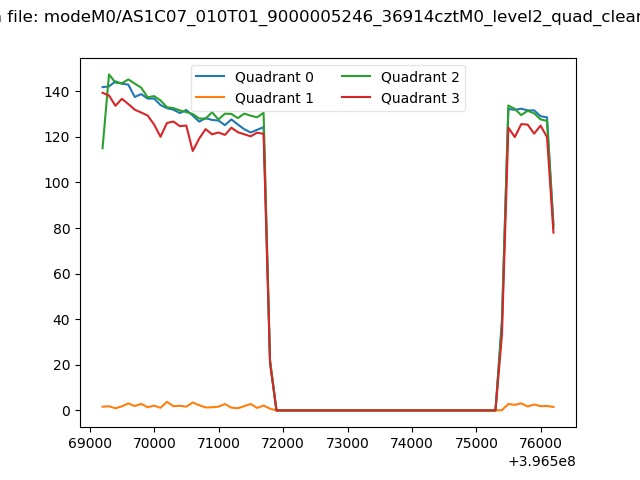 |
|
| Module-wise count rates for Quadrant A Data is divided into 100 sec bins |
 |
 |
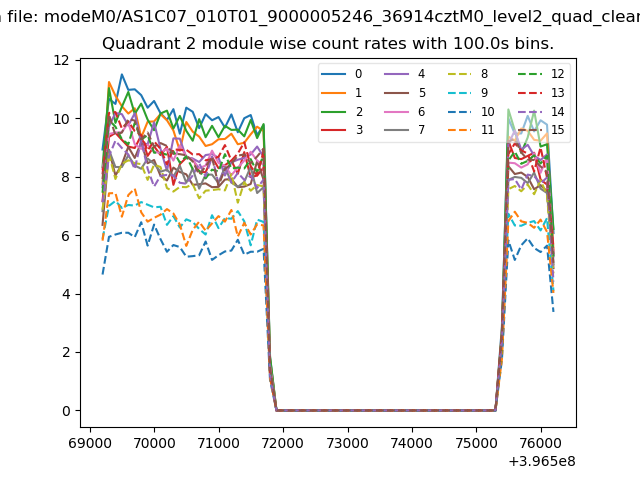
| Module-wise count rates for Quadrant B Data is divided into 100 sec bins |
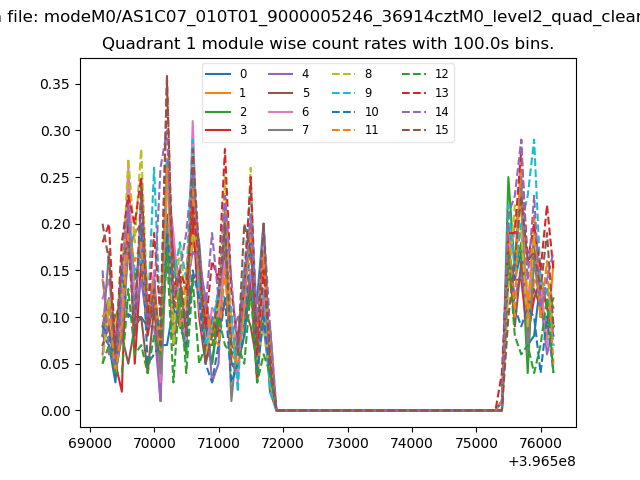 |
 |
| Module-wise count rates for Quadrant C Data is divided into 100 sec bins |
 |
 |
| Module-wise count rates for Quadrant D Data is divided into 100 sec bins |
 |
 |
| Parameter | Plot |
|---|---|
| CZT HV Monitor | 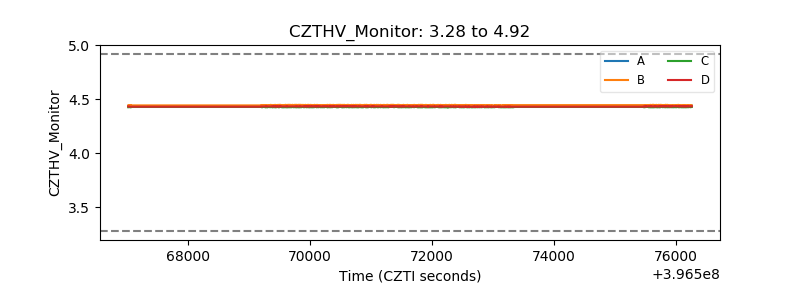 |
| D_VDD |  |
| Temperature 1 |  |
| Veto HV Monitor |  |
| Veto LLD |  |
| Alpha Counter | 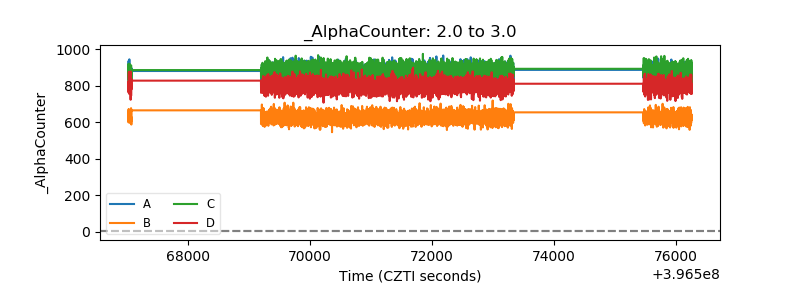 |
| _CPM_Rate | 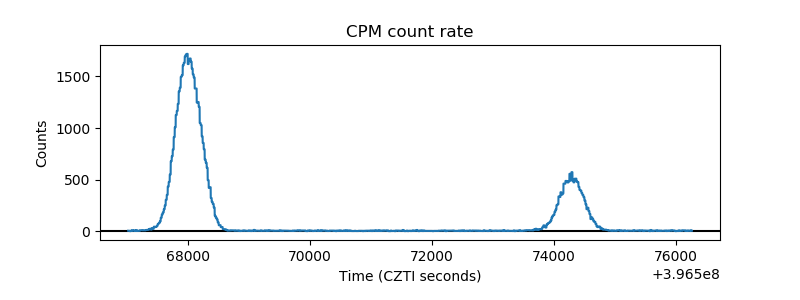 |
| CZT Counter |  |
| +2.5 Volts monitor |  |
| +5 Volts monitor |  |
| _ROLL_ROT |  |
| _Roll_DEC |  |
| _Roll_RA |  |
| Veto Counter |  |