| Param | Original file | Final file |
|---|---|---|
| Filename | modeM0/AS1C07_010T01_9000005246_36917cztM0_level2.evt | modeM0/AS1C07_010T01_9000005246_36917cztM0_level2_quad_clean.evt |
| Size (bytes) | 238,098,240 | 55,797,120 |
| Size | 227.1 MB | 53.2 MB |
| Events in quadrant A | 2,006,189 | 414,571 |
| Events in quadrant B | 932,288 | 6,389 |
| Events in quadrant C | 2,075,224 | 493,877 |
| Events in quadrant D | 1,868,971 | 443,128 |
| Mode SS | |||
|---|---|---|---|
| Quadrant | BADHDUFLAG | Total packets | Discarded packets |
| A | 0 | 140505926814504 | 46 |
| B | 0 | -1 | -1 |
| C | 0 | -1 | -1 |
| D | 0 | -1 | -1 |
| Mode M9 | |||
|---|---|---|---|
| Quadrant | BADHDUFLAG | Total packets | Discarded packets |
| A | 0 | 14 | 0 |
| B | 0 | 22 | 0 |
| C | 0 | 14 | 0 |
| D | 0 | 23 | 0 |
| Mode M0 | |||
|---|---|---|---|
| Quadrant | BADHDUFLAG | Total packets | Discarded packets |
| A | 0 | 13307 | 4632 |
| B | 0 | 6406 | 134 |
| C | 0 | 13410 | 4687 |
| D | 0 | 15131 | 6641 |
| Quadrant | Total seconds | Saturated seconds | Saturation percentage |
|---|---|---|---|
| A | 4339 | 3 | 0.069140% |
| B | 6272 | 6272 | 100.000000% |
| C | 4362 | 2 | 0.045851% |
| D | 4246 | 2 | 0.047103% |
Noise dominated data is calculated using 1-second bins in cleaned event files. If a bin has >2000 counts, and if more than 50% of those come from <1% of pixels, then it is considered to be noise-dominated and hence unusable.
| Quadrant | # 1 sec bins | Bins with >0 counts | Bins with >2000 counts | High rate bins dominated by noise | Noise dominated (total time) | Noise dominated (detector-on time) | Marked lightcurve |
|---|---|---|---|---|---|---|---|
| A | 26085 | 8677 | 0 | 0 | 0.00% | 0.00% | 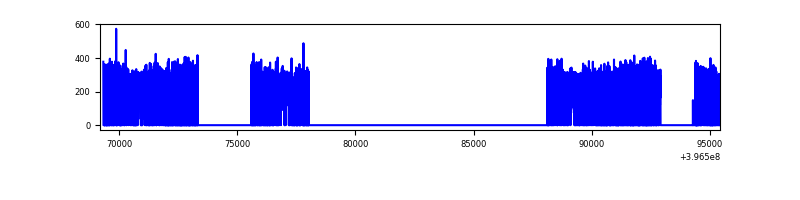 |
| B | 26225 | 6271 | 0 | 0 | 0.00% | 0.00% | 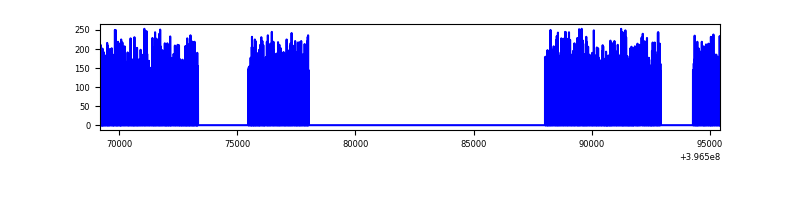 |
| C | 26057 | 8722 | 0 | 0 | 0.00% | 0.00% | 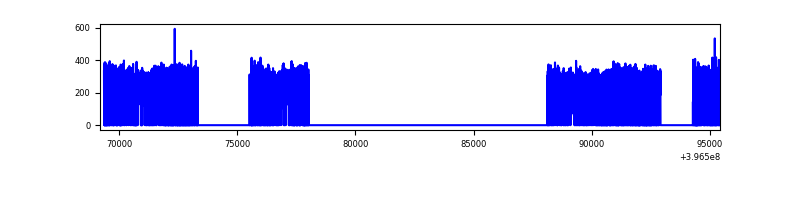 |
| D | 26225 | 8489 | 0 | 0 | 0.00% | 0.00% |  |
Top three noisy pixels from each quadrant. If the there are fewer than three noisy pixels in the level2.evt file, extra rows are filled as -1
| Pixel properties | Quadrant properties | ||||||
|---|---|---|---|---|---|---|---|
| Quadrant | DetID | PixID | Counts | Sigma | Mean | Median | Sigma |
| A | 10 | 83 | 117084 | 1178.93 | 483 | 473 | 98.9 |
| A | 12 | 189 | 12619 | 122.79 | 483 | 473 | 98.9 |
| A | 13 | 6 | 7792 | 73.99 | 483 | 473 | 98.9 |
| B | 12 | 243 | 873668 | 235942.05 | 10 | 10 | 3.7 |
| B | 12 | 144 | 16191 | 4369.88 | 10 | 10 | 3.7 |
| B | 0 | 229 | 409 | 107.75 | 10 | 10 | 3.7 |
| C | 15 | 214 | 183333 | 1647.73 | 477 | 483 | 111.0 |
| C | 0 | 207 | 21325 | 187.81 | 477 | 483 | 111.0 |
| C | 0 | 10 | 7220 | 60.71 | 477 | 483 | 111.0 |
| D | 13 | 171 | 25268 | 218.1 | 464 | 452 | 113.8 |
| D | 13 | 249 | 23203 | 199.95 | 464 | 452 | 113.8 |
| D | 2 | 234 | 19414 | 166.65 | 464 | 452 | 113.8 |
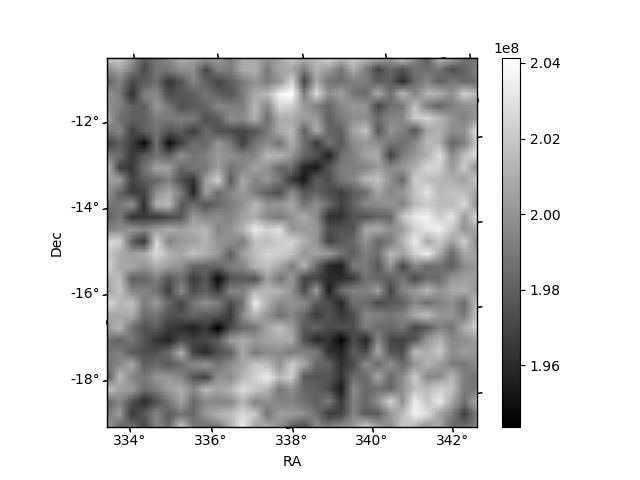
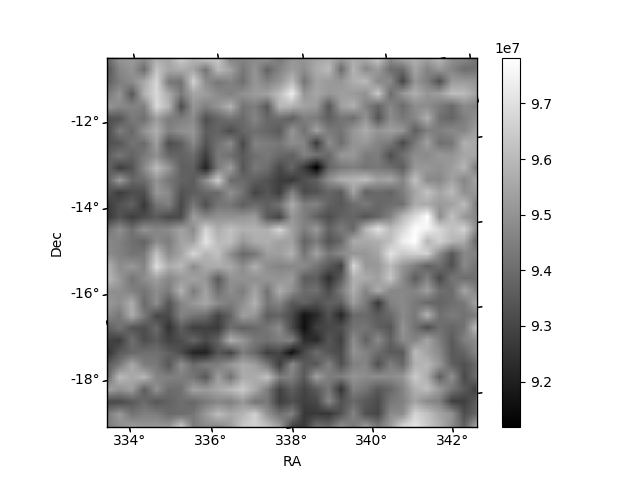
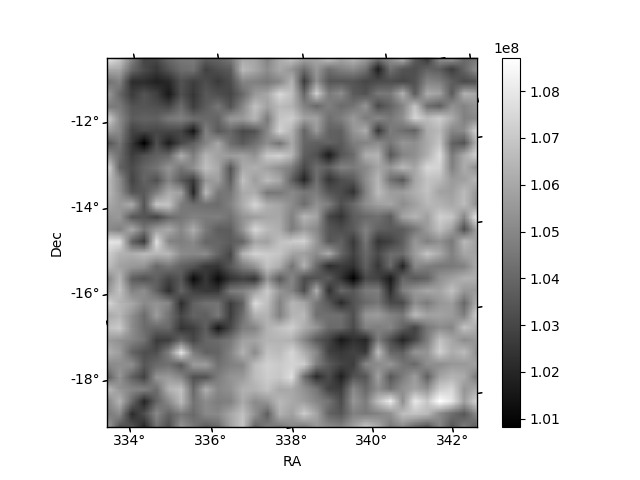
Histogram calculated using DETX and DETY for each event in the final _common_clean file
| Quadrant A | 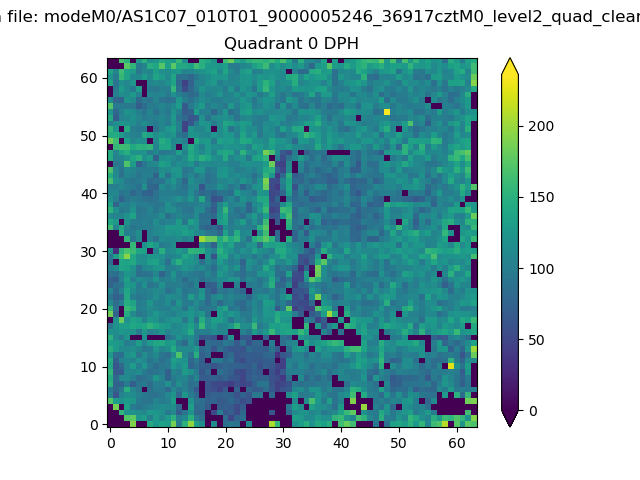 |
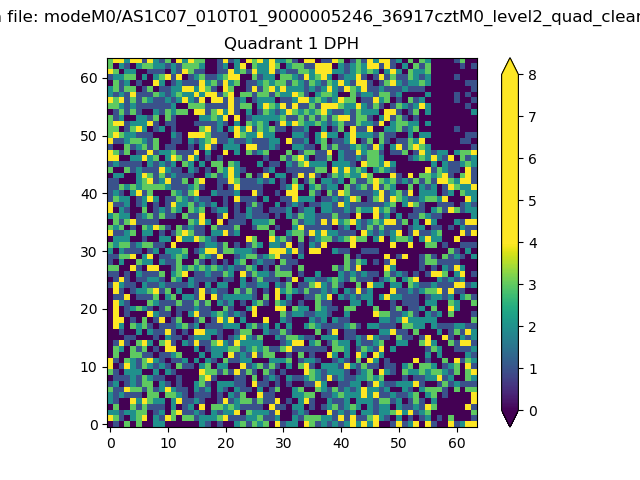 |
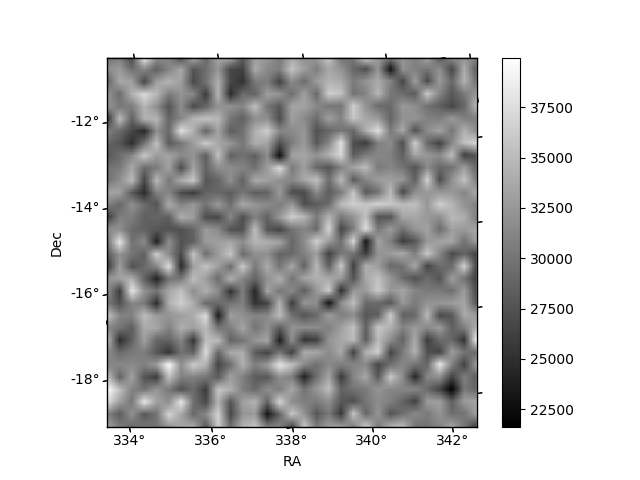
Quadrant B |
|---|---|---|---|
| Quadrant D | 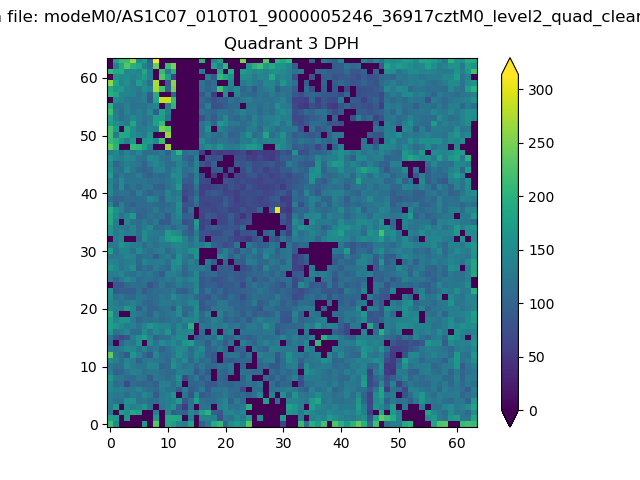 |
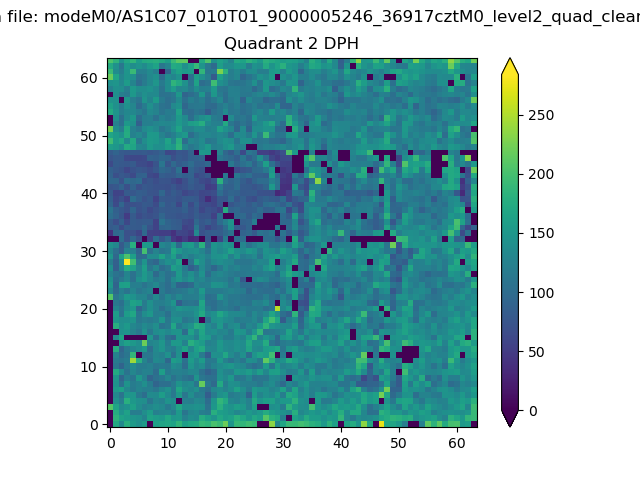 |
Quadrant C |
| Plot type | Count rate plots | Images |
|---|---|---|
| Comparison with Poisson distribution Blue bars denote a histogram of data divided into 1 sec bins. Red curve is a Poisson curve with rate = median count rate of data. |
 |
 |
| Quadrant-wise count rates Data is divided into 100 sec bins |
 |
|
| Module-wise count rates for Quadrant A Data is divided into 100 sec bins |
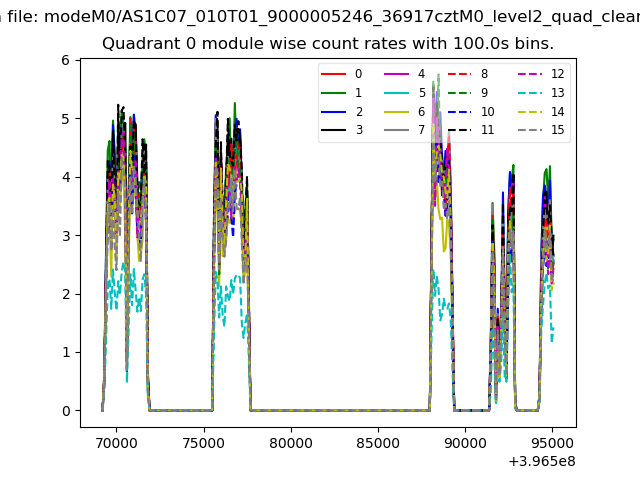 |
 |
| Module-wise count rates for Quadrant B Data is divided into 100 sec bins |
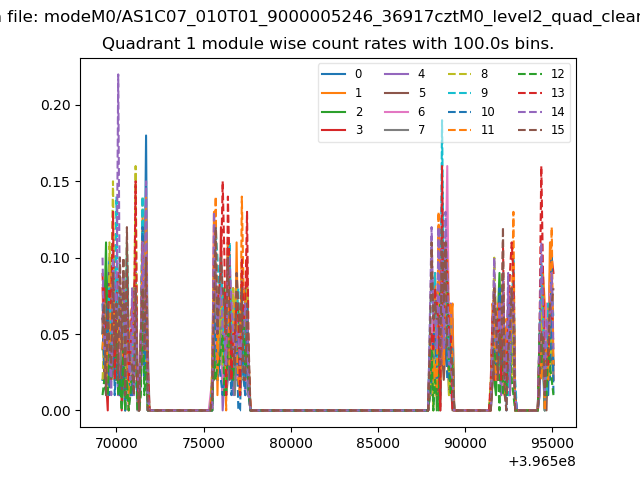 |
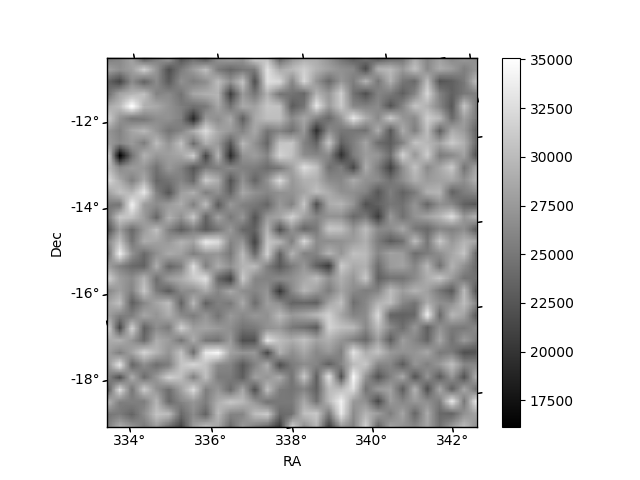 |
| Module-wise count rates for Quadrant C Data is divided into 100 sec bins |
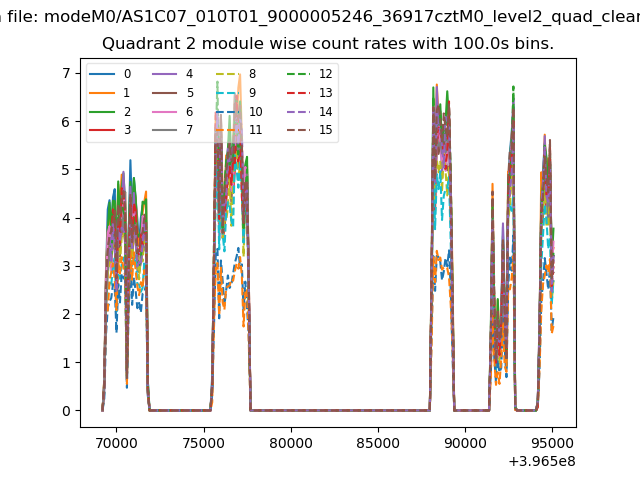 |
 |
| Module-wise count rates for Quadrant D Data is divided into 100 sec bins |
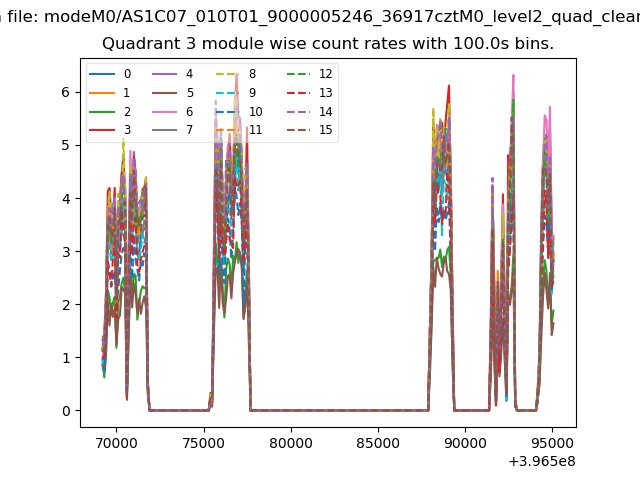 |
 |
| Parameter | Plot |
|---|---|
| CZT HV Monitor |  |
| D_VDD | 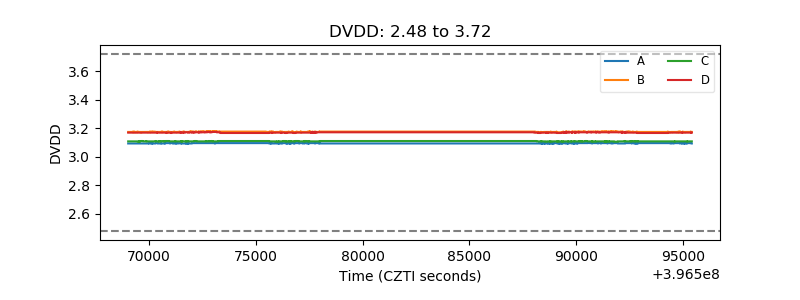 |
| Temperature 1 | 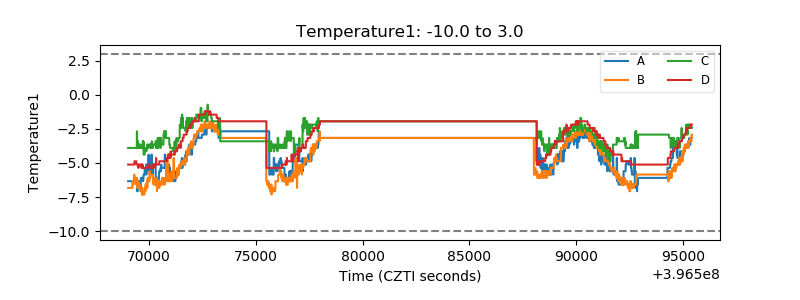 |
| Veto HV Monitor | 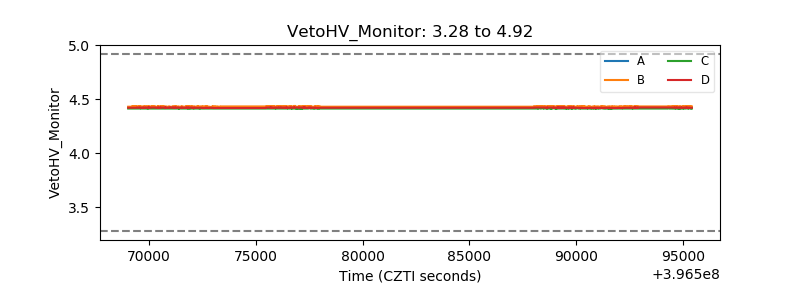 |
| Veto LLD | 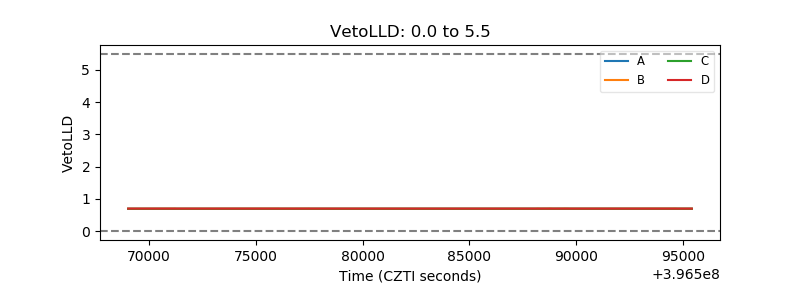 |
| Alpha Counter |  |
| _CPM_Rate |  |
| CZT Counter | 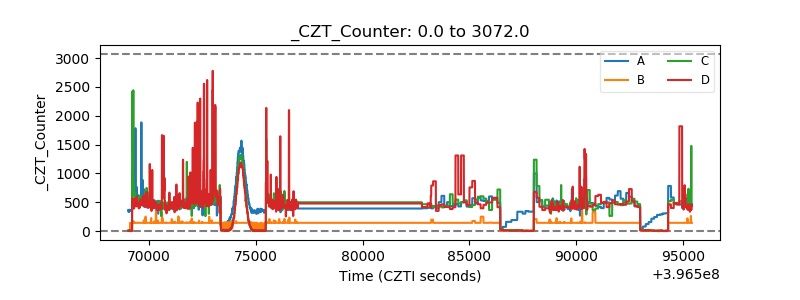 |
| +2.5 Volts monitor |  |
| +5 Volts monitor |  |
| _ROLL_ROT | 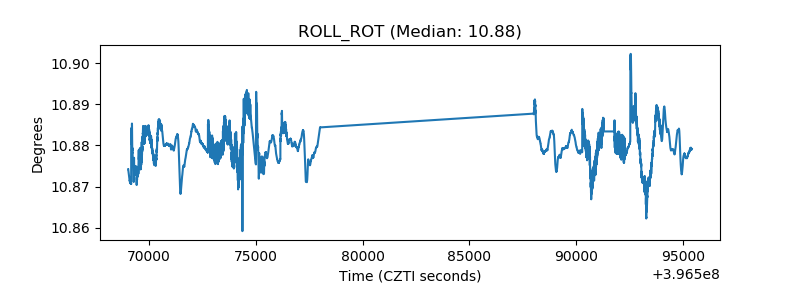 |
| _Roll_DEC | 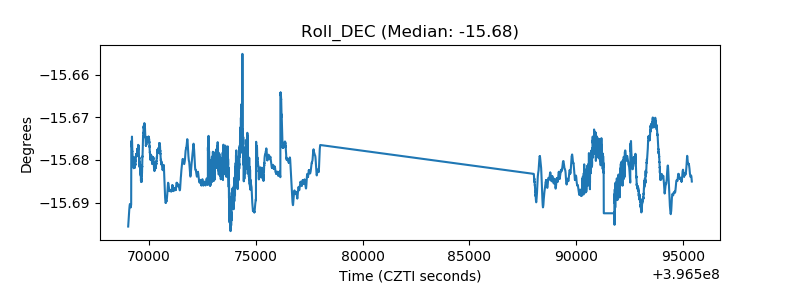 |
| _Roll_RA | 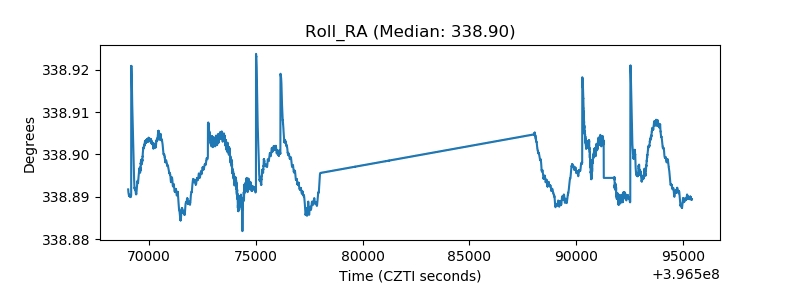 |
| Veto Counter | 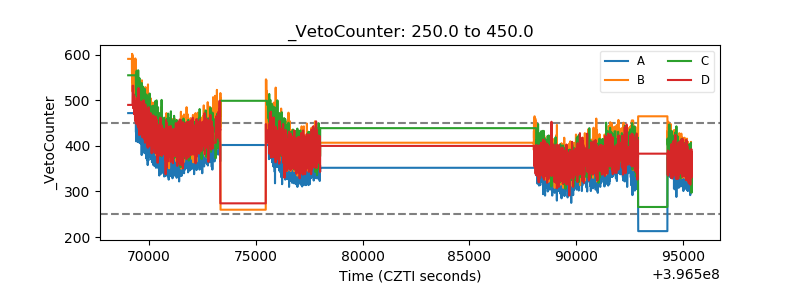 |