| Param | Original file | Final file |
|---|---|---|
| Filename | modeM0/AS1C07_010T01_9000005246_36918cztM0_level2.evt | modeM0/AS1C07_010T01_9000005246_36918cztM0_level2_quad_clean.evt |
| Size (bytes) | 765,792,000 | 115,174,080 |
| Size | 730.3 MB | 109.8 MB |
| Events in quadrant A | 6,174,002 | 879,129 |
| Events in quadrant B | 1,901,274 | 13,438 |
| Events in quadrant C | 6,336,733 | 880,346 |
| Events in quadrant D | 7,910,553 | 837,418 |
| Mode SS | |||
|---|---|---|---|
| Quadrant | BADHDUFLAG | Total packets | Discarded packets |
| A | 0 | 258 | 0 |
| B | 0 | 258 | 0 |
| C | 0 | 258 | 0 |
| D | 0 | 258 | 0 |
| Mode M9 | |||
|---|---|---|---|
| Quadrant | BADHDUFLAG | Total packets | Discarded packets |
| A | 0 | 51 | 0 |
| B | 0 | 51 | 0 |
| C | 0 | 51 | 0 |
| D | 0 | 52 | 0 |
| Mode M0 | |||
|---|---|---|---|
| Quadrant | BADHDUFLAG | Total packets | Discarded packets |
| A | 0 | 26294 | 5 |
| B | 0 | 12748 | 4 |
| C | 0 | 26434 | 6 |
| D | 0 | 32175 | 4 |
| Quadrant | Total seconds | Saturated seconds | Saturation percentage |
|---|---|---|---|
| A | 12639 | 13 | 0.102856% |
| B | 12639 | 12639 | 100.000000% |
| C | 12638 | 38 | 0.300680% |
| D | 12638 | 555 | 4.391518% |
Noise dominated data is calculated using 1-second bins in cleaned event files. If a bin has >2000 counts, and if more than 50% of those come from <1% of pixels, then it is considered to be noise-dominated and hence unusable.
| Quadrant | # 1 sec bins | Bins with >0 counts | Bins with >2000 counts | High rate bins dominated by noise | Noise dominated (total time) | Noise dominated (detector-on time) | Marked lightcurve |
|---|---|---|---|---|---|---|---|
| A | 26068 | 12642 | 1 | 1 | 0.00% | 0.01% | 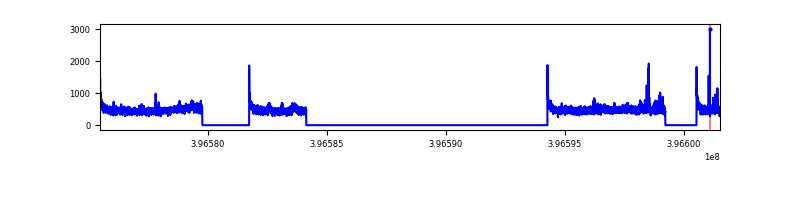 |
| B | 26067 | 12638 | 0 | 0 | 0.00% | 0.00% | 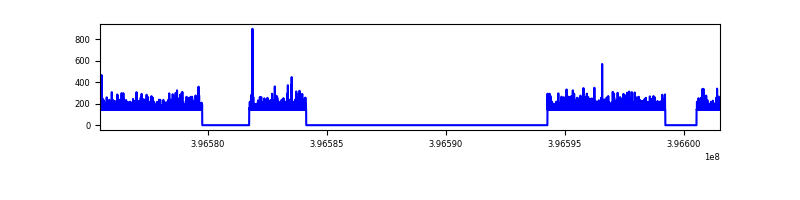 |
| C | 26068 | 12641 | 27 | 27 | 0.10% | 0.21% | 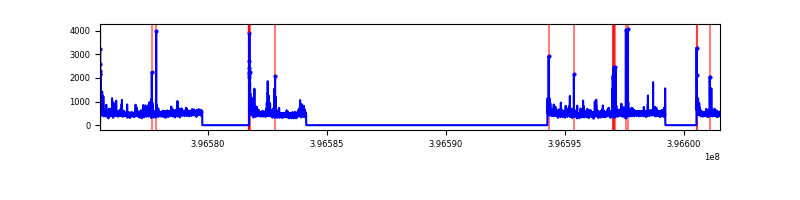 |
| D | 26068 | 12641 | 521 | 521 | 2.00% | 4.12% | 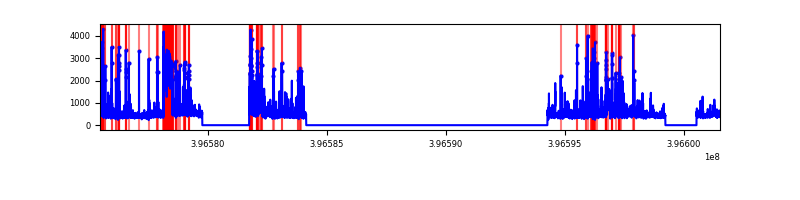 |
Top three noisy pixels from each quadrant. If the there are fewer than three noisy pixels in the level2.evt file, extra rows are filled as -1
| Pixel properties | Quadrant properties | ||||||
|---|---|---|---|---|---|---|---|
| Quadrant | DetID | PixID | Counts | Sigma | Mean | Median | Sigma |
| A | 10 | 83 | 494504 | 1731.81 | 1419 | 1393 | 284.7 |
| A | 12 | 189 | 106160 | 367.94 | 1419 | 1393 | 284.7 |
| A | 7 | 16 | 54872 | 187.82 | 1419 | 1393 | 284.7 |
| B | 12 | 243 | 1755515 | 244385.59 | 26 | 26 | 7.2 |
| B | 12 | 144 | 33594 | 4673.08 | 26 | 26 | 7.2 |
| B | 5 | 255 | 2595 | 357.64 | 26 | 26 | 7.2 |
| C | 15 | 214 | 538990 | 1659.43 | 1389 | 1398 | 324.0 |
| C | 0 | 207 | 214525 | 657.88 | 1389 | 1398 | 324.0 |
| C | 0 | 10 | 158115 | 483.75 | 1389 | 1398 | 324.0 |
| D | 10 | 253 | 895312 | 2707.11 | 1356 | 1319 | 330.2 |
| D | 5 | 222 | 503560 | 1520.84 | 1356 | 1319 | 330.2 |
| D | 13 | 249 | 438040 | 1322.44 | 1356 | 1319 | 330.2 |
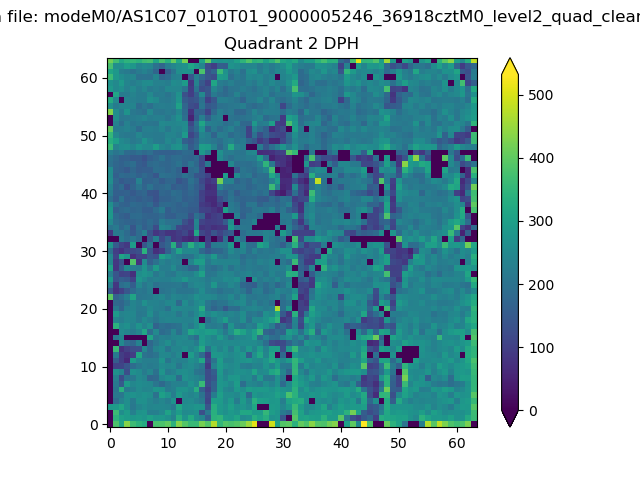
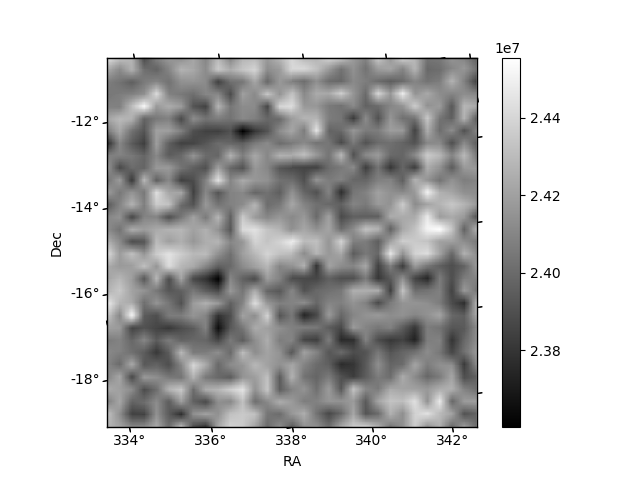
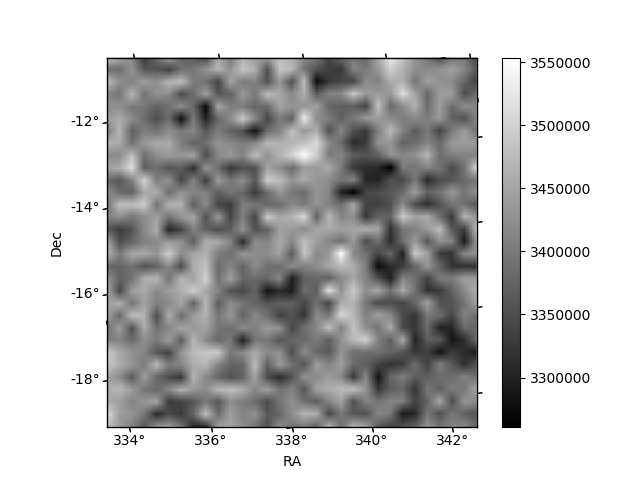
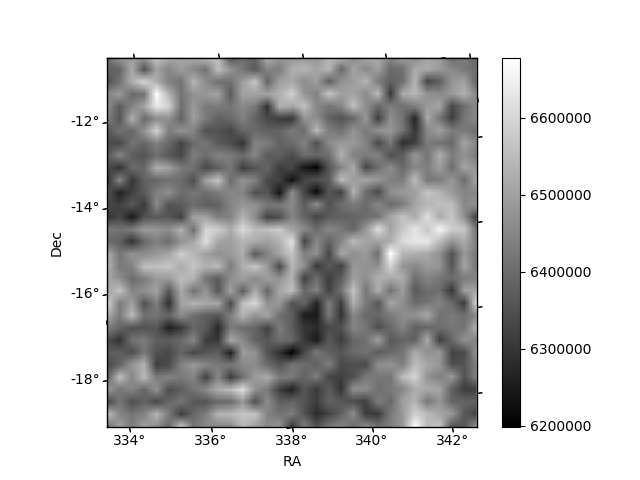
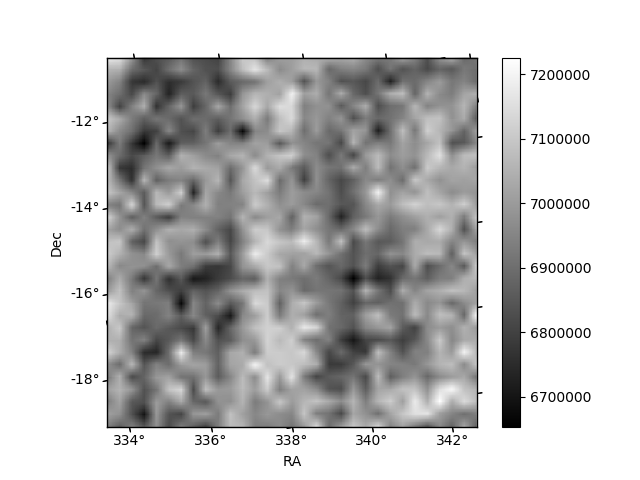
Histogram calculated using DETX and DETY for each event in the final _common_clean file
| Quadrant A | 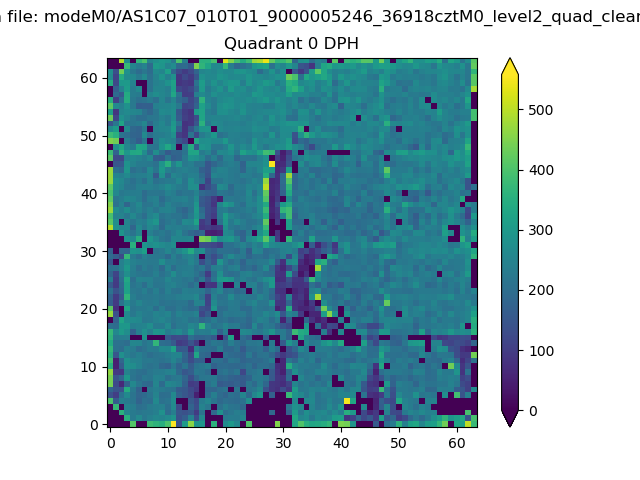 |
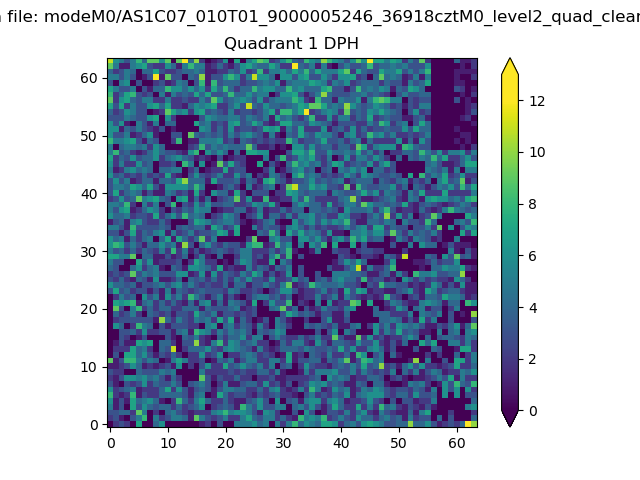 |
Quadrant B |
|---|---|---|---|
| Quadrant D | 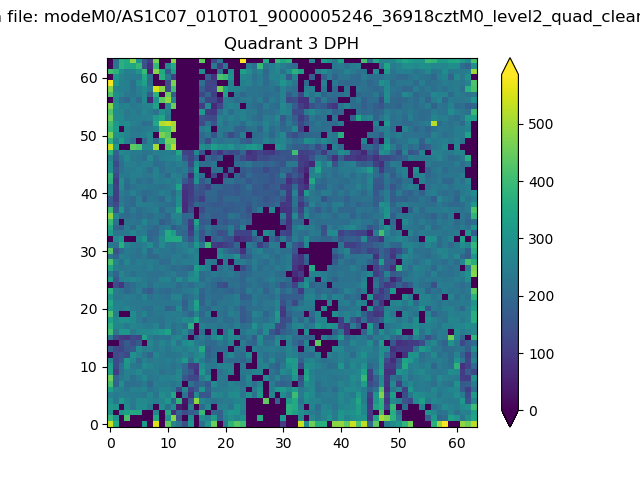 |
 |
Quadrant C |
| Plot type | Count rate plots | Images |
|---|---|---|
| Comparison with Poisson distribution Blue bars denote a histogram of data divided into 1 sec bins. Red curve is a Poisson curve with rate = median count rate of data. |
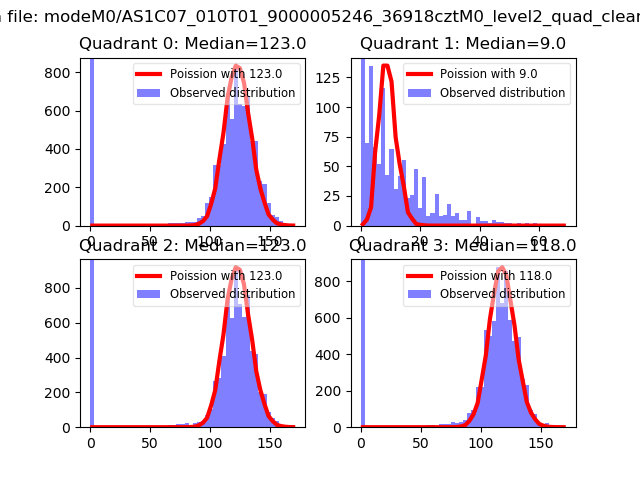 |
 |
| Quadrant-wise count rates Data is divided into 100 sec bins |
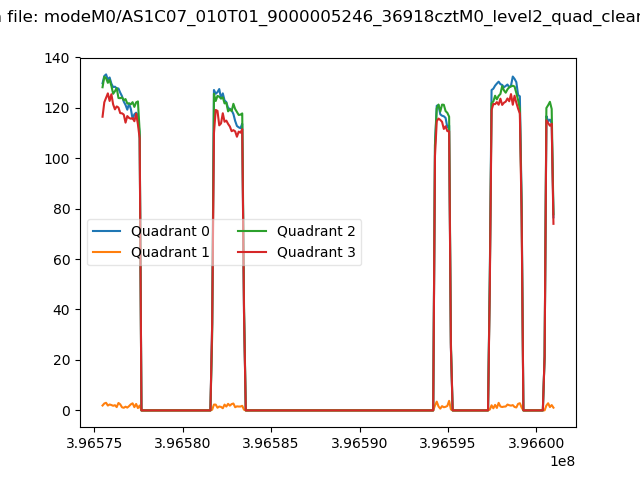 |
|
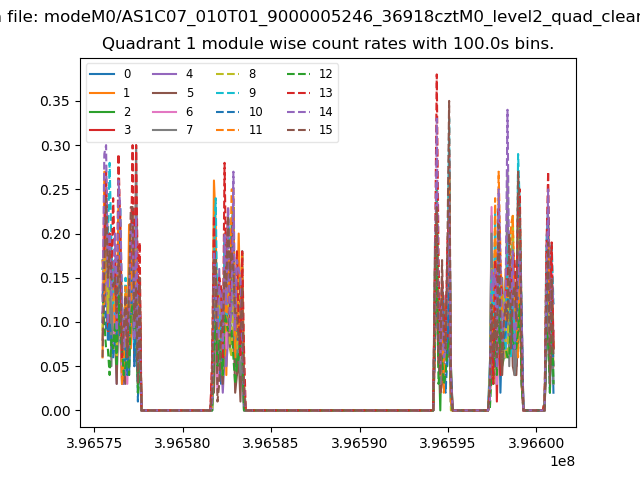
| Module-wise count rates for Quadrant A Data is divided into 100 sec bins |
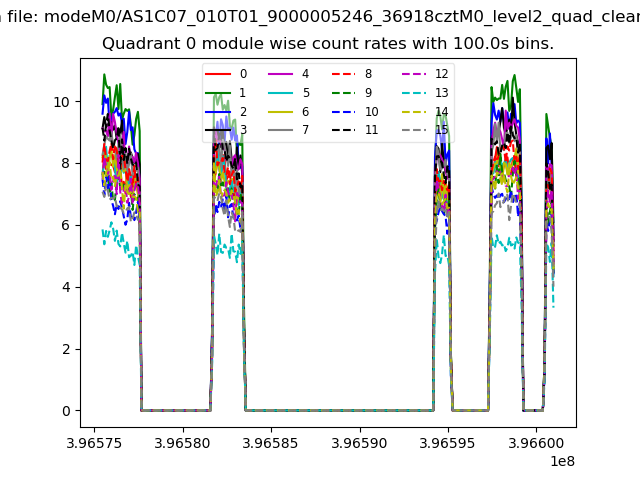 |
 |
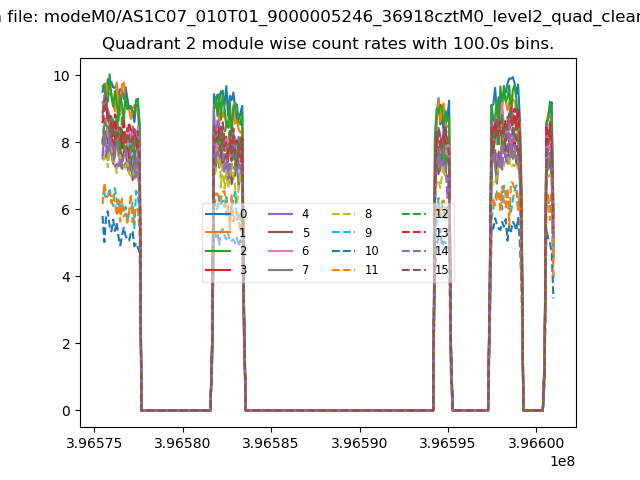
| Module-wise count rates for Quadrant B Data is divided into 100 sec bins |
 |
 |
| Module-wise count rates for Quadrant C Data is divided into 100 sec bins |
 |
 |
| Module-wise count rates for Quadrant D Data is divided into 100 sec bins |
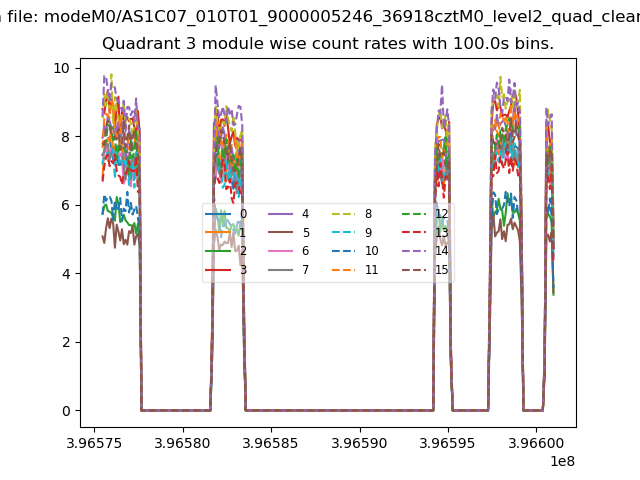 |
 |
| Parameter | Plot |
|---|---|
| CZT HV Monitor | 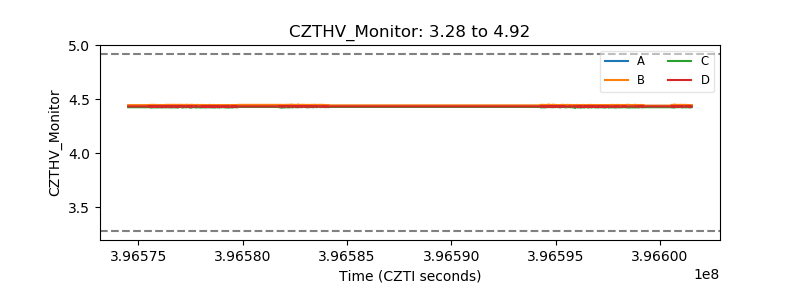 |
| D_VDD | 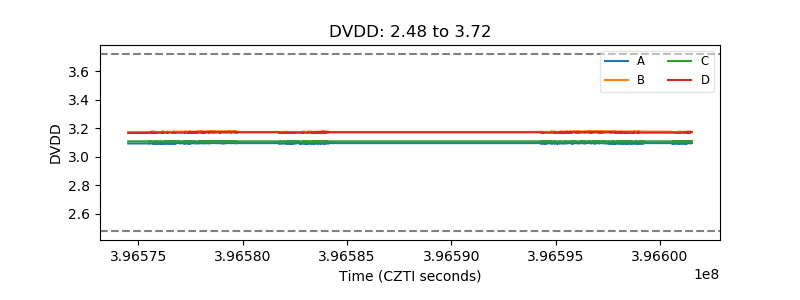 |
| Temperature 1 | 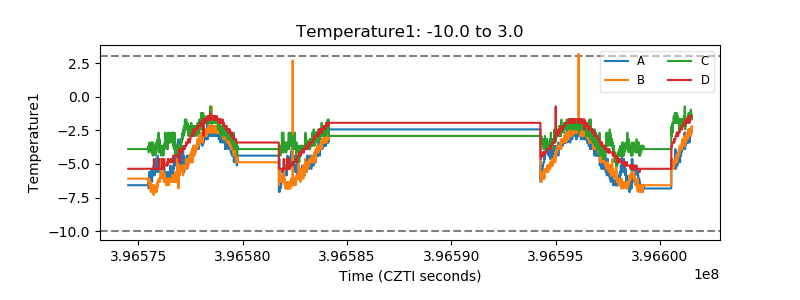 |
| Veto HV Monitor | 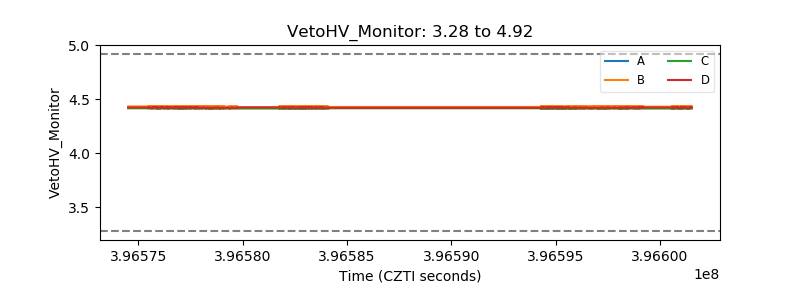 |
| Veto LLD | 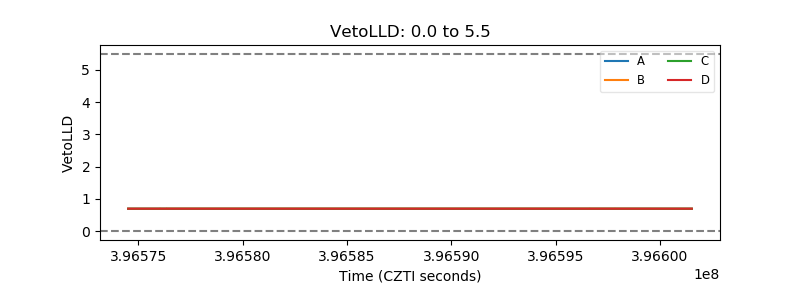 |
| Alpha Counter | 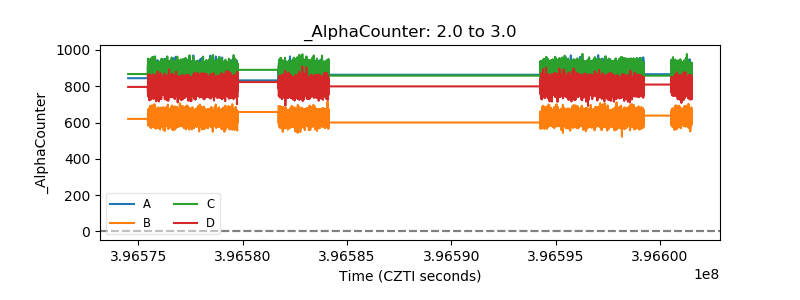 |
| _CPM_Rate | 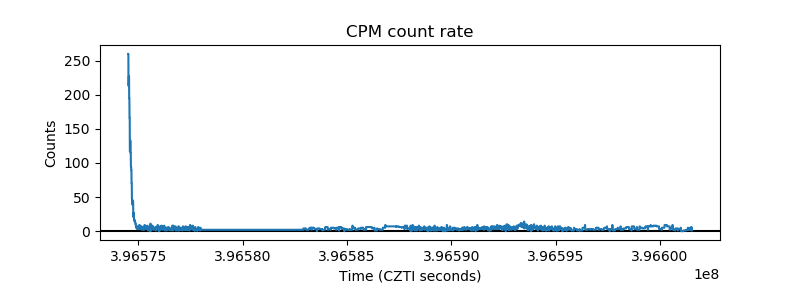 |
| CZT Counter | 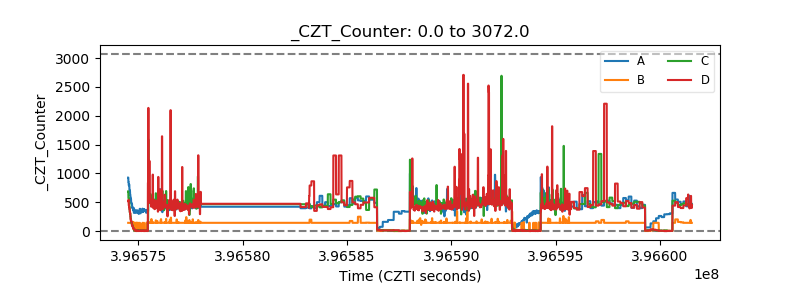 |
| +2.5 Volts monitor |  |
| +5 Volts monitor |  |
| _ROLL_ROT | 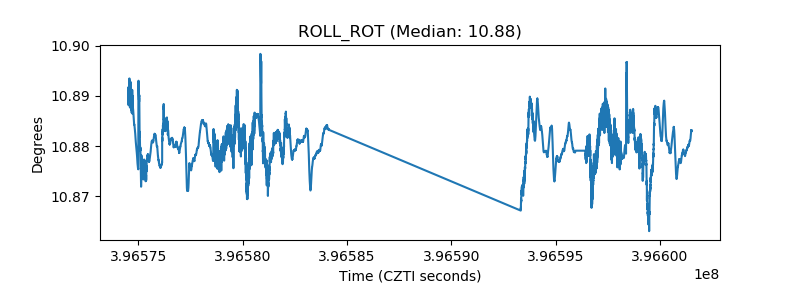 |
| _Roll_DEC | 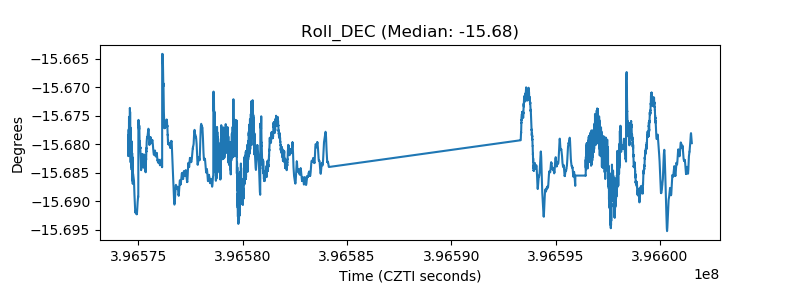 |
| _Roll_RA | 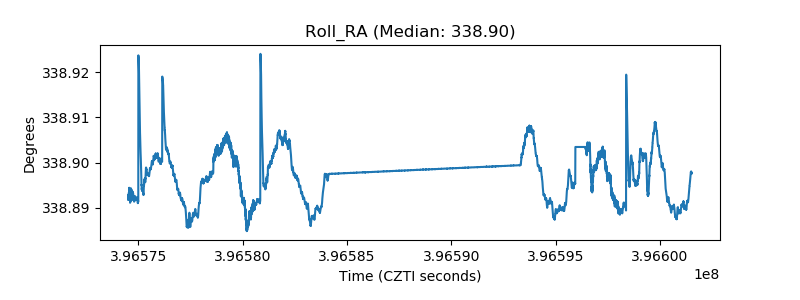 |
| Veto Counter | 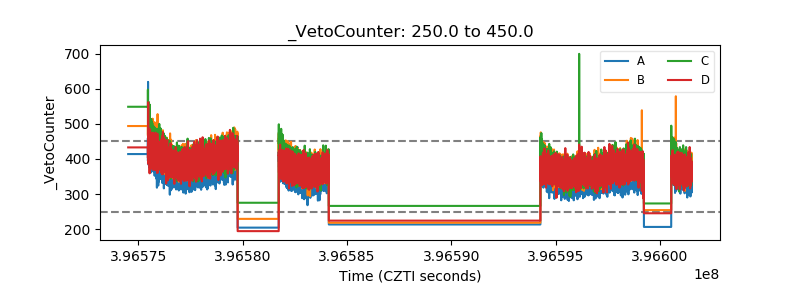 |