| Param | Original file | Final file |
|---|---|---|
| Filename | modeM0/AS1C07_010T01_9000005246_36922cztM0_level2.evt | modeM0/AS1C07_010T01_9000005246_36922cztM0_level2_quad_clean.evt |
| Size (bytes) | 446,109,120 | 70,378,560 |
| Size | 425.4 MB | 67.1 MB |
| Events in quadrant A | 3,008,583 | 461,751 |
| Events in quadrant B | 2,650,796 | 393,022 |
| Events in quadrant C | 3,104,408 | 448,336 |
| Events in quadrant D | 4,340,404 | 411,137 |
| Mode SS | |||
|---|---|---|---|
| Quadrant | BADHDUFLAG | Total packets | Discarded packets |
| A | 0 | 124 | 0 |
| B | 0 | 124 | 0 |
| C | 0 | 124 | 0 |
| D | 0 | 124 | 0 |
| Mode M9 | |||
|---|---|---|---|
| Quadrant | BADHDUFLAG | Total packets | Discarded packets |
| A | 0 | 32 | 0 |
| B | 0 | 32 | 0 |
| C | 0 | 31 | 0 |
| D | 0 | 32 | 0 |
| Mode M0 | |||
|---|---|---|---|
| Quadrant | BADHDUFLAG | Total packets | Discarded packets |
| A | 0 | 12869 | 36 |
| B | 0 | 11813 | 11 |
| C | 0 | 12827 | 25 |
| D | 0 | 17050 | 42 |
| Quadrant | Total seconds | Saturated seconds | Saturation percentage |
|---|---|---|---|
| A | 6019 | 28 | 0.465194% |
| B | 5781 | 1484 | 25.670299% |
| C | 6023 | 53 | 0.879960% |
| D | 6019 | 465 | 7.725536% |
Noise dominated data is calculated using 1-second bins in cleaned event files. If a bin has >2000 counts, and if more than 50% of those come from <1% of pixels, then it is considered to be noise-dominated and hence unusable.
| Quadrant | # 1 sec bins | Bins with >0 counts | Bins with >2000 counts | High rate bins dominated by noise | Noise dominated (total time) | Noise dominated (detector-on time) | Marked lightcurve |
|---|---|---|---|---|---|---|---|
| A | 9200 | 6031 | 13 | 13 | 0.14% | 0.22% | 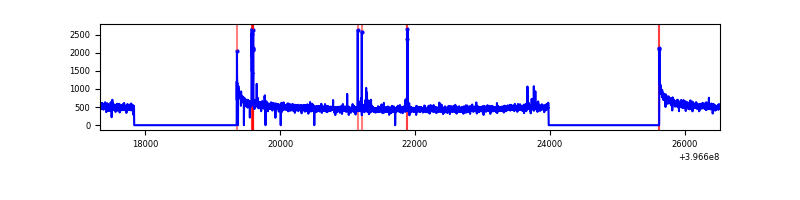 |
| B | 9200 | 5785 | 39 | 39 | 0.42% | 0.67% | 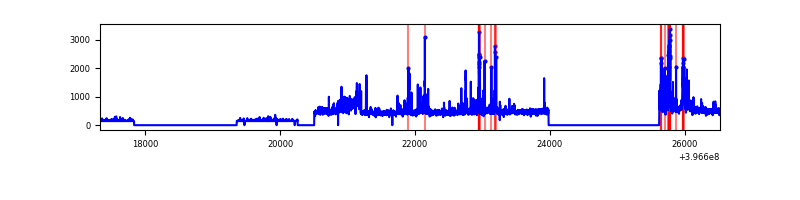 |
| C | 9200 | 6034 | 34 | 34 | 0.37% | 0.56% | 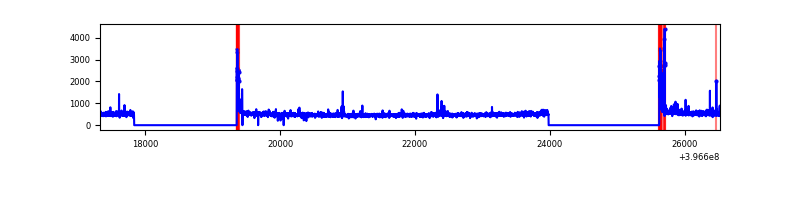 |
| D | 9200 | 6032 | 424 | 424 | 4.61% | 7.03% | 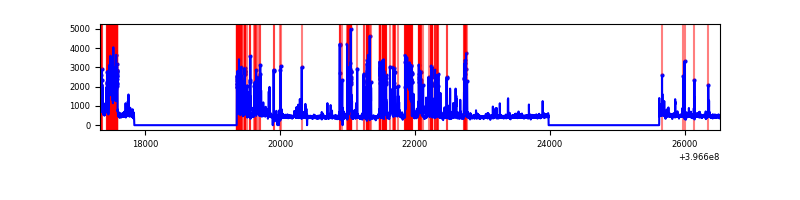 |
Top three noisy pixels from each quadrant. If the there are fewer than three noisy pixels in the level2.evt file, extra rows are filled as -1
| Pixel properties | Quadrant properties | ||||||
|---|---|---|---|---|---|---|---|
| Quadrant | DetID | PixID | Counts | Sigma | Mean | Median | Sigma |
| A | 10 | 83 | 245293 | 1757.24 | 693 | 678 | 139.2 |
| A | 9 | 143 | 53331 | 378.24 | 693 | 678 | 139.2 |
| A | 12 | 189 | 14009 | 95.77 | 693 | 678 | 139.2 |
| B | 5 | 172 | 199932 | 2074.64 | 493 | 479 | 96.1 |
| B | 12 | 243 | 195225 | 2025.68 | 493 | 479 | 96.1 |
| B | 0 | 229 | 139566 | 1446.73 | 493 | 479 | 96.1 |
| C | 15 | 214 | 257397 | 1630.28 | 673 | 678 | 157.5 |
| C | 0 | 10 | 157594 | 996.49 | 673 | 678 | 157.5 |
| C | 0 | 207 | 47443 | 296.98 | 673 | 678 | 157.5 |
| D | 12 | 17 | 1100512 | 6763.42 | 658 | 639 | 162.6 |
| D | 13 | 249 | 324612 | 1992.2 | 658 | 639 | 162.6 |
| D | 13 | 171 | 203860 | 1249.66 | 658 | 639 | 162.6 |
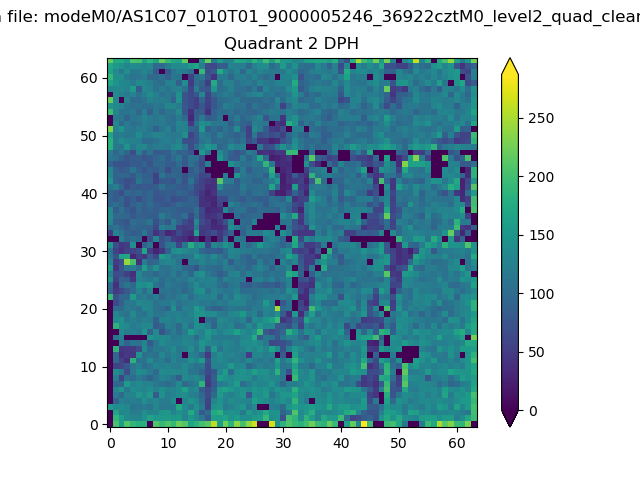
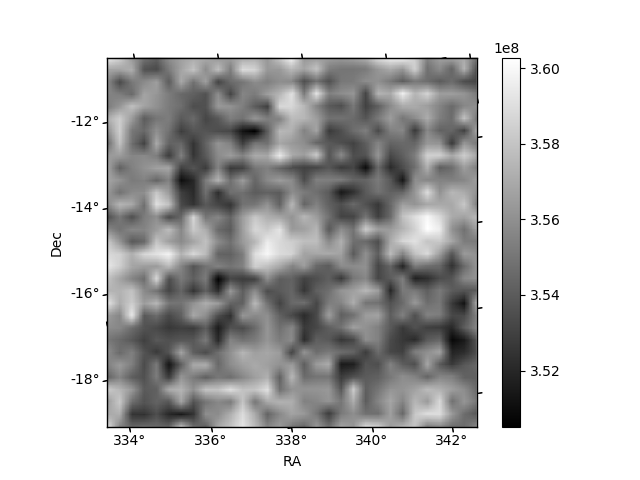
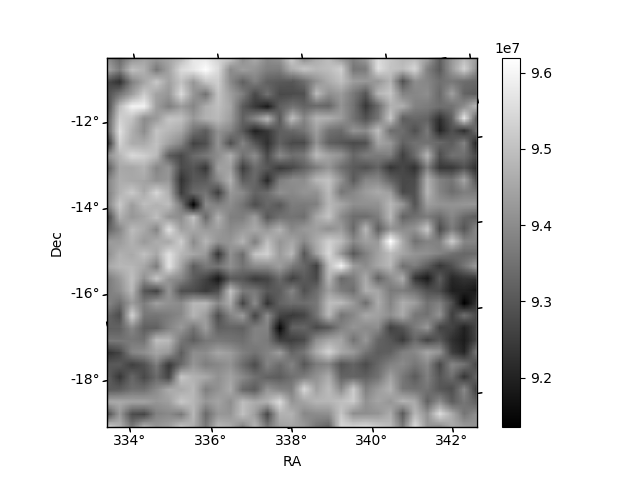
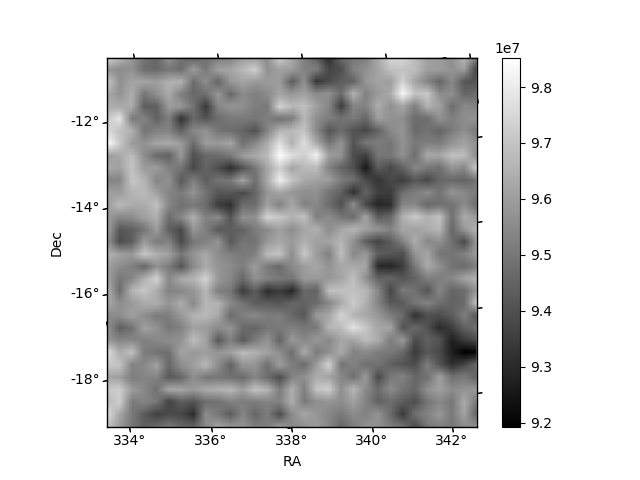
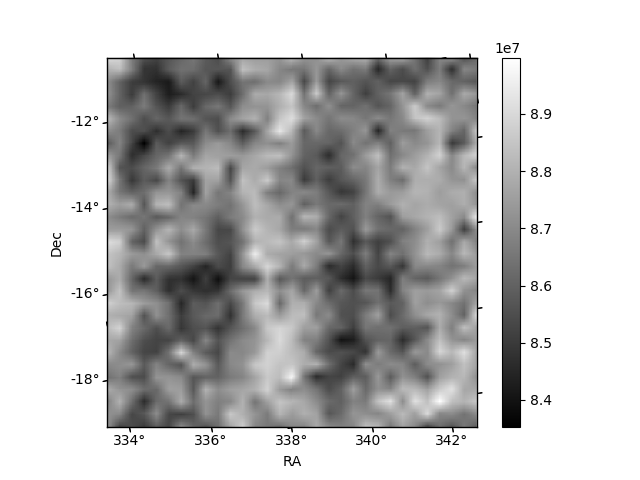
Histogram calculated using DETX and DETY for each event in the final _common_clean file
| Quadrant A | 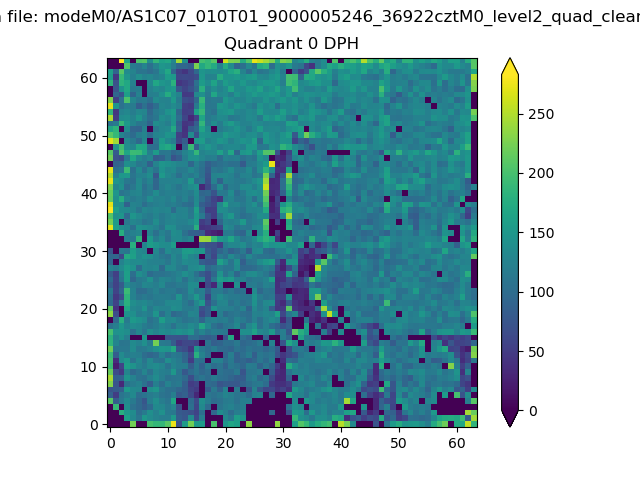 |
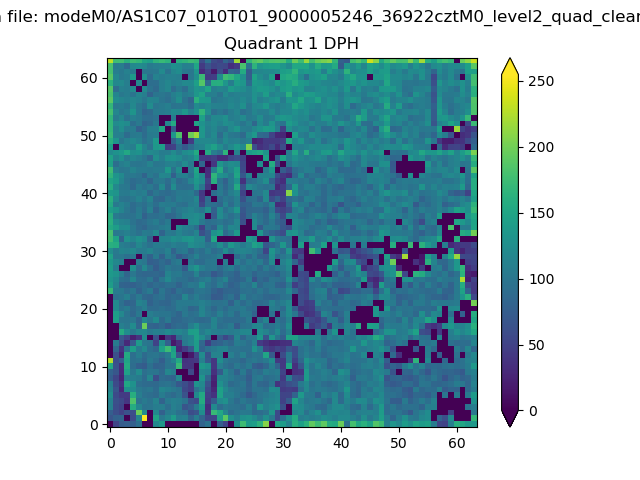 |
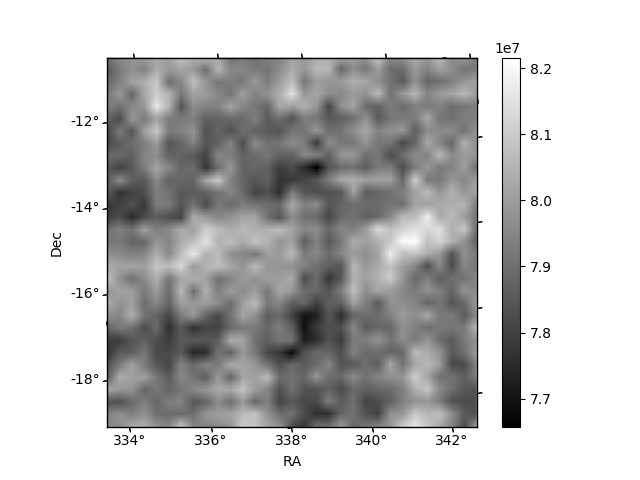
Quadrant B |
|---|---|---|---|
| Quadrant D | 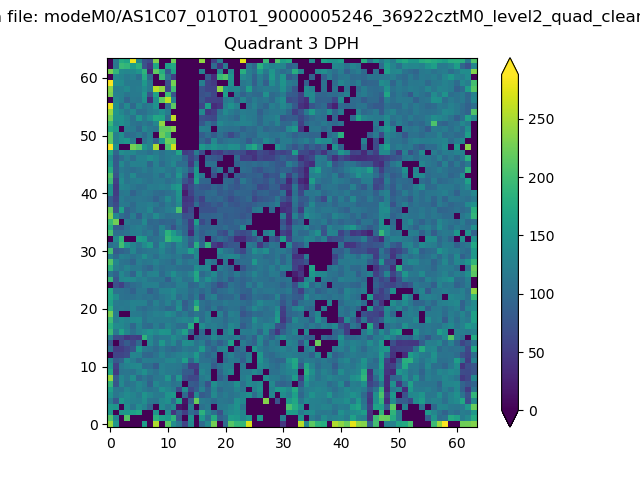 |
 |
Quadrant C |
| Plot type | Count rate plots | Images |
|---|---|---|
| Comparison with Poisson distribution Blue bars denote a histogram of data divided into 1 sec bins. Red curve is a Poisson curve with rate = median count rate of data. |
 |
 |
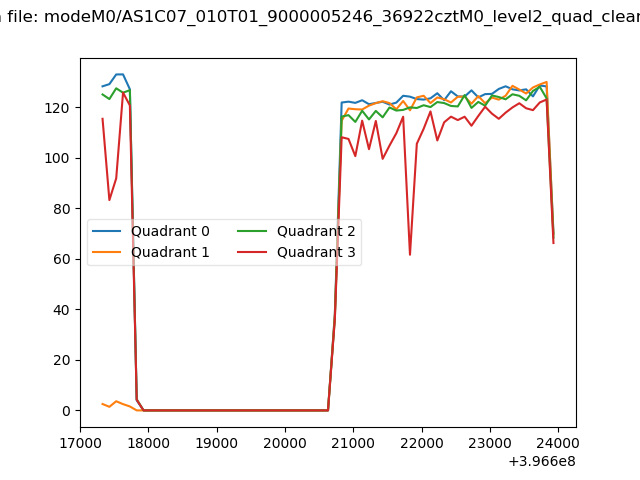
| Quadrant-wise count rates Data is divided into 100 sec bins |
 |
|
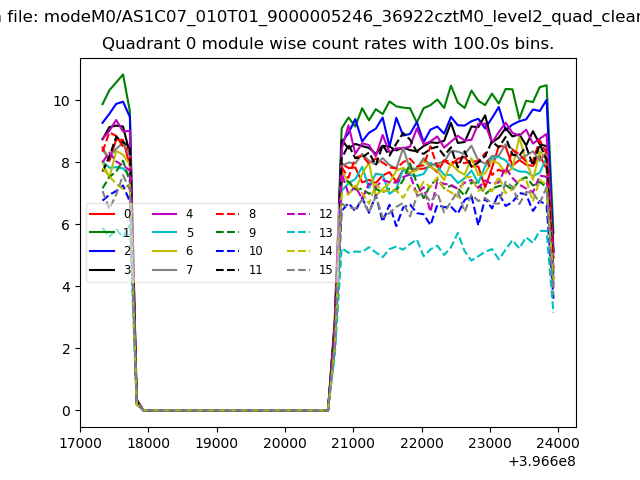
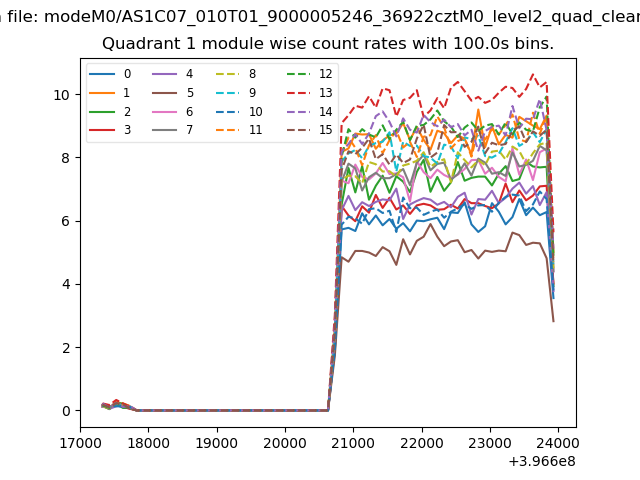
| Module-wise count rates for Quadrant A Data is divided into 100 sec bins |
 |
 |
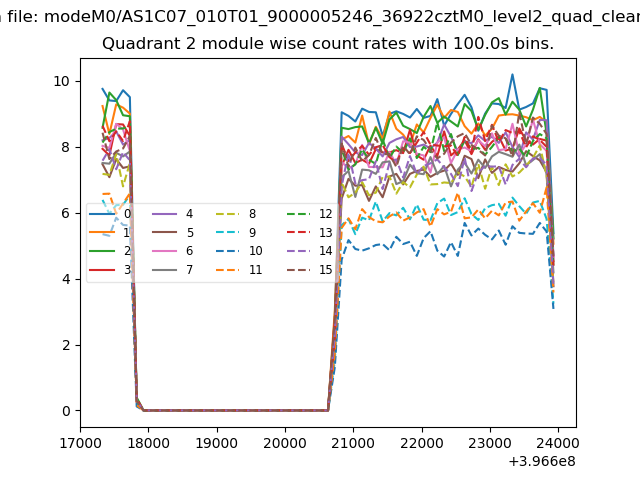
| Module-wise count rates for Quadrant B Data is divided into 100 sec bins |
 |
 |
| Module-wise count rates for Quadrant C Data is divided into 100 sec bins |
 |
 |
| Module-wise count rates for Quadrant D Data is divided into 100 sec bins |
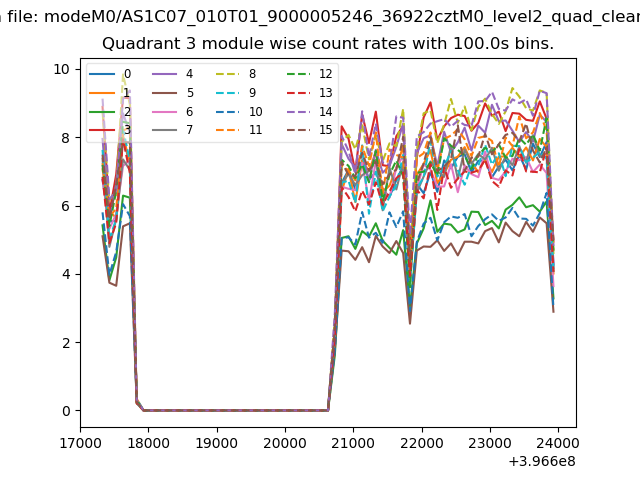 |
 |
| Parameter | Plot |
|---|---|
| CZT HV Monitor | 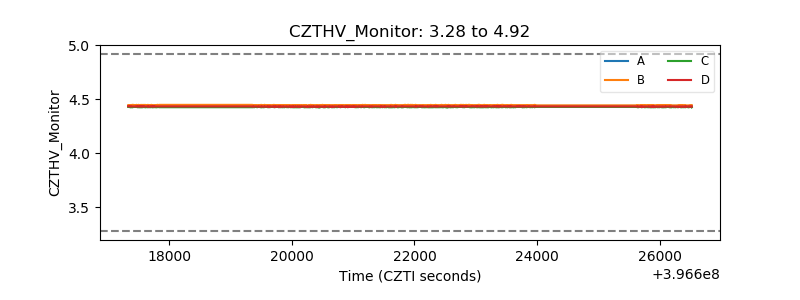 |
| D_VDD | 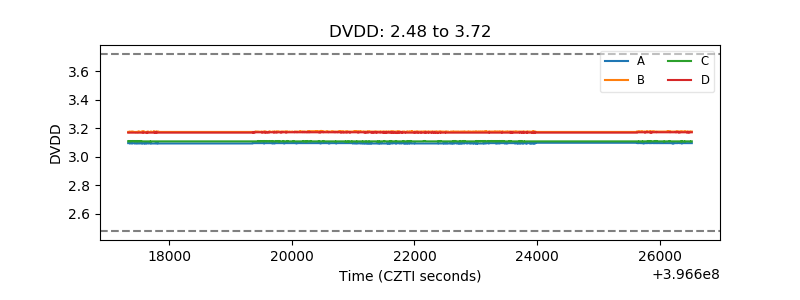 |
| Temperature 1 | 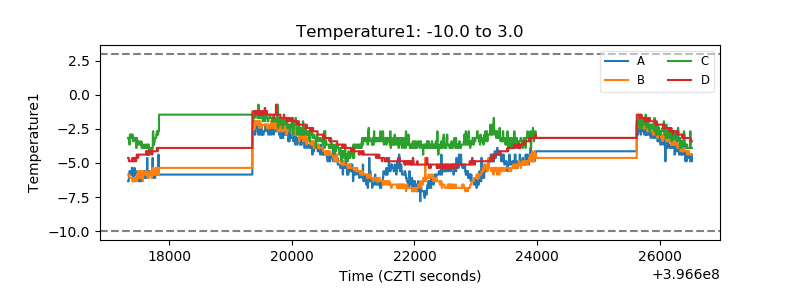 |
| Veto HV Monitor |  |
| Veto LLD | 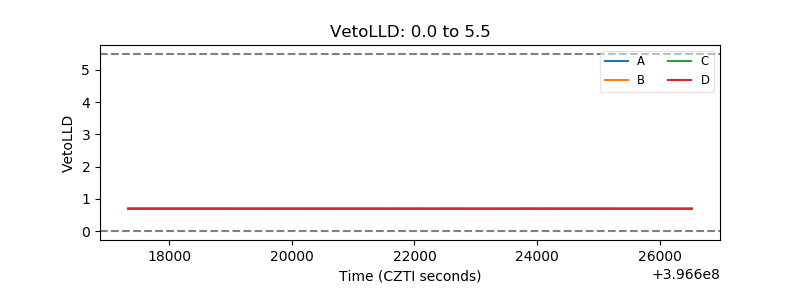 |
| Alpha Counter | 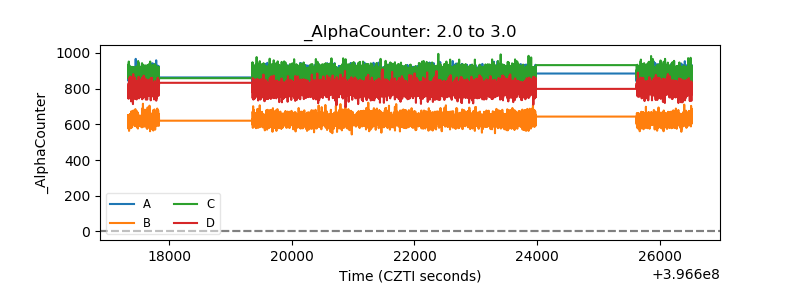 |
| _CPM_Rate | 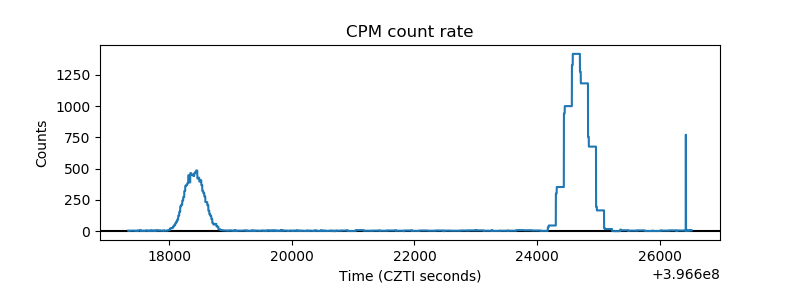 |
| CZT Counter | 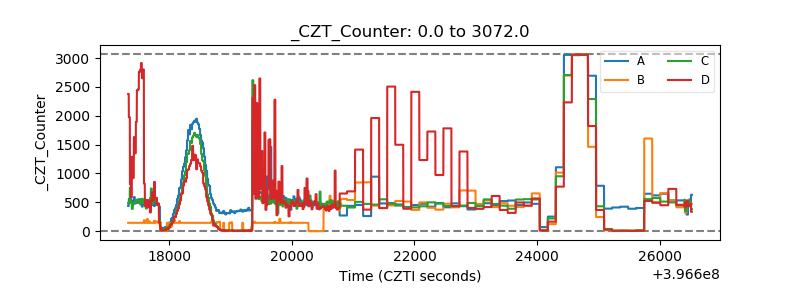 |
| +2.5 Volts monitor |  |
| +5 Volts monitor | 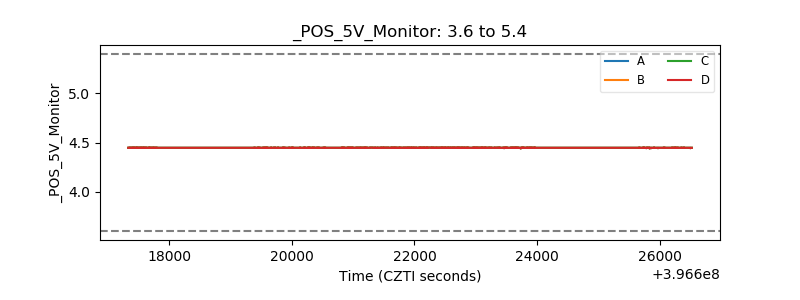 |
| _ROLL_ROT | 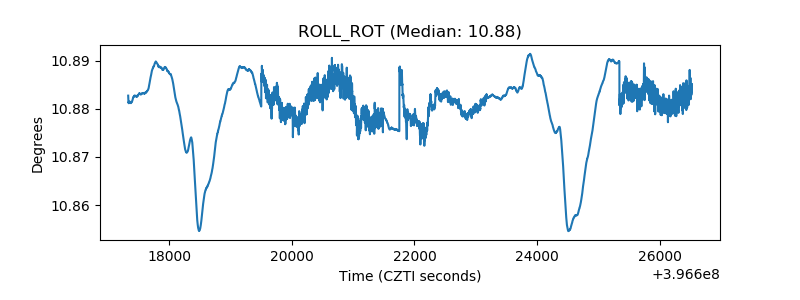 |
| _Roll_DEC | 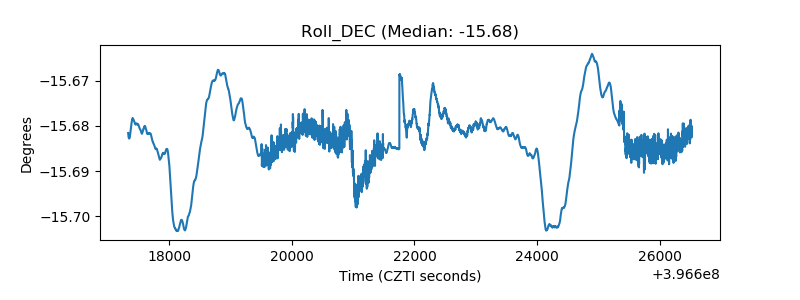 |
| _Roll_RA | 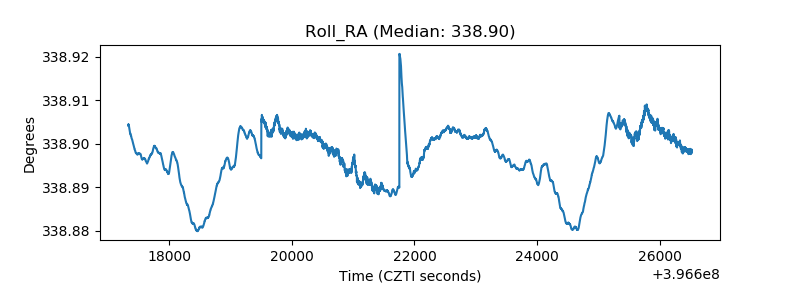 |
| Veto Counter | 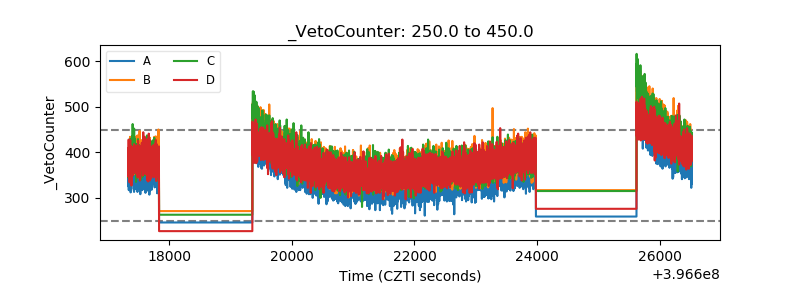 |