| Param | Original file | Final file |
|---|---|---|
| Filename | modeM0/AS1C07_010T01_9000005246_36925cztM0_level2.evt | modeM0/AS1C07_010T01_9000005246_36925cztM0_level2_quad_clean.evt |
| Size (bytes) | 2,726,766,720 | 469,863,360 |
| Size | 2.5 GB | 448.1 MB |
| Events in quadrant A | 21,018,012 | 3,371,570 |
| Events in quadrant B | 11,641,620 | 1,459,256 |
| Events in quadrant C | 21,764,965 | 3,309,237 |
| Events in quadrant D | 25,227,800 | 3,137,845 |
| Mode SS | |||
|---|---|---|---|
| Quadrant | BADHDUFLAG | Total packets | Discarded packets |
| A | 0 | 876 | 0 |
| B | 0 | 876 | 0 |
| C | 0 | 876 | 0 |
| D | 0 | 876 | 0 |
| Mode M9 | |||
|---|---|---|---|
| Quadrant | BADHDUFLAG | Total packets | Discarded packets |
| A | 0 | 139 | 0 |
| B | 0 | 139 | 0 |
| C | 0 | 139 | 0 |
| D | 0 | 139 | 0 |
| Mode M0 | |||
|---|---|---|---|
| Quadrant | BADHDUFLAG | Total packets | Discarded packets |
| A | 0 | 89625 | 10 |
| B | 0 | 60142 | 9 |
| C | 0 | 90364 | 9 |
| D | 0 | 104383 | 9 |
| Quadrant | Total seconds | Saturated seconds | Saturation percentage |
|---|---|---|---|
| A | 42974 | 81 | 0.188486% |
| B | 42728 | 29733 | 69.586688% |
| C | 42974 | 223 | 0.518918% |
| D | 42974 | 1326 | 3.085587% |
Noise dominated data is calculated using 1-second bins in cleaned event files. If a bin has >2000 counts, and if more than 50% of those come from <1% of pixels, then it is considered to be noise-dominated and hence unusable.
| Quadrant | # 1 sec bins | Bins with >0 counts | Bins with >2000 counts | High rate bins dominated by noise | Noise dominated (total time) | Noise dominated (detector-on time) | Marked lightcurve |
|---|---|---|---|---|---|---|---|
| A | 56890 | 42983 | 27 | 27 | 0.05% | 0.06% | 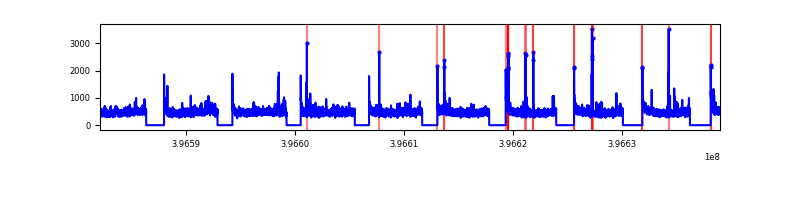 |
| B | 56890 | 42731 | 90 | 90 | 0.16% | 0.21% | 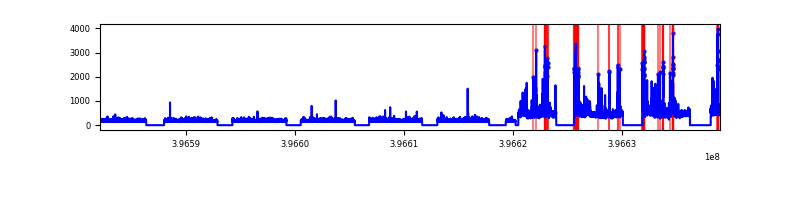 |
| C | 56890 | 42983 | 163 | 163 | 0.29% | 0.38% | 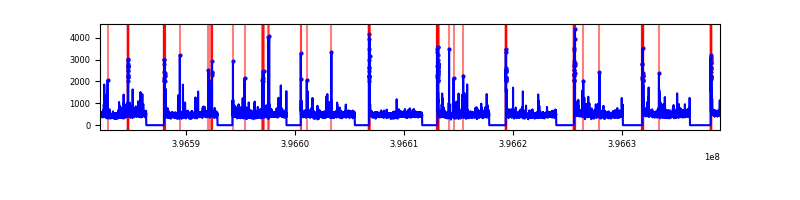 |
| D | 56890 | 42983 | 1172 | 1172 | 2.06% | 2.73% | 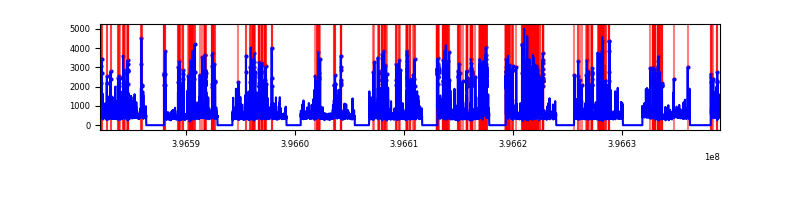 |
Top three noisy pixels from each quadrant. If the there are fewer than three noisy pixels in the level2.evt file, extra rows are filled as -1
| Pixel properties | Quadrant properties | ||||||
|---|---|---|---|---|---|---|---|
| Quadrant | DetID | PixID | Counts | Sigma | Mean | Median | Sigma |
| A | 10 | 83 | 1438220 | 1471.95 | 4893 | 4796 | 973.8 |
| A | 12 | 189 | 361157 | 365.94 | 4893 | 4796 | 973.8 |
| A | 9 | 143 | 138760 | 137.56 | 4893 | 4796 | 973.8 |
| B | 12 | 243 | 4103299 | 13691.88 | 1580 | 1544 | 299.6 |
| B | 5 | 172 | 403331 | 1341.19 | 1580 | 1544 | 299.6 |
| B | 0 | 229 | 318655 | 1058.53 | 1580 | 1544 | 299.6 |
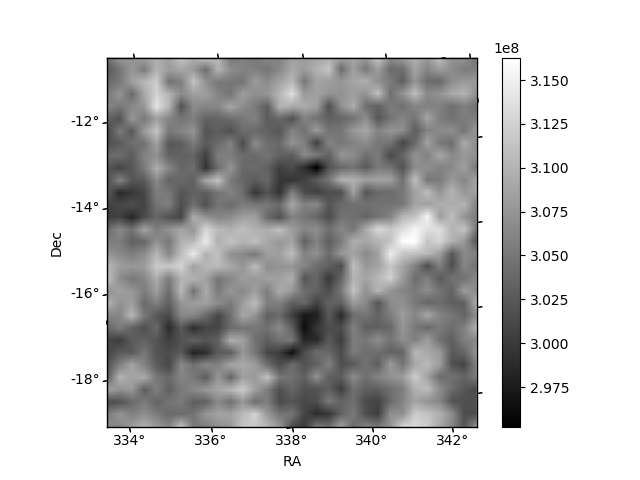
| C | 15 | 214 | 1799301 | 1613.21 | 4782 | 4816 | 1112.4 |
| C | 0 | 10 | 697137 | 622.39 | 4782 | 4816 | 1112.4 |
| C | 0 | 207 | 532697 | 474.56 | 4782 | 4816 | 1112.4 |
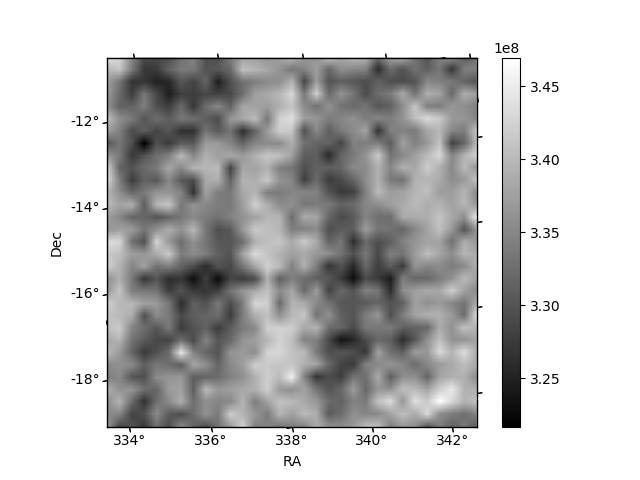
| D | 12 | 17 | 1714408 | 1489.25 | 4739 | 4614 | 1148.1 |
| D | 13 | 171 | 1624576 | 1411.01 | 4739 | 4614 | 1148.1 |
| D | 13 | 249 | 1539566 | 1336.96 | 4739 | 4614 | 1148.1 |
Histogram calculated using DETX and DETY for each event in the final _common_clean file
| Quadrant A |  |
 |
Quadrant B |
|---|---|---|---|
| Quadrant D |  |
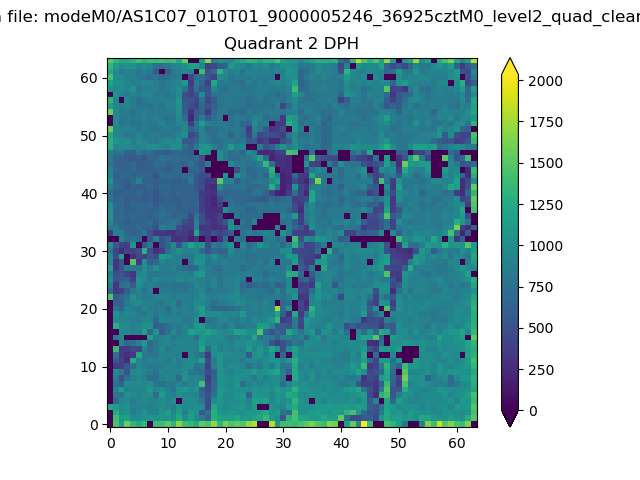 |
Quadrant C |
| Plot type | Count rate plots | Images |
|---|---|---|
| Comparison with Poisson distribution Blue bars denote a histogram of data divided into 1 sec bins. Red curve is a Poisson curve with rate = median count rate of data. |
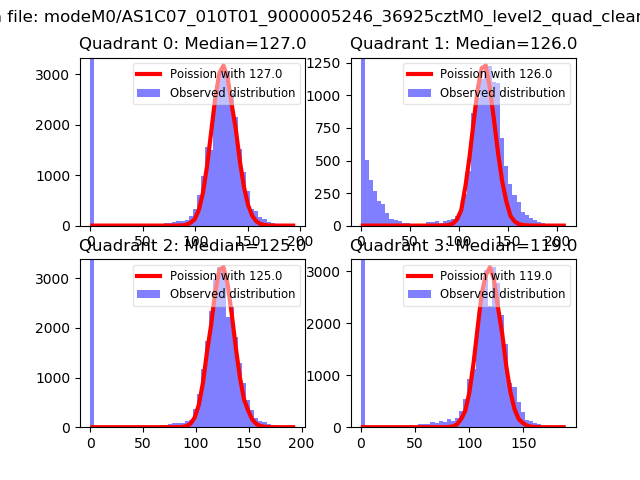 |
 |
| Quadrant-wise count rates Data is divided into 100 sec bins |
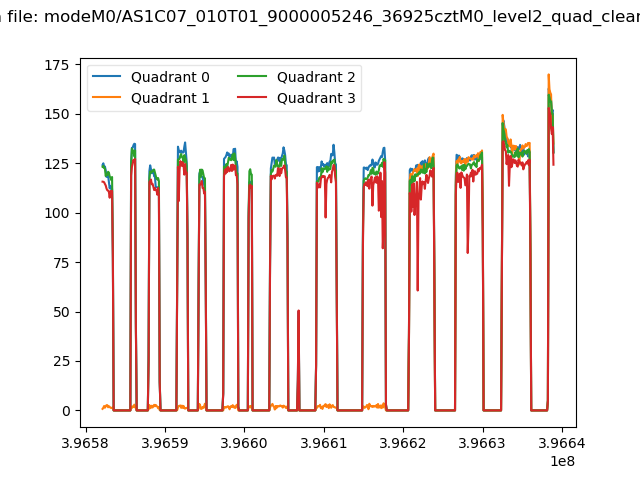 |
|
| Module-wise count rates for Quadrant A Data is divided into 100 sec bins |
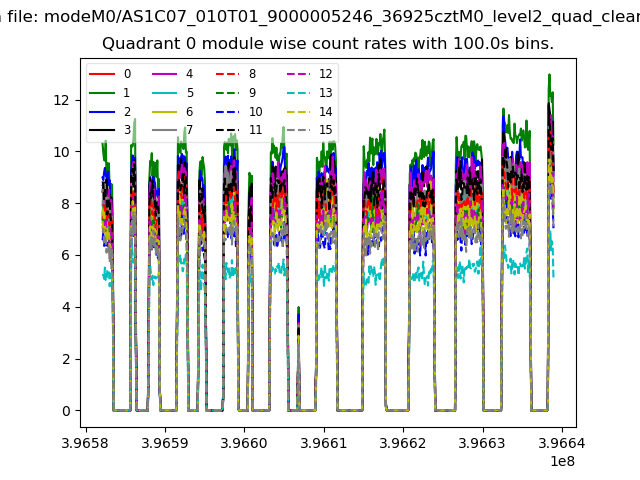 |
 |
| Module-wise count rates for Quadrant B Data is divided into 100 sec bins |
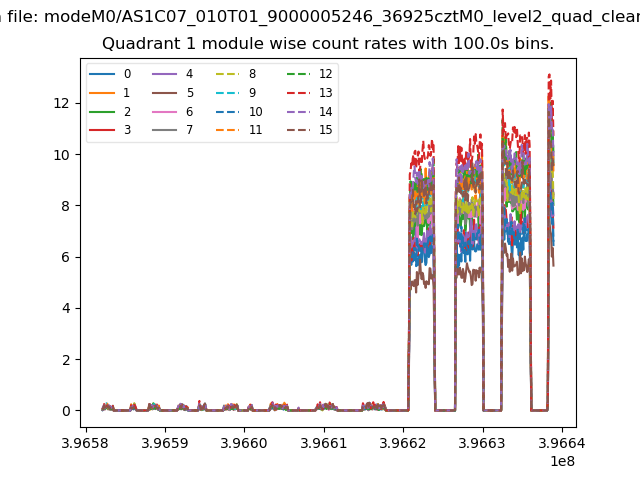 |
 |
| Module-wise count rates for Quadrant C Data is divided into 100 sec bins |
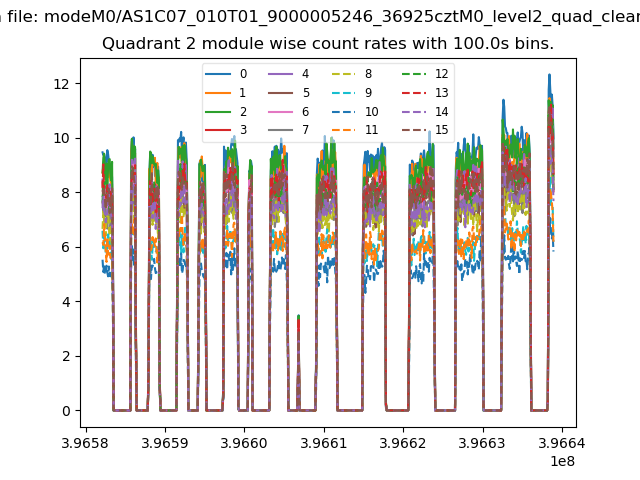 |
 |
| Module-wise count rates for Quadrant D Data is divided into 100 sec bins |
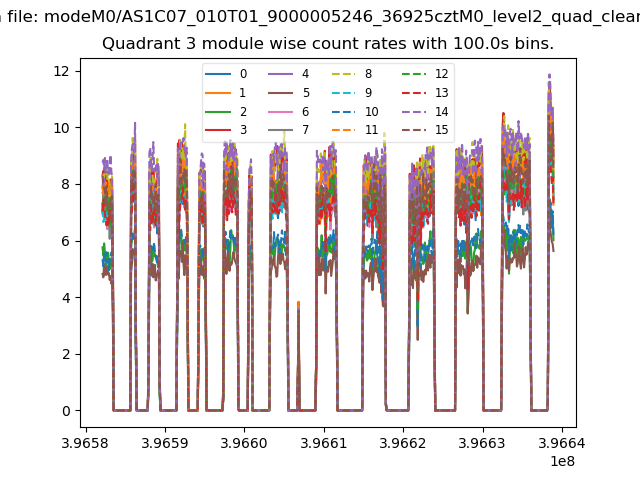 |
 |
| Parameter | Plot |
|---|---|
| CZT HV Monitor | 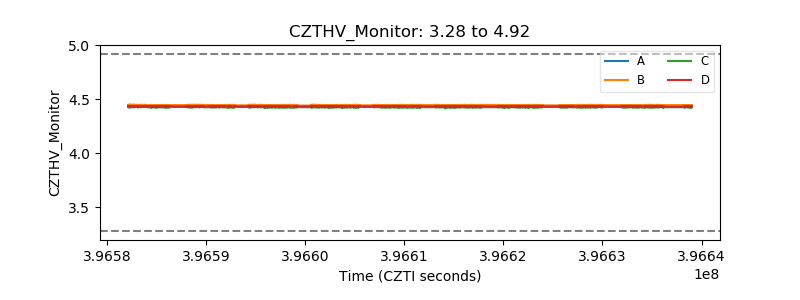 |
| D_VDD |  |
| Temperature 1 | 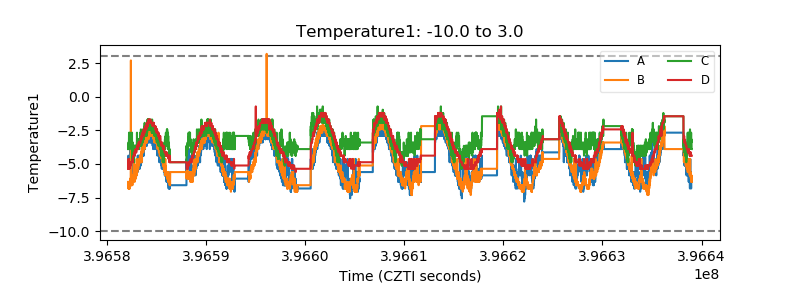 |
| Veto HV Monitor | 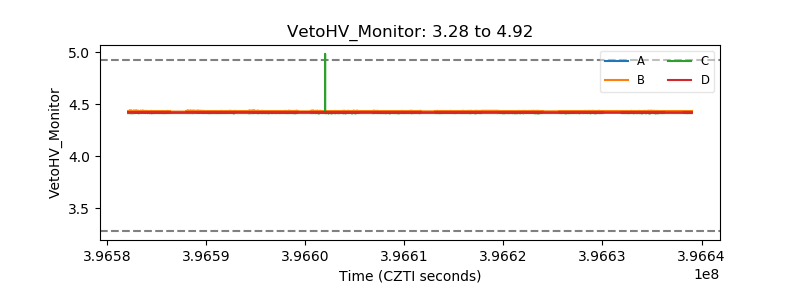 |
| Veto LLD | 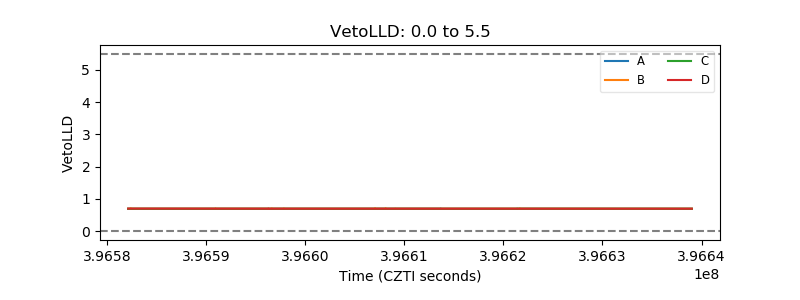 |
| Alpha Counter | 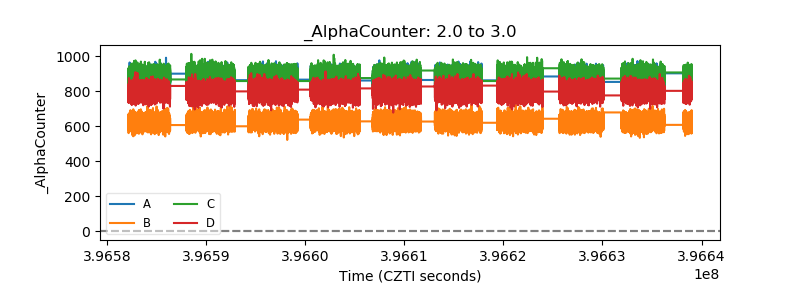 |
| _CPM_Rate | 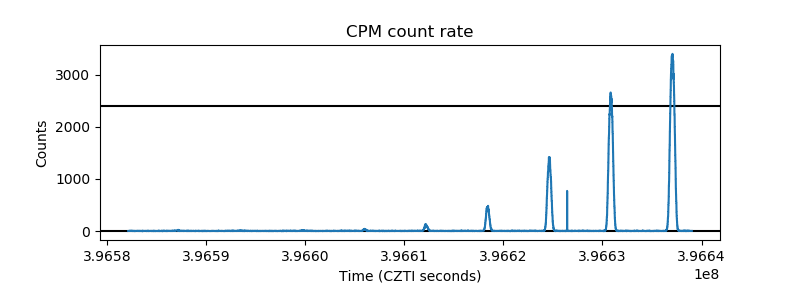 |
| CZT Counter | 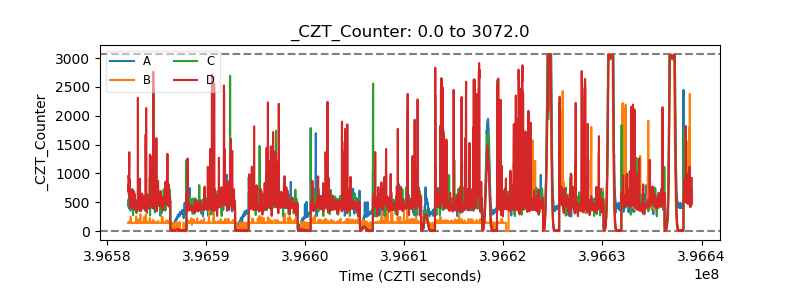 |
| +2.5 Volts monitor |  |
| +5 Volts monitor | 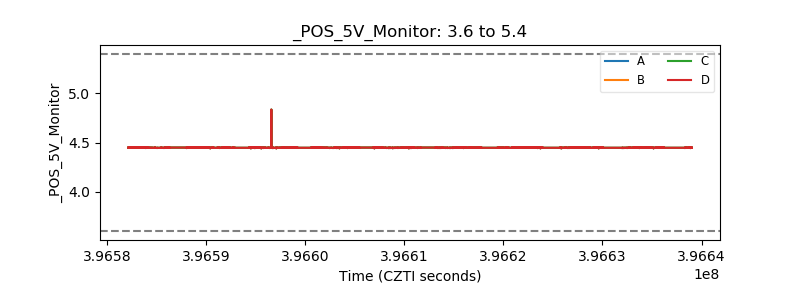 |
| _ROLL_ROT | 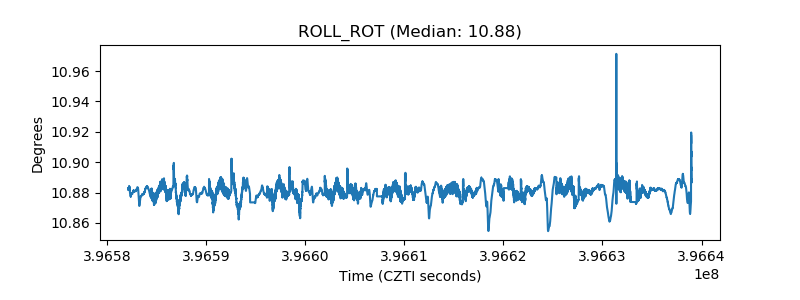 |
| _Roll_DEC | 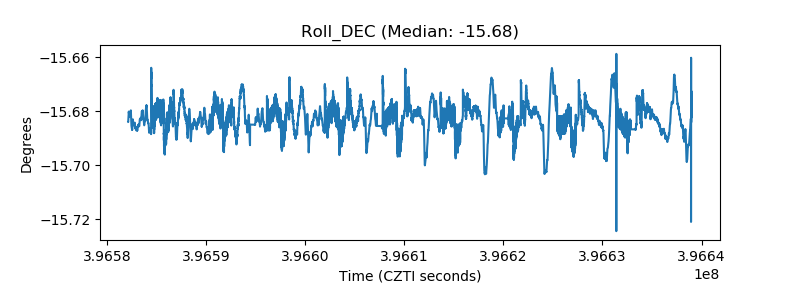 |
| _Roll_RA | 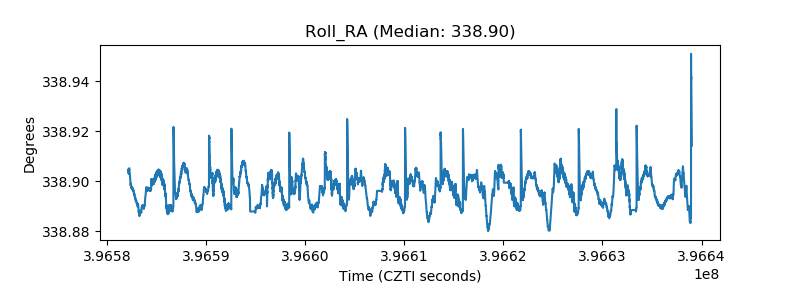 |
| Veto Counter | 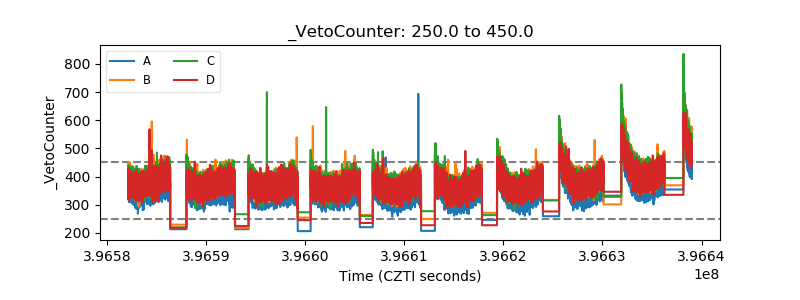 |