| Param | Original file | Final file |
|---|---|---|
| Filename | modeM0/AS1C07_010T01_9000005246_36926cztM0_level2.evt | modeM0/AS1C07_010T01_9000005246_36926cztM0_level2_quad_clean.evt |
| Size (bytes) | 993,441,600 | 234,328,320 |
| Size | 947.4 MB | 223.5 MB |
| Events in quadrant A | 6,859,641 | 1,567,632 |
| Events in quadrant B | 7,411,889 | 1,578,136 |
| Events in quadrant C | 7,302,922 | 1,543,992 |
| Events in quadrant D | 7,586,706 | 1,463,033 |
| Mode SS | |||
|---|---|---|---|
| Quadrant | BADHDUFLAG | Total packets | Discarded packets |
| A | 0 | 278 | 0 |
| B | 0 | 278 | 0 |
| C | 0 | 278 | 0 |
| D | 0 | 278 | 0 |
| Mode M9 | |||
|---|---|---|---|
| Quadrant | BADHDUFLAG | Total packets | Discarded packets |
| A | 0 | 58 | 0 |
| B | 0 | 58 | 0 |
| C | 0 | 58 | 0 |
| D | 0 | 58 | 0 |
| Mode M0 | |||
|---|---|---|---|
| Quadrant | BADHDUFLAG | Total packets | Discarded packets |
| A | 0 | 28882 | 4 |
| B | 0 | 30833 | 3 |
| C | 0 | 29597 | 3 |
| D | 0 | 31576 | 5 |
| Quadrant | Total seconds | Saturated seconds | Saturation percentage |
|---|---|---|---|
| A | 13691 | 32 | 0.233730% |
| B | 13691 | 127 | 0.927617% |
| C | 13691 | 84 | 0.613542% |
| D | 13690 | 261 | 1.906501% |
Noise dominated data is calculated using 1-second bins in cleaned event files. If a bin has >2000 counts, and if more than 50% of those come from <1% of pixels, then it is considered to be noise-dominated and hence unusable.
| Quadrant | # 1 sec bins | Bins with >0 counts | Bins with >2000 counts | High rate bins dominated by noise | Noise dominated (total time) | Noise dominated (detector-on time) | Marked lightcurve |
|---|---|---|---|---|---|---|---|
| A | 19430 | 13694 | 10 | 10 | 0.05% | 0.07% | 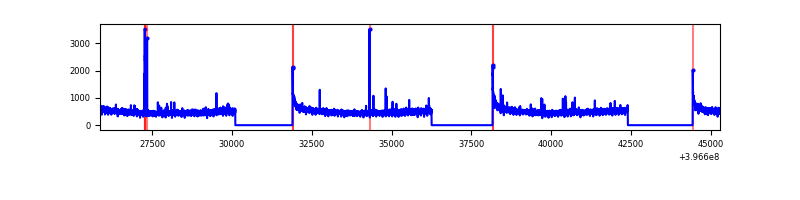 |
| B | 19430 | 13694 | 64 | 64 | 0.33% | 0.47% | 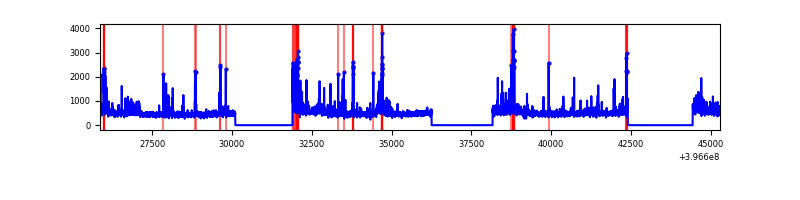 |
| C | 19430 | 13694 | 54 | 54 | 0.28% | 0.39% | 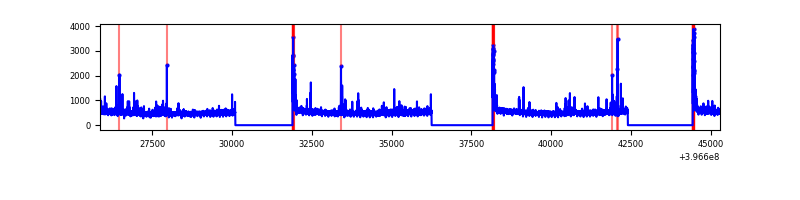 |
| D | 19430 | 13694 | 234 | 234 | 1.20% | 1.71% | 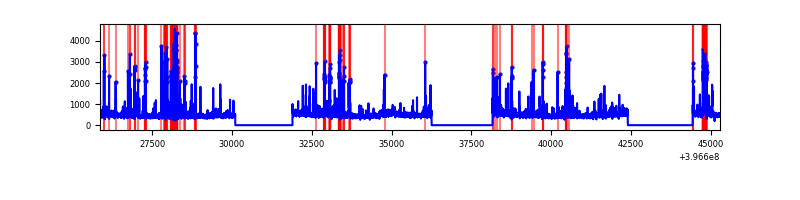 |
Top three noisy pixels from each quadrant. If the there are fewer than three noisy pixels in the level2.evt file, extra rows are filled as -1
| Pixel properties | Quadrant properties | ||||||
|---|---|---|---|---|---|---|---|
| Quadrant | DetID | PixID | Counts | Sigma | Mean | Median | Sigma |
| A | 10 | 83 | 475461 | 1470.24 | 1623 | 1597 | 322.3 |
| A | 9 | 143 | 53984 | 162.54 | 1623 | 1597 | 322.3 |
| A | 13 | 6 | 23672 | 68.49 | 1623 | 1597 | 322.3 |
| B | 5 | 172 | 304358 | 999.39 | 1618 | 1585 | 303.0 |
| B | 0 | 229 | 184386 | 603.39 | 1618 | 1585 | 303.0 |
| B | 5 | 255 | 115646 | 376.49 | 1618 | 1585 | 303.0 |
| C | 15 | 214 | 575256 | 1554.87 | 1597 | 1614 | 368.9 |
| C | 0 | 10 | 308467 | 831.73 | 1597 | 1614 | 368.9 |
| C | 0 | 207 | 122502 | 327.67 | 1597 | 1614 | 368.9 |
| D | 13 | 171 | 543169 | 1414.26 | 1585 | 1544 | 383.0 |
| D | 2 | 153 | 271956 | 706.08 | 1585 | 1544 | 383.0 |
| D | 13 | 249 | 261707 | 679.32 | 1585 | 1544 | 383.0 |
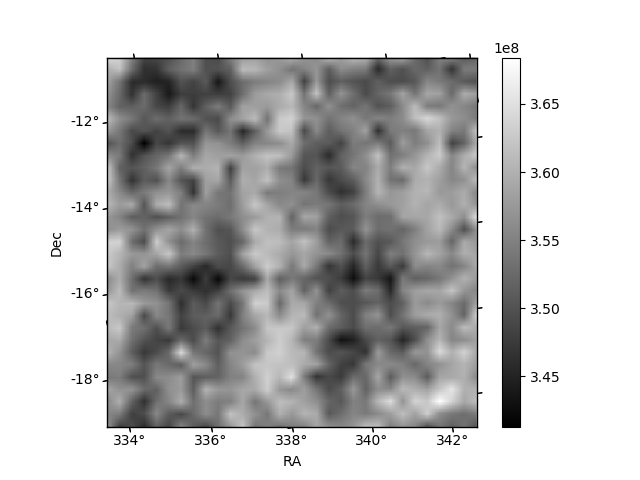
Histogram calculated using DETX and DETY for each event in the final _common_clean file
| Quadrant A |  |
 |
Quadrant B |
|---|---|---|---|
| Quadrant D |  |
 |
Quadrant C |
| Plot type | Count rate plots | Images |
|---|---|---|
| Comparison with Poisson distribution Blue bars denote a histogram of data divided into 1 sec bins. Red curve is a Poisson curve with rate = median count rate of data. |
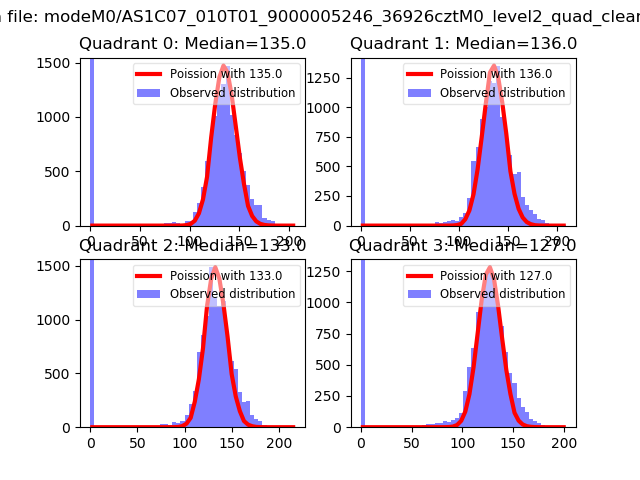 |
 |
| Quadrant-wise count rates Data is divided into 100 sec bins |
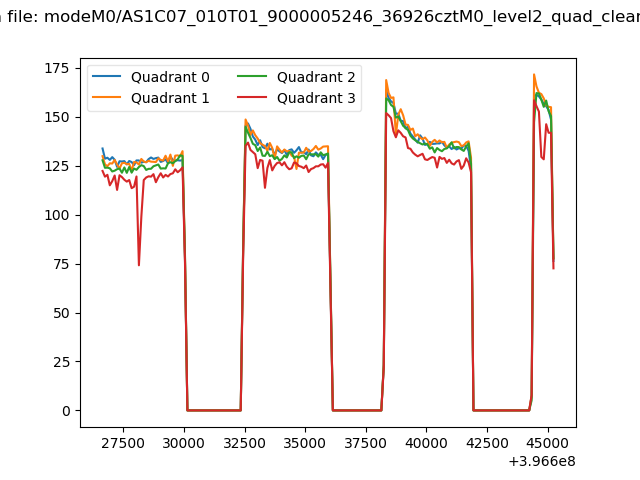 |
|
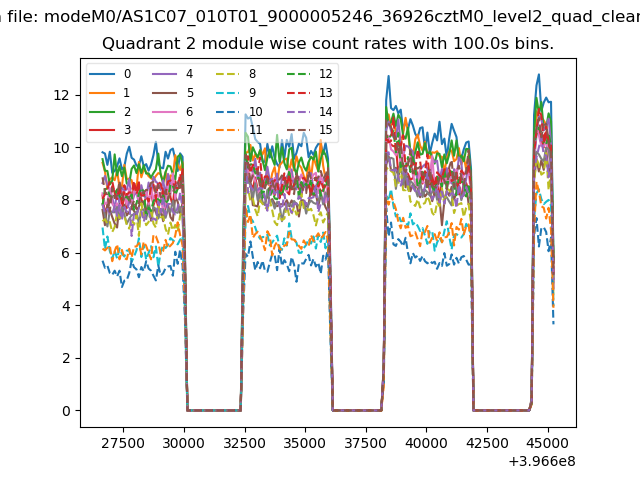
| Module-wise count rates for Quadrant A Data is divided into 100 sec bins |
 |
 |
| Module-wise count rates for Quadrant B Data is divided into 100 sec bins |
 |
 |
| Module-wise count rates for Quadrant C Data is divided into 100 sec bins |
 |
 |
| Module-wise count rates for Quadrant D Data is divided into 100 sec bins |
 |
 |
| Parameter | Plot |
|---|---|
| CZT HV Monitor | 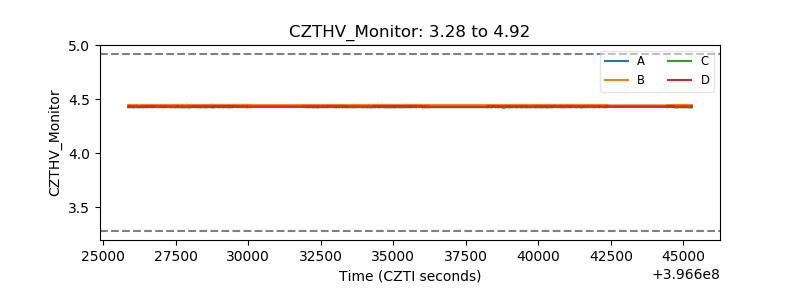 |
| D_VDD |  |
| Temperature 1 |  |
| Veto HV Monitor |  |
| Veto LLD |  |
| Alpha Counter | 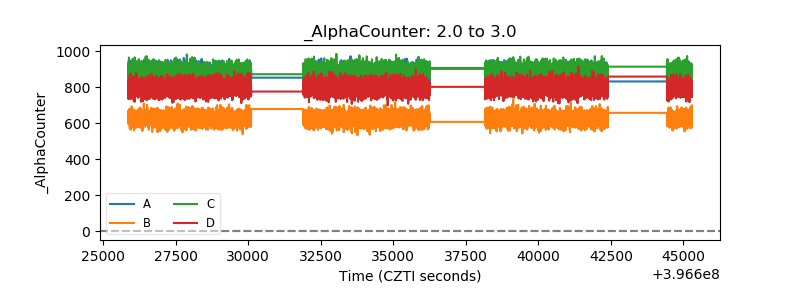 |
| _CPM_Rate | 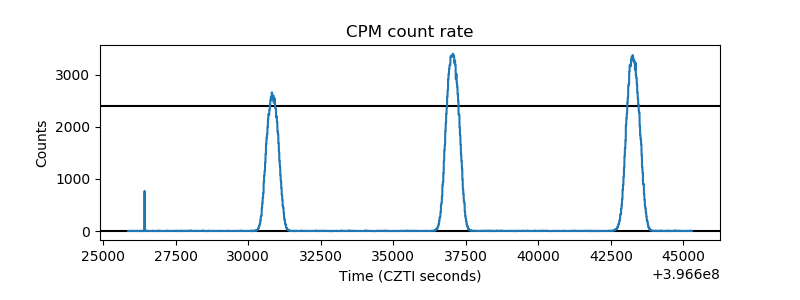 |
| CZT Counter |  |
| +2.5 Volts monitor |  |
| +5 Volts monitor |  |
| _ROLL_ROT |  |
| _Roll_DEC |  |
| _Roll_RA |  |
| Veto Counter |  |