| Param | Original file | Final file |
|---|---|---|
| Filename | modeM0/AS1C07_010T01_9000005246_36927cztM0_level2.evt | modeM0/AS1C07_010T01_9000005246_36927cztM0_level2_quad_clean.evt |
| Size (bytes) | 385,727,040 | 72,927,360 |
| Size | 367.9 MB | 69.5 MB |
| Events in quadrant A | 2,371,819 | 479,103 |
| Events in quadrant B | 2,585,629 | 493,142 |
| Events in quadrant C | 2,549,442 | 481,592 |
| Events in quadrant D | 3,857,139 | 426,261 |
| Mode SS | |||
|---|---|---|---|
| Quadrant | BADHDUFLAG | Total packets | Discarded packets |
| A | 0 | 96 | 0 |
| B | 0 | 96 | 0 |
| C | 0 | 96 | 0 |
| D | 0 | 96 | 0 |
| Mode M9 | |||
|---|---|---|---|
| Quadrant | BADHDUFLAG | Total packets | Discarded packets |
| A | 0 | 42 | 0 |
| B | 0 | 42 | 0 |
| C | 0 | 42 | 0 |
| D | 0 | 42 | 0 |
| Mode M0 | |||
|---|---|---|---|
| Quadrant | BADHDUFLAG | Total packets | Discarded packets |
| A | 0 | 9810 | 1 |
| B | 0 | 10581 | 1 |
| C | 0 | 10173 | 1 |
| D | 0 | 14418 | 1 |
| Quadrant | Total seconds | Saturated seconds | Saturation percentage |
|---|---|---|---|
| A | 4674 | 10 | 0.213950% |
| B | 4674 | 31 | 0.663243% |
| C | 4674 | 38 | 0.813008% |
| D | 4674 | 472 | 10.098417% |
Noise dominated data is calculated using 1-second bins in cleaned event files. If a bin has >2000 counts, and if more than 50% of those come from <1% of pixels, then it is considered to be noise-dominated and hence unusable.
| Quadrant | # 1 sec bins | Bins with >0 counts | Bins with >2000 counts | High rate bins dominated by noise | Noise dominated (total time) | Noise dominated (detector-on time) | Marked lightcurve |
|---|---|---|---|---|---|---|---|
| A | 8831 | 4676 | 2 | 2 | 0.02% | 0.04% |  |
| B | 8831 | 4676 | 14 | 14 | 0.16% | 0.30% |  |
| C | 8831 | 4676 | 29 | 29 | 0.33% | 0.62% |  |
| D | 8831 | 4676 | 452 | 452 | 5.12% | 9.67% |  |
Top three noisy pixels from each quadrant. If the there are fewer than three noisy pixels in the level2.evt file, extra rows are filled as -1
| Pixel properties | Quadrant properties | ||||||
|---|---|---|---|---|---|---|---|
| Quadrant | DetID | PixID | Counts | Sigma | Mean | Median | Sigma |
| A | 10 | 83 | 158965 | 1376.53 | 568 | 557 | 115.1 |
| A | 13 | 6 | 13805 | 115.12 | 568 | 557 | 115.1 |
| A | 13 | 254 | 7155 | 57.34 | 568 | 557 | 115.1 |
| B | 0 | 213 | 133375 | 1234.96 | 567 | 553 | 107.6 |
| B | 5 | 172 | 65390 | 602.84 | 567 | 553 | 107.6 |
| B | 5 | 255 | 54266 | 499.42 | 567 | 553 | 107.6 |
| C | 15 | 214 | 194471 | 1491.02 | 561 | 567 | 130.0 |
| C | 0 | 10 | 127580 | 976.66 | 561 | 567 | 130.0 |
| C | 0 | 207 | 36664 | 277.57 | 561 | 567 | 130.0 |
| D | 12 | 17 | 1348105 | 10139.87 | 538 | 523 | 132.9 |
| D | 2 | 153 | 152926 | 1146.76 | 538 | 523 | 132.9 |
| D | 12 | 233 | 114715 | 859.24 | 538 | 523 | 132.9 |
Histogram calculated using DETX and DETY for each event in the final _common_clean file
| Quadrant A |  |
 |
Quadrant B |
|---|---|---|---|
| Quadrant D |  |
 |
Quadrant C |
| Plot type | Count rate plots | Images |
|---|---|---|
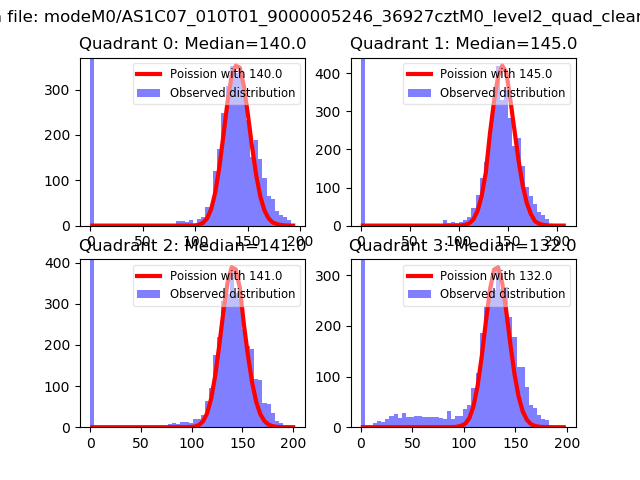
| Comparison with Poisson distribution Blue bars denote a histogram of data divided into 1 sec bins. Red curve is a Poisson curve with rate = median count rate of data. |
 |
 |
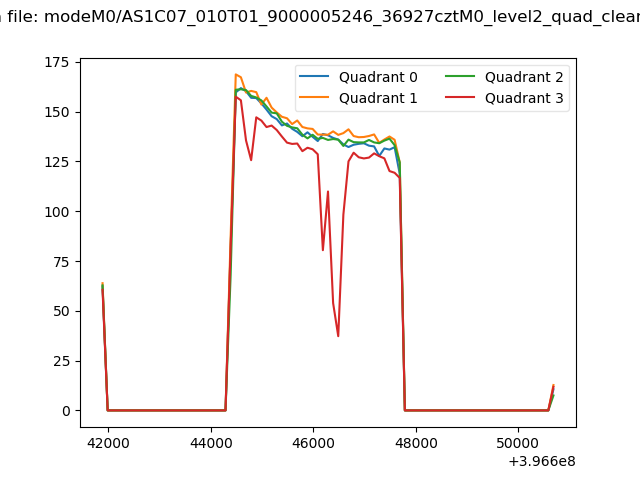
| Quadrant-wise count rates Data is divided into 100 sec bins |
 |
|
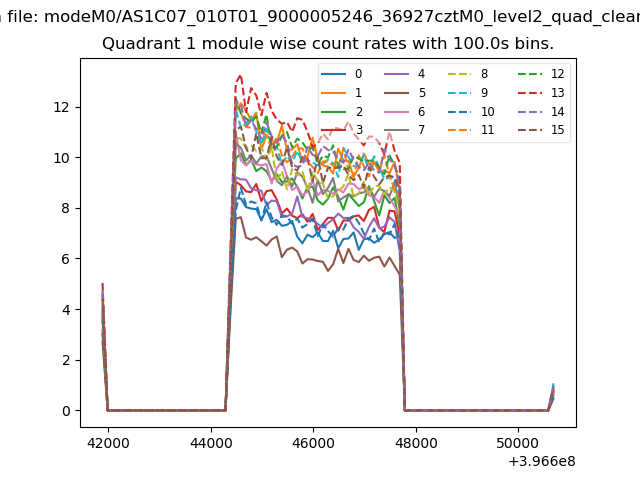
| Module-wise count rates for Quadrant A Data is divided into 100 sec bins |
 |
 |
| Module-wise count rates for Quadrant B Data is divided into 100 sec bins |
 |
 |
| Module-wise count rates for Quadrant C Data is divided into 100 sec bins |
 |
 |
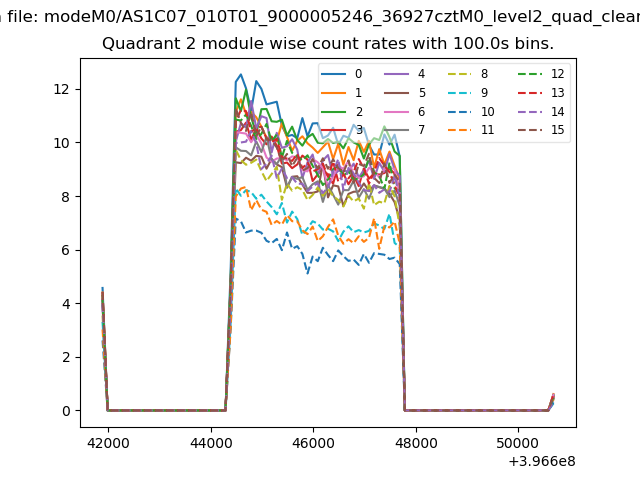
| Module-wise count rates for Quadrant D Data is divided into 100 sec bins |
 |
 |
| Parameter | Plot |
|---|---|
| CZT HV Monitor | 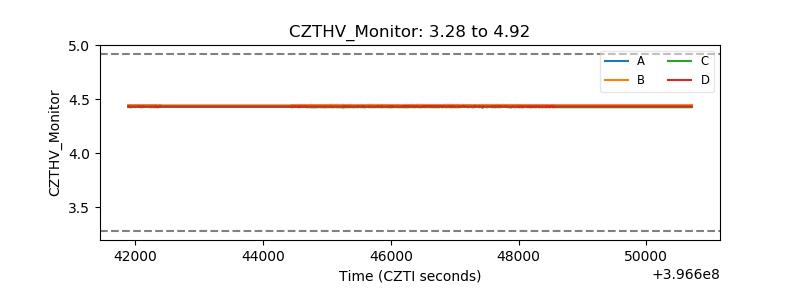 |
| D_VDD |  |
| Temperature 1 |  |
| Veto HV Monitor |  |
| Veto LLD |  |
| Alpha Counter | 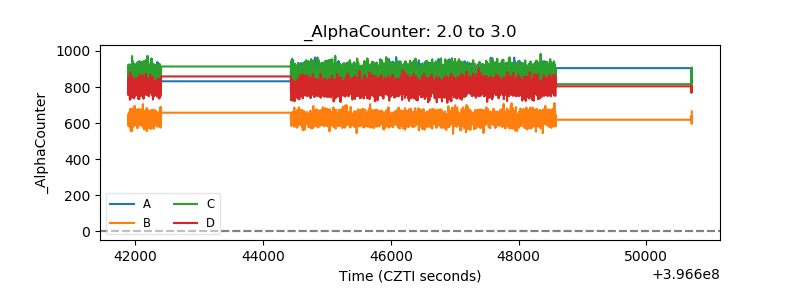 |
| _CPM_Rate | 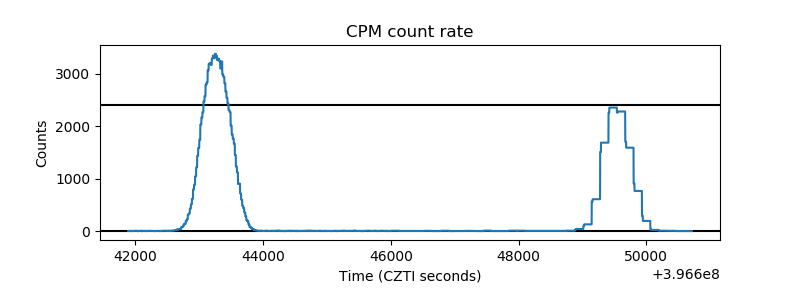 |
| CZT Counter |  |
| +2.5 Volts monitor |  |
| +5 Volts monitor |  |
| _ROLL_ROT |  |
| _Roll_DEC |  |
| _Roll_RA |  |
| Veto Counter |  |