| Param | Original file | Final file |
|---|---|---|
| Filename | modeM0/AS1A11_087T05_9000005248cztM0_level2.fits | modeM0/AS1A11_087T05_9000005248cztM0_level2_quad_clean.evt |
| Size (bytes) | 399,824,640 | 374,590,080 |
| Size | 381.3 MB | 357.2 MB |
| Events in quadrant A | 2,403,816 | 2,180,593 |
| Events in quadrant B | 2,310,012 | 2,189,358 |
| Events in quadrant C | 2,369,152 | 2,092,039 |
| Events in quadrant D | 2,020,878 | 1,877,846 |
| Mode M0 | |||
|---|---|---|---|
| Quadrant | BADHDUFLAG | Total packets | Discarded packets |
| A | 0 | 90041 | 0 |
| B | 0 | 97003 | 0 |
| C | 0 | 93448 | 0 |
| D | 0 | 116410 | 0 |
| Mode SS | |||
|---|---|---|---|
| Quadrant | BADHDUFLAG | Total packets | Discarded packets |
| A | 0 | 894 | 0 |
| B | 0 | 894 | 0 |
| C | 0 | 894 | 0 |
| D | 0 | 894 | 0 |
| Mode M9 | |||
|---|---|---|---|
| Quadrant | BADHDUFLAG | Total packets | Discarded packets |
| A | 0 | 145 | 0 |
| B | 0 | 145 | 0 |
| C | 0 | 145 | 0 |
| D | 0 | 145 | 0 |
| Quadrant | Total seconds | Saturated seconds | Saturation percentage |
|---|---|---|---|
| A | 43760 | 94 | 0.214808% |
| B | 43760 | 438 | 1.000914% |
| C | 43760 | 320 | 0.731261% |
| D | 43760 | 2498 | 5.708410% |
Noise dominated data is calculated using 1-second bins in cleaned event files. If a bin has >2000 counts, and if more than 50% of those come from <1% of pixels, then it is considered to be noise-dominated and hence unusable.
| Quadrant | # 1 sec bins | Bins with >0 counts | Bins with >2000 counts | High rate bins dominated by noise | Noise dominated (total time) | Noise dominated (detector-on time) | Marked lightcurve |
|---|---|---|---|---|---|---|---|
| A | 58307 | 43760 | 0 | 0 | 0.00% | 0.00% | 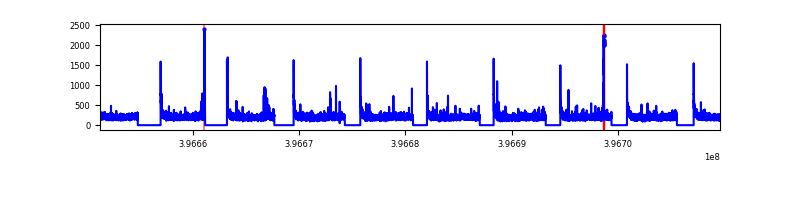 |
| B | 58307 | 43760 | 0 | 0 | 0.00% | 0.00% | 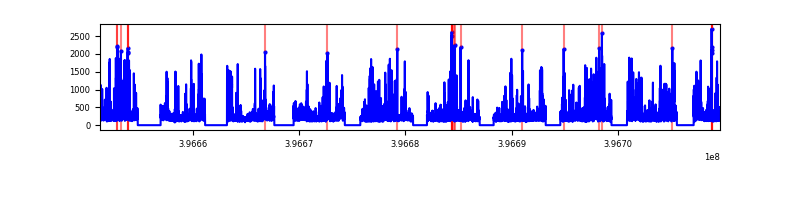 |
| C | 58307 | 43759 | 0 | 0 | 0.00% | 0.00% | 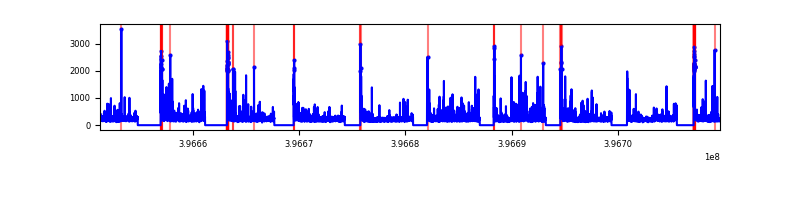 |
| D | 58307 | 43739 | 0 | 0 | 0.00% | 0.00% | 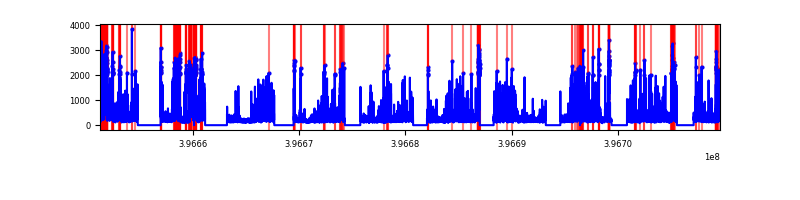 |
Top three noisy pixels from each quadrant. If the there are fewer than three noisy pixels in the level2.evt file, extra rows are filled as -1
| Pixel properties | Quadrant properties | ||||||
|---|---|---|---|---|---|---|---|
| Quadrant | DetID | PixID | Counts | Sigma | Mean | Median | Sigma |
| A | 9 | 19 | 2009 | 8.99 | 627 | 587 | 158.2 |
| A | 7 | 110 | 1995 | 8.9 | 627 | 587 | 158.2 |
| A | 0 | 29 | 1905 | 8.33 | 627 | 587 | 158.2 |
| B | 2 | 9 | 1987 | 11.37 | 611 | 581 | 123.6 |
| B | 3 | 80 | 1816 | 9.99 | 611 | 581 | 123.6 |
| B | 3 | 17 | 1682 | 8.91 | 611 | 581 | 123.6 |
| C | 1 | 81 | 1983 | 8.65 | 627 | 589 | 161.1 |
| C | 1 | 80 | 1920 | 8.26 | 627 | 589 | 161.1 |
| C | 3 | 158 | 1628 | 6.45 | 627 | 589 | 161.1 |
| D | 3 | 14 | 1498 | 6.25 | 577 | 527 | 155.4 |
| D | 10 | 189 | 1484 | 6.16 | 577 | 527 | 155.4 |
| D | 7 | 3 | 1474 | 6.1 | 577 | 527 | 155.4 |
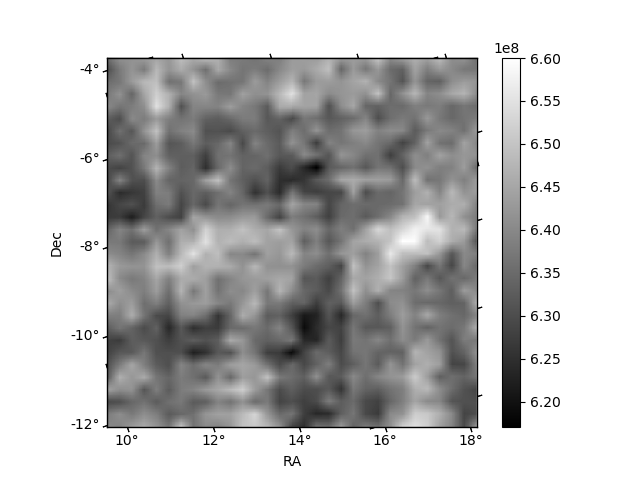
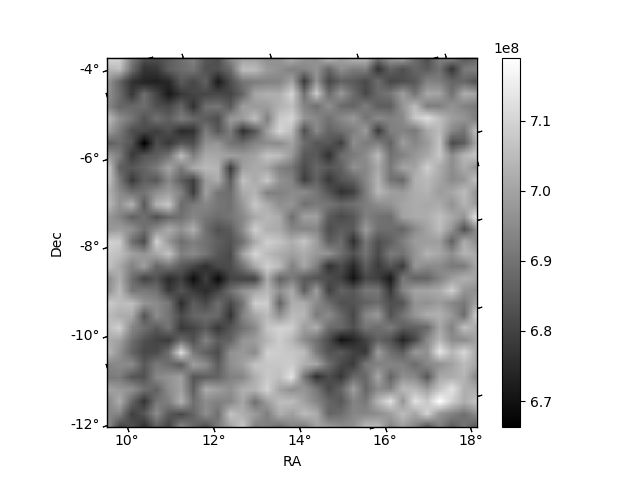
Histogram calculated using DETX and DETY for each event in the final _common_clean file
| Quadrant A | 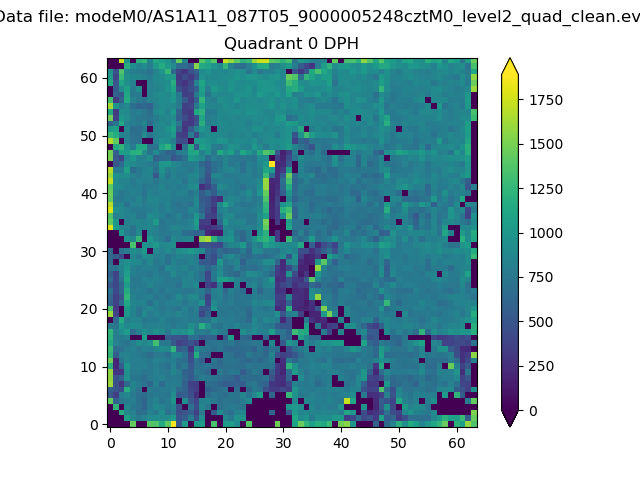 |
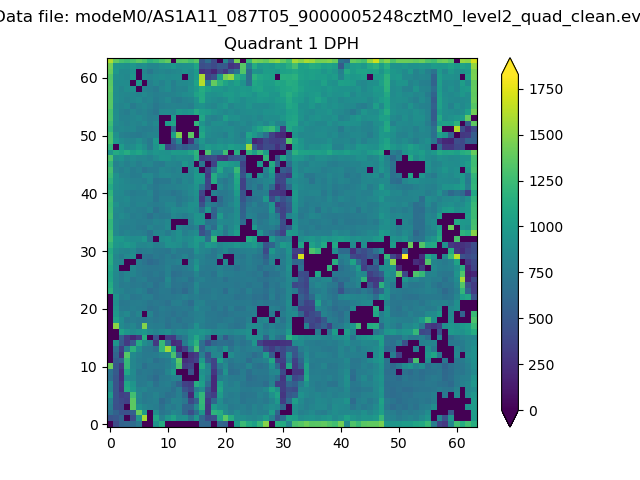 |
Quadrant B |
|---|---|---|---|
| Quadrant D | 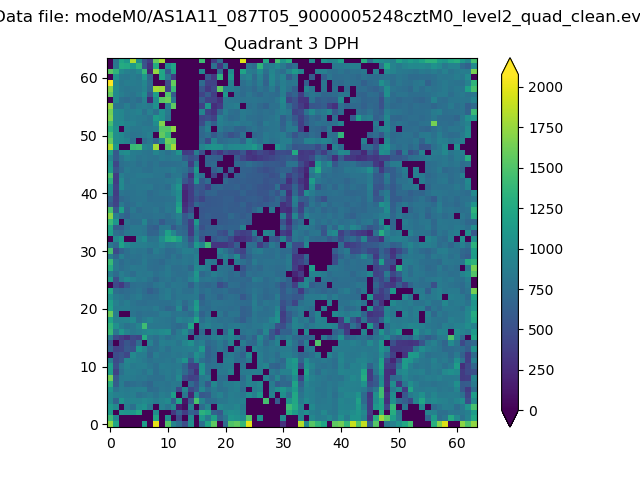 |
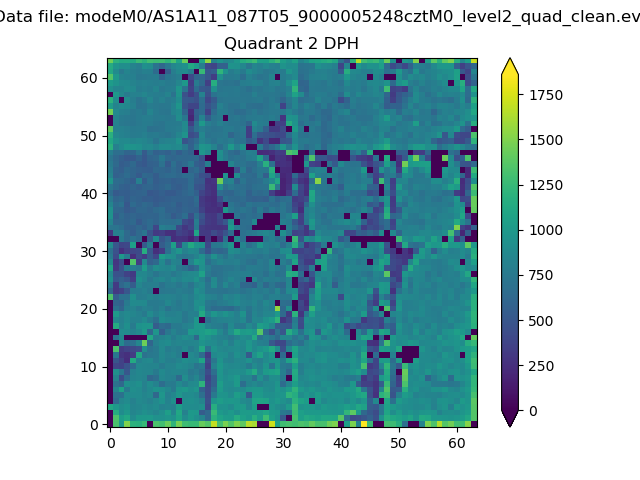 |
Quadrant C |
| Plot type | Count rate plots | Images |
|---|---|---|
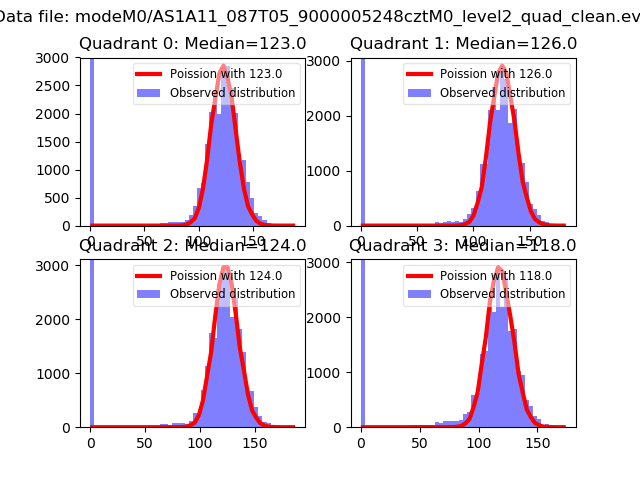
| Comparison with Poisson distribution Blue bars denote a histogram of data divided into 1 sec bins. Red curve is a Poisson curve with rate = median count rate of data. |
 |
 |
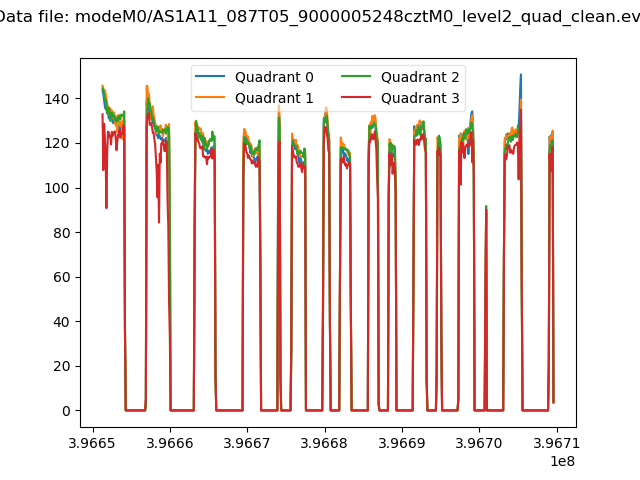
| Quadrant-wise count rates Data is divided into 100 sec bins |
 |
|
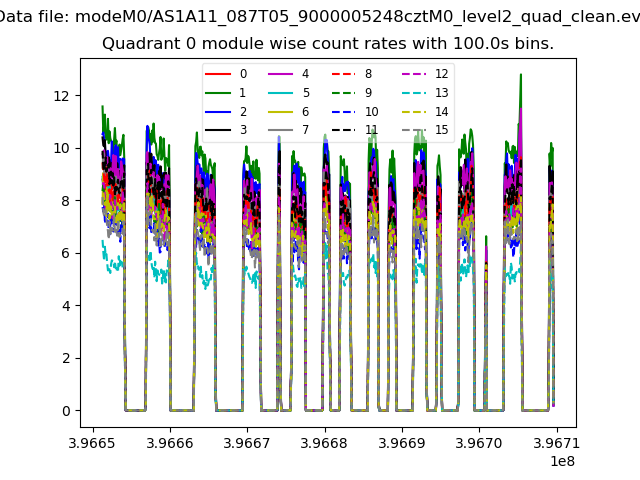
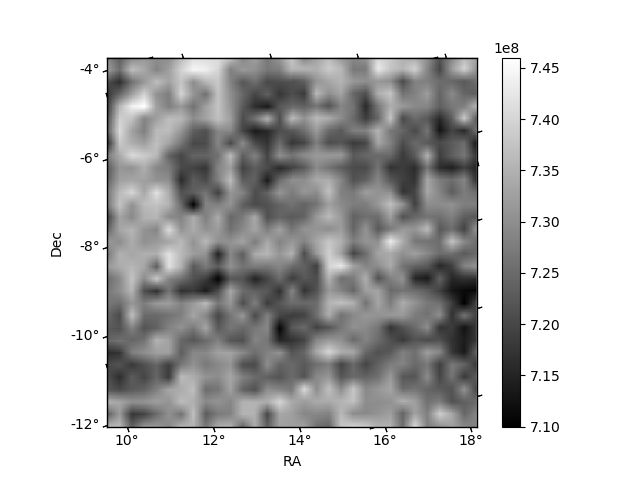
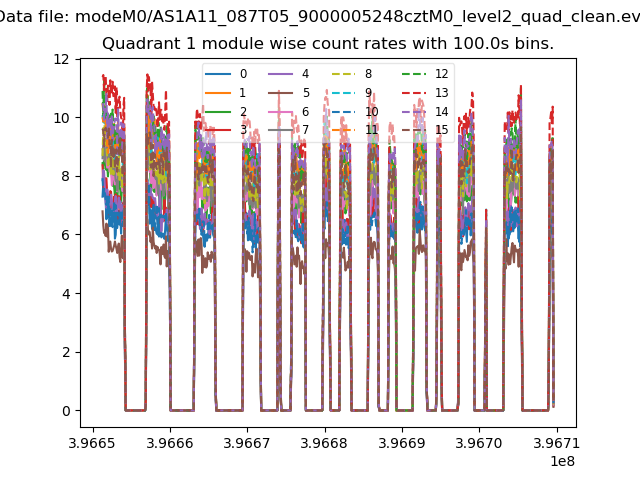
| Module-wise count rates for Quadrant A Data is divided into 100 sec bins |
 |
 |
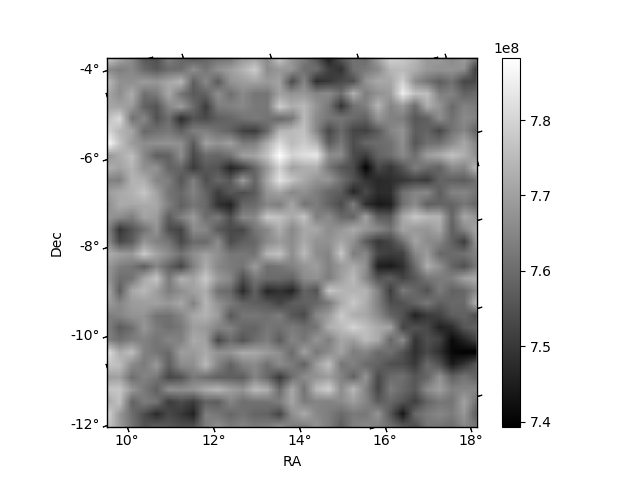
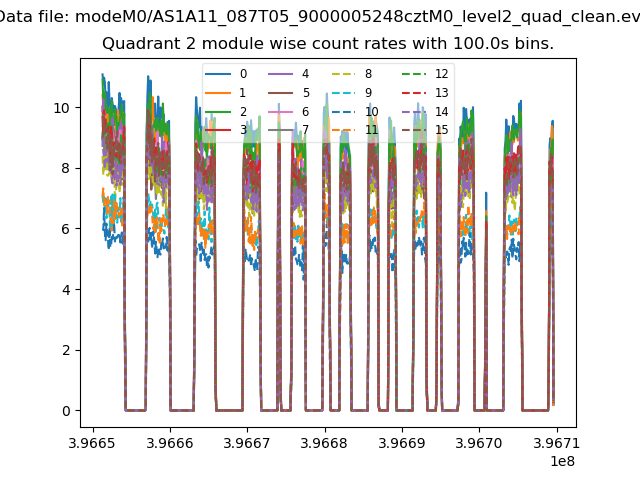
| Module-wise count rates for Quadrant B Data is divided into 100 sec bins |
 |
 |
| Module-wise count rates for Quadrant C Data is divided into 100 sec bins |
 |
 |
| Module-wise count rates for Quadrant D Data is divided into 100 sec bins |
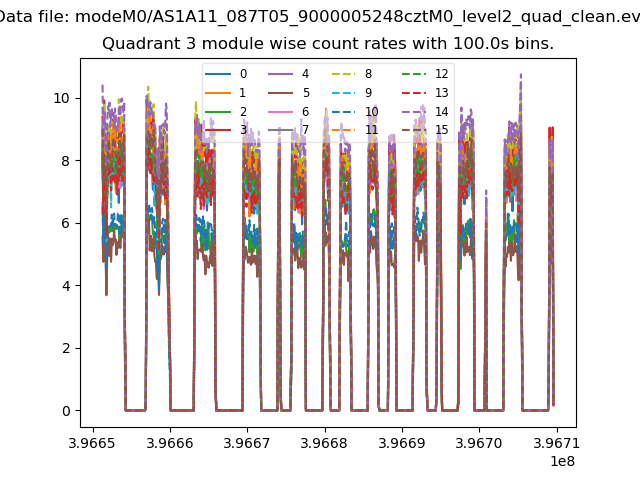 |
 |
| Parameter | Plot |
|---|---|
| CZT HV Monitor | 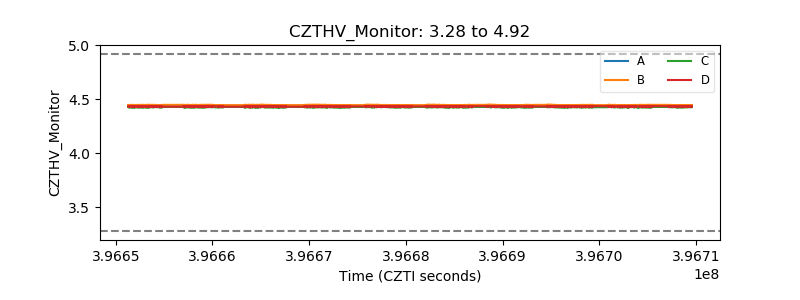 |
| D_VDD | 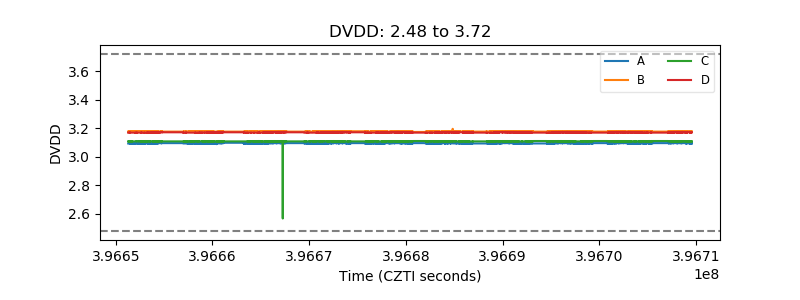 |
| Temperature 1 | 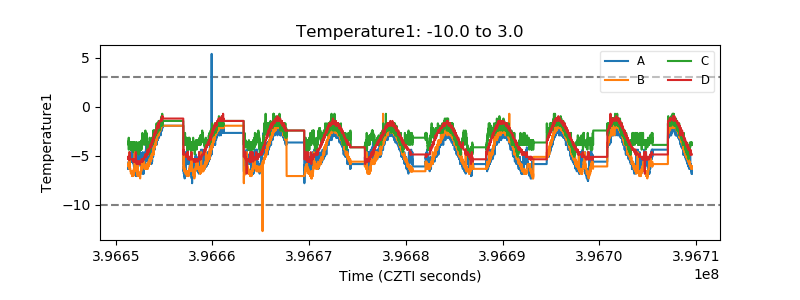 |
| Veto HV Monitor | 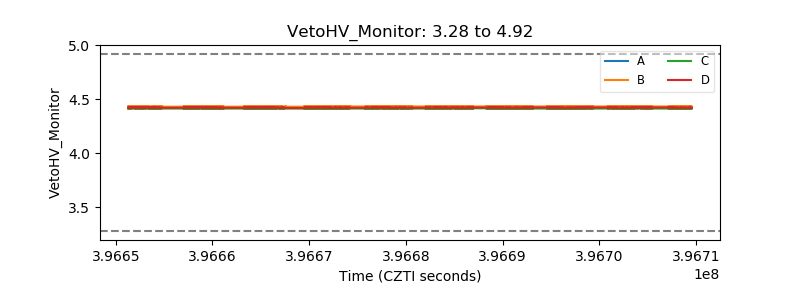 |
| Veto LLD | 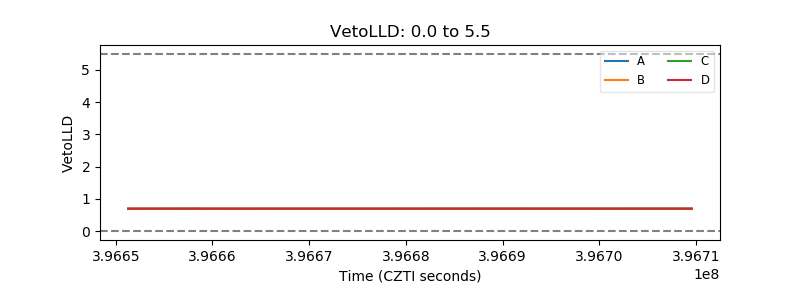 |
| Alpha Counter | 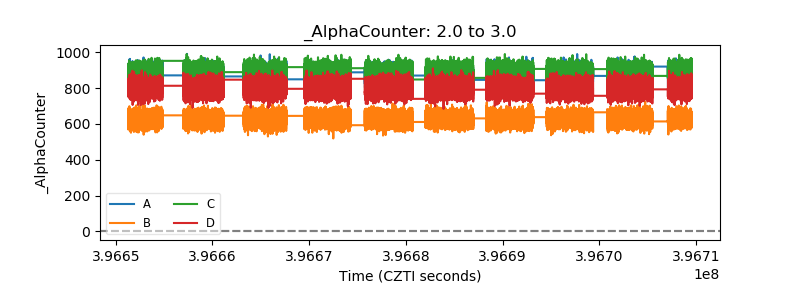 |
| _CPM_Rate | 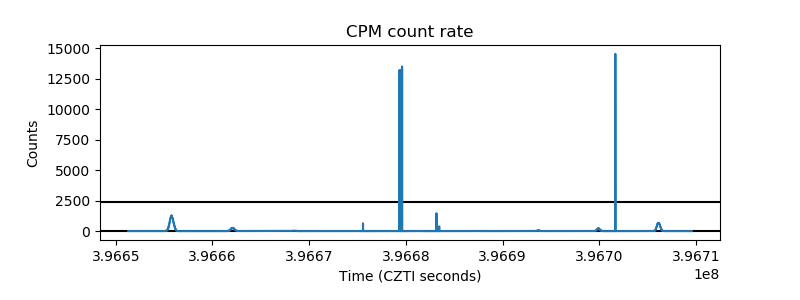 |
| CZT Counter | 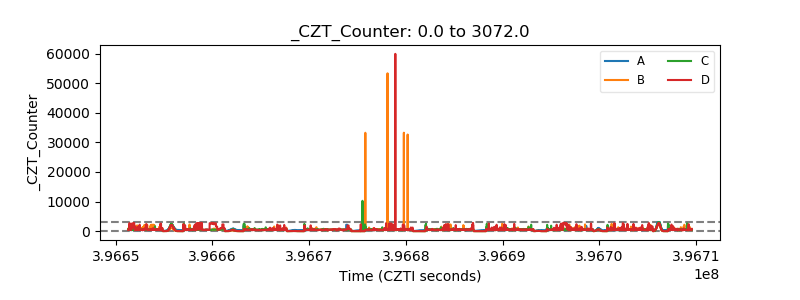 |
| +2.5 Volts monitor | 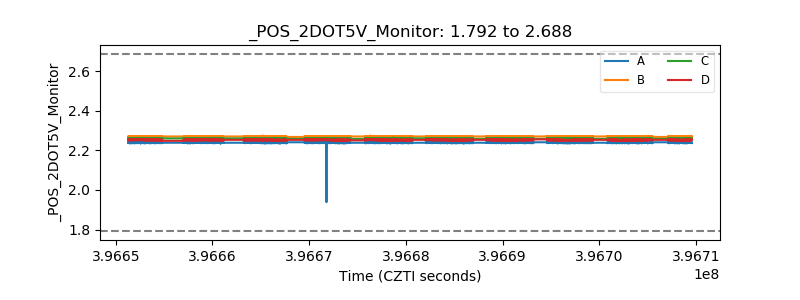 |
| +5 Volts monitor | 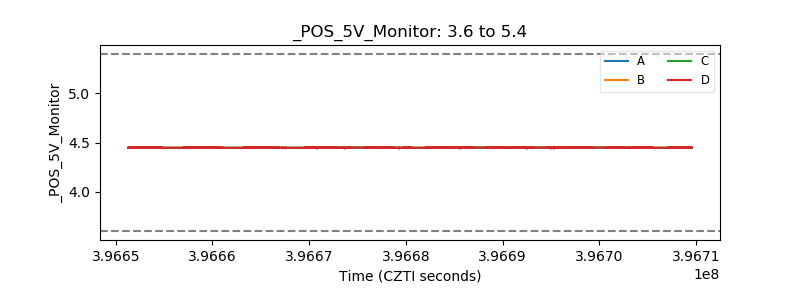 |
| _ROLL_ROT | 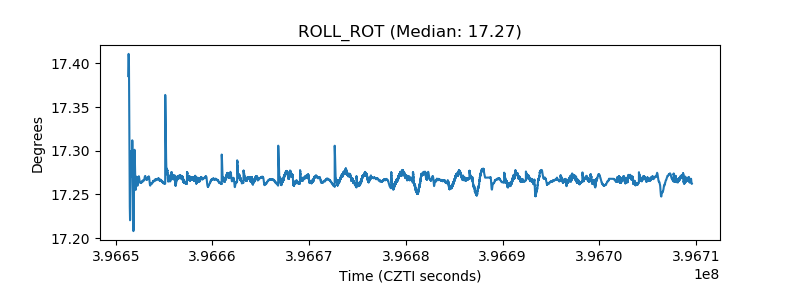 |
| _Roll_DEC | 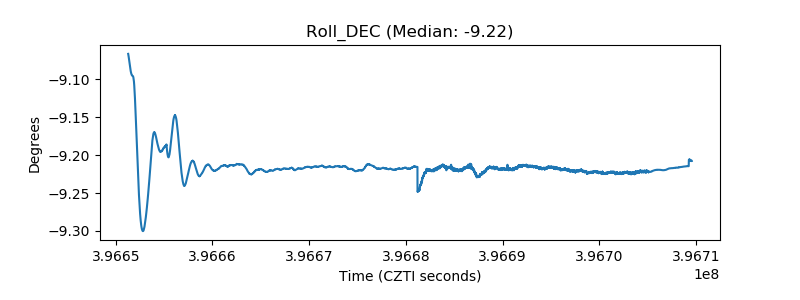 |
| _Roll_RA | 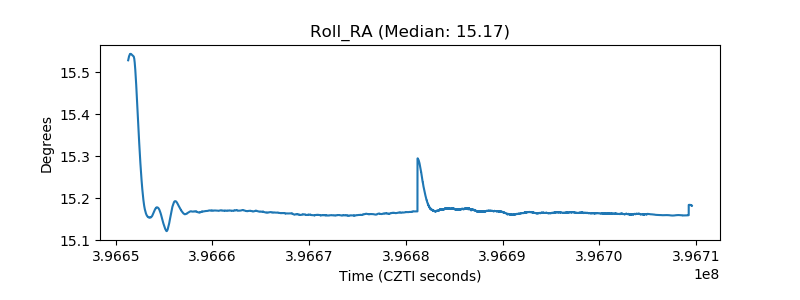 |
| Veto Counter | 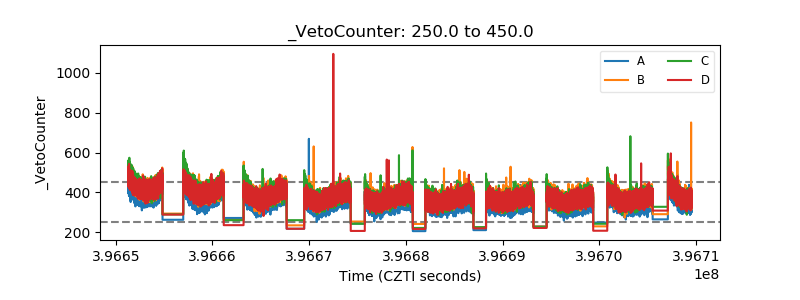 |