| Param | Original file | Final file |
|---|---|---|
| Filename | modeM0/AS1A11_087T05_9000005248_36928cztM0_level2.evt | modeM0/AS1A11_087T05_9000005248_36928cztM0_level2_quad_clean.evt |
| Size (bytes) | 348,719,040 | 71,876,160 |
| Size | 332.6 MB | 68.5 MB |
| Events in quadrant A | 2,019,498 | 473,318 |
| Events in quadrant B | 2,598,676 | 484,352 |
| Events in quadrant C | 2,279,347 | 480,166 |
| Events in quadrant D | 3,377,145 | 442,622 |
| Mode M0 | |||
|---|---|---|---|
| Quadrant | BADHDUFLAG | Total packets | Discarded packets |
| A | 0 | 8647 | 2 |
| B | 0 | 10413 | 1 |
| C | 0 | 9191 | 1 |
| D | 0 | 12840 | 1 |
| Mode SS | |||
|---|---|---|---|
| Quadrant | BADHDUFLAG | Total packets | Discarded packets |
| A | 0 | 88 | 0 |
| B | 0 | 88 | 0 |
| C | 0 | 88 | 0 |
| D | 0 | 88 | 0 |
| Mode M9 | |||
|---|---|---|---|
| Quadrant | BADHDUFLAG | Total packets | Discarded packets |
| A | 0 | 21 | 0 |
| B | 0 | 21 | 0 |
| C | 0 | 21 | 0 |
| D | 0 | 21 | 0 |
| Quadrant | Total seconds | Saturated seconds | Saturation percentage |
|---|---|---|---|
| A | 4197 | 2 | 0.047653% |
| B | 4197 | 62 | 1.477246% |
| C | 4197 | 48 | 1.143674% |
| D | 4197 | 318 | 7.576841% |
Noise dominated data is calculated using 1-second bins in cleaned event files. If a bin has >2000 counts, and if more than 50% of those come from <1% of pixels, then it is considered to be noise-dominated and hence unusable.
| Quadrant | # 1 sec bins | Bins with >0 counts | Bins with >2000 counts | High rate bins dominated by noise | Noise dominated (total time) | Noise dominated (detector-on time) | Marked lightcurve |
|---|---|---|---|---|---|---|---|
| A | 6350 | 4198 | 0 | 0 | 0.00% | 0.00% | 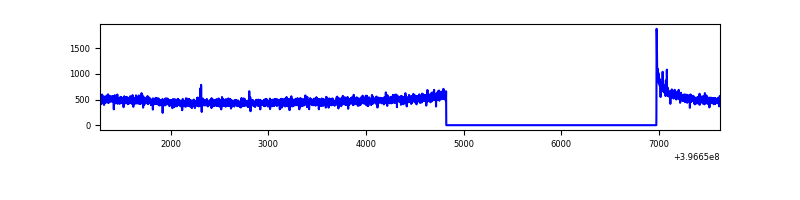 |
| B | 6350 | 4198 | 71 | 71 | 1.12% | 1.69% | 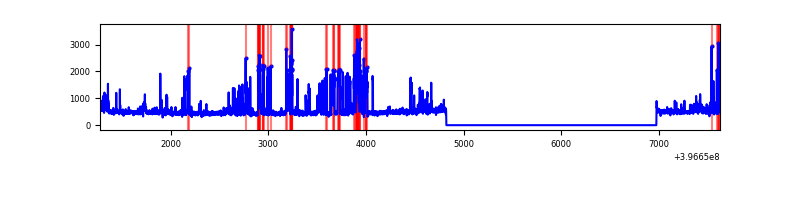 |
| C | 6350 | 4198 | 43 | 43 | 0.68% | 1.02% | 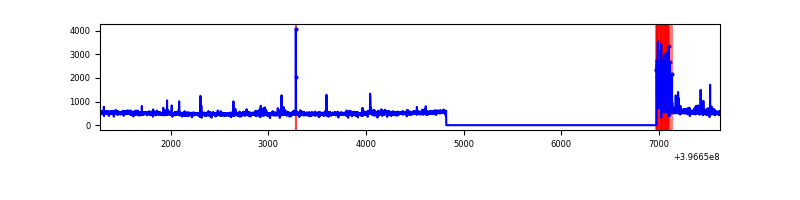 |
| D | 6350 | 4198 | 336 | 336 | 5.29% | 8.00% | 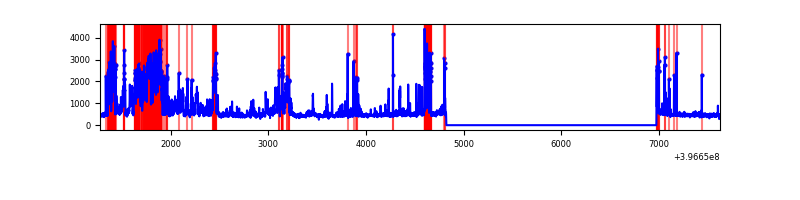 |
Top three noisy pixels from each quadrant. If the there are fewer than three noisy pixels in the level2.evt file, extra rows are filled as -1
| Pixel properties | Quadrant properties | ||||||
|---|---|---|---|---|---|---|---|
| Quadrant | DetID | PixID | Counts | Sigma | Mean | Median | Sigma |
| A | 10 | 83 | 141619 | 1433.83 | 484 | 475 | 98.4 |
| A | 9 | 143 | 5562 | 51.68 | 484 | 475 | 98.4 |
| A | 13 | 254 | 5361 | 49.63 | 484 | 475 | 98.4 |
| B | 0 | 182 | 383478 | 4066.67 | 486 | 474 | 94.2 |
| B | 5 | 172 | 208287 | 2206.52 | 486 | 474 | 94.2 |
| B | 0 | 213 | 43014 | 451.68 | 486 | 474 | 94.2 |
| C | 0 | 10 | 177325 | 1568.04 | 483 | 489 | 112.8 |
| C | 15 | 214 | 176219 | 1558.23 | 483 | 489 | 112.8 |
| C | 15 | 159 | 14169 | 121.3 | 483 | 489 | 112.8 |
| D | 12 | 17 | 1169270 | 10181.95 | 468 | 456 | 114.8 |
| D | 12 | 233 | 165779 | 1440.18 | 468 | 456 | 114.8 |
| D | 2 | 250 | 124521 | 1080.77 | 468 | 456 | 114.8 |
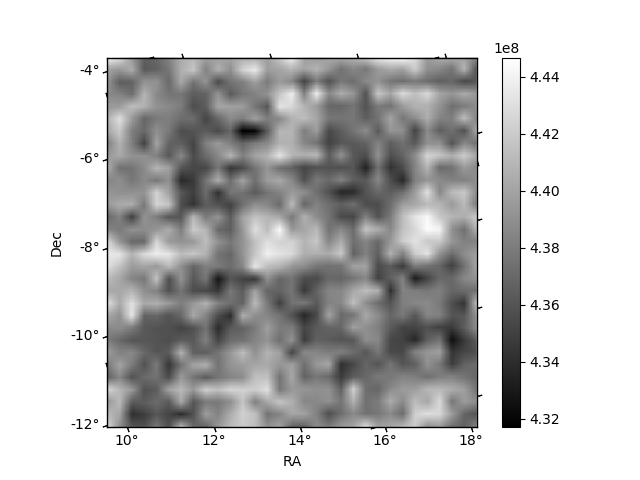
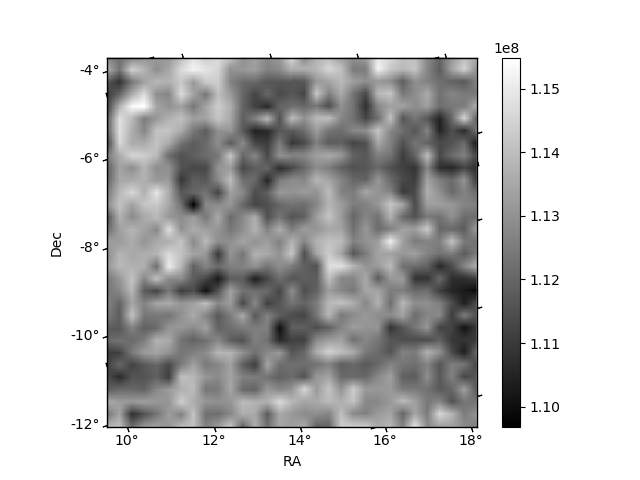
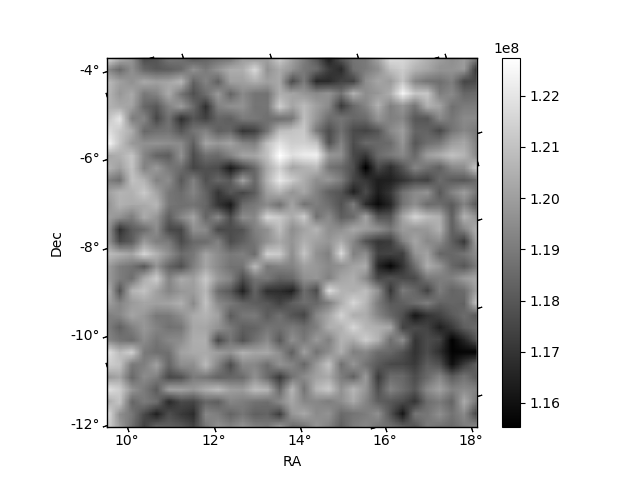
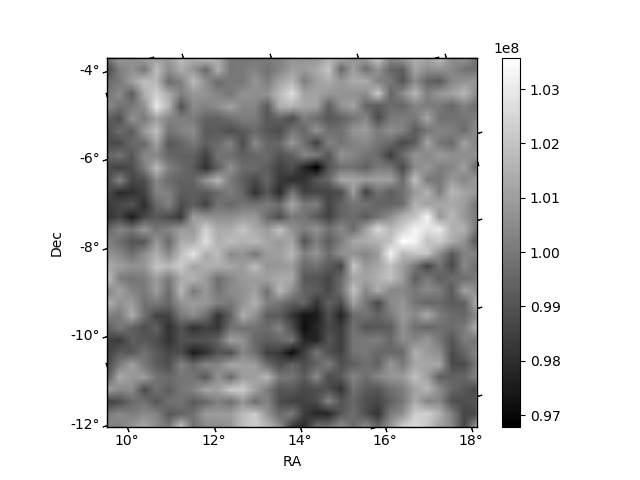
Histogram calculated using DETX and DETY for each event in the final _common_clean file
| Quadrant A | 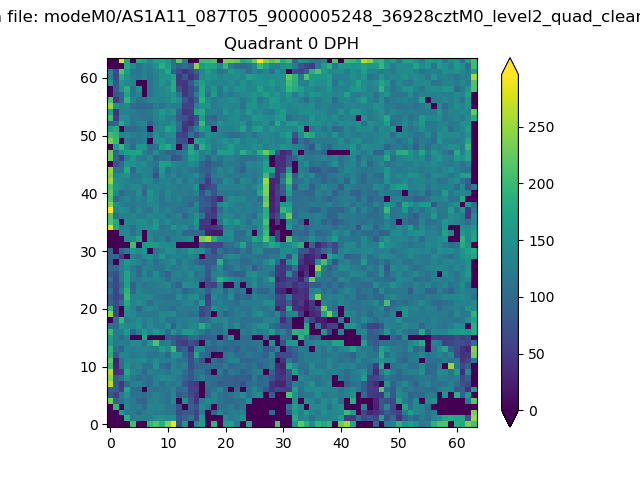 |
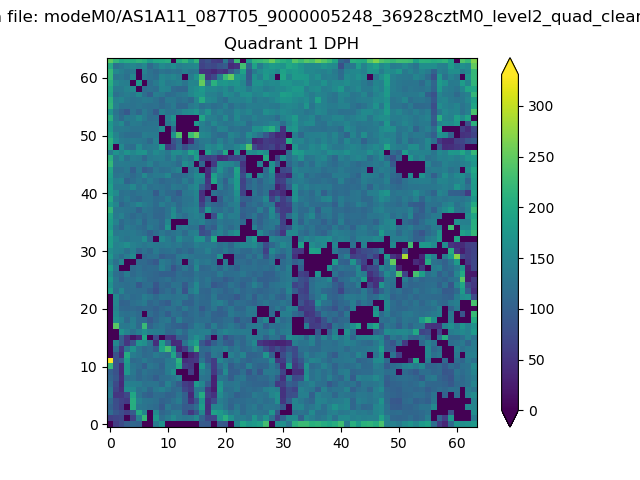 |
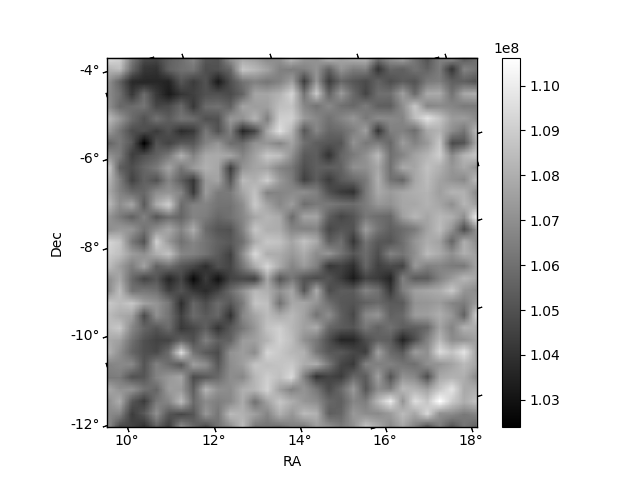
Quadrant B |
|---|---|---|---|
| Quadrant D | 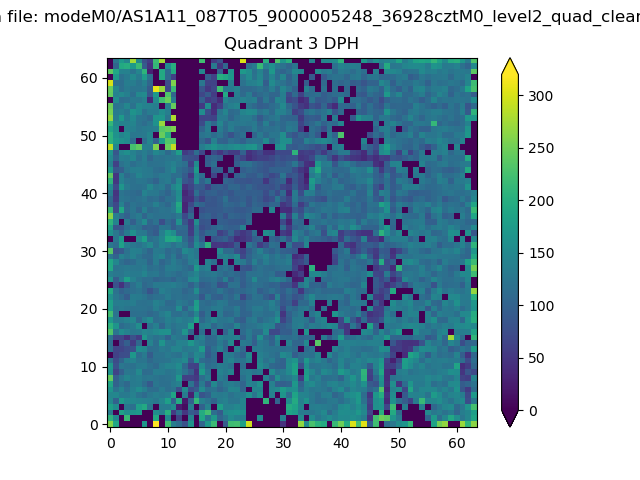 |
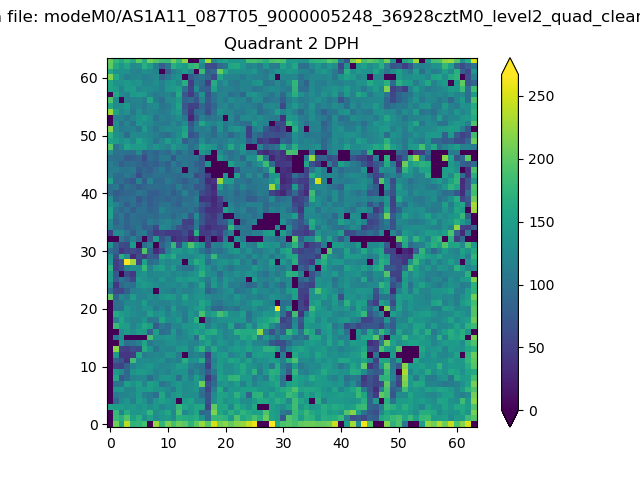 |
Quadrant C |
| Plot type | Count rate plots | Images |
|---|---|---|
| Comparison with Poisson distribution Blue bars denote a histogram of data divided into 1 sec bins. Red curve is a Poisson curve with rate = median count rate of data. |
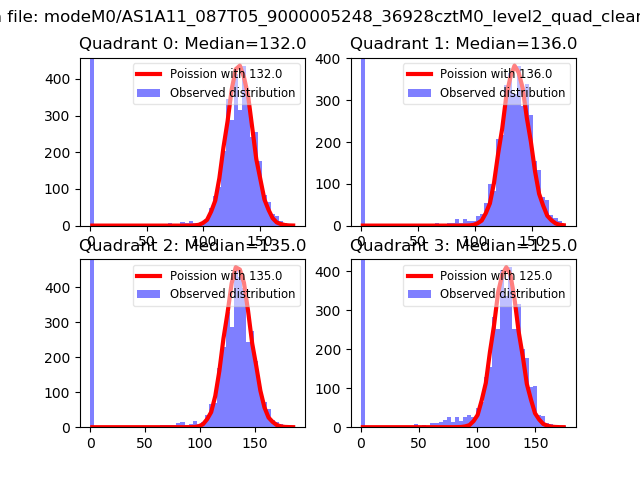 |
 |
| Quadrant-wise count rates Data is divided into 100 sec bins |
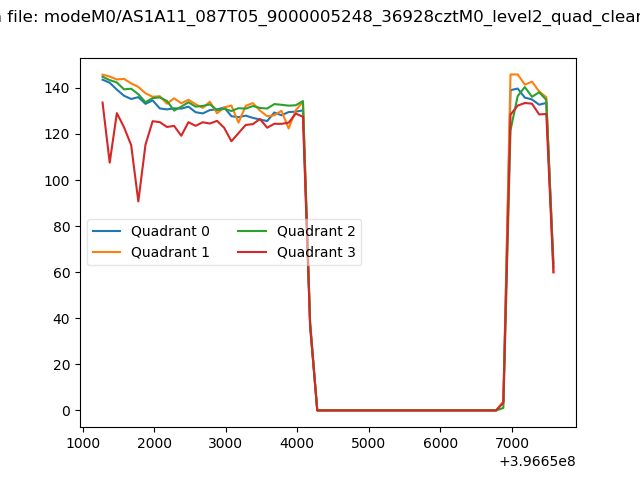 |
|
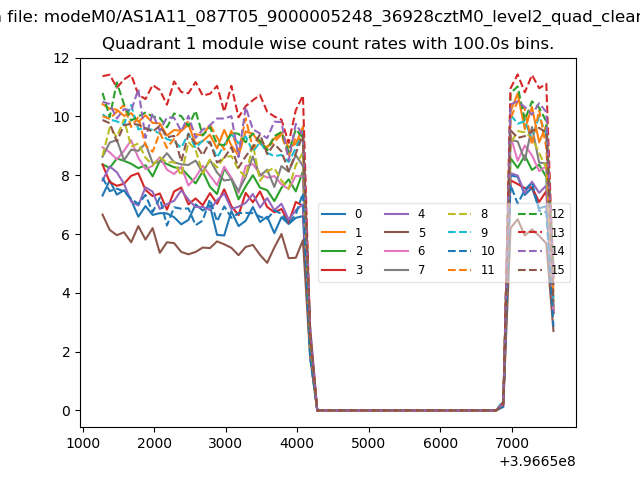
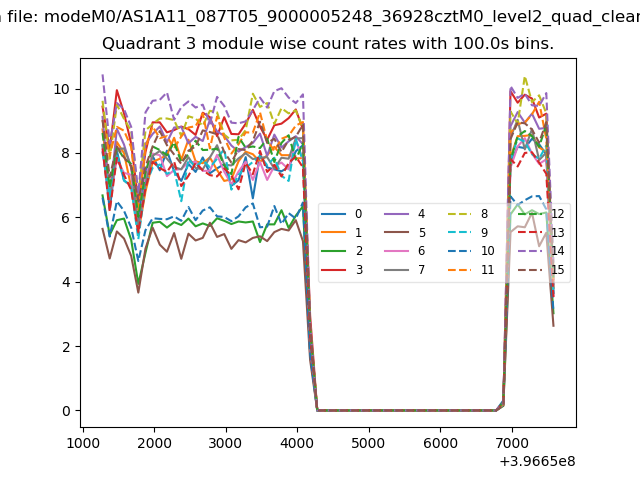
| Module-wise count rates for Quadrant A Data is divided into 100 sec bins |
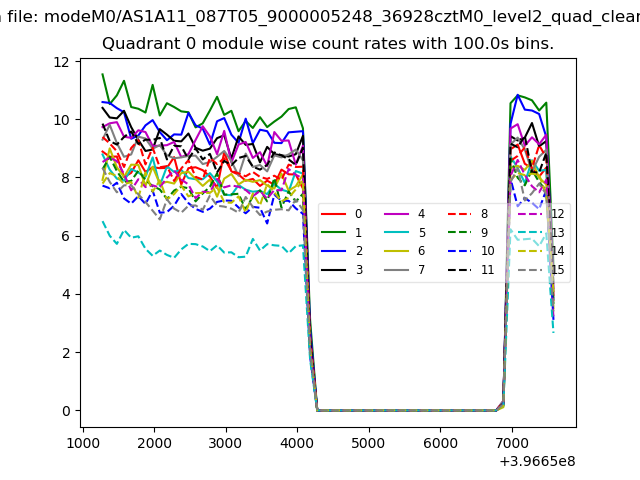 |
 |
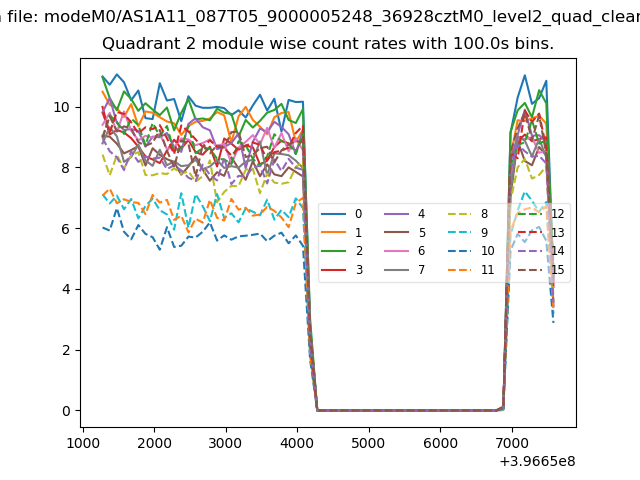
| Module-wise count rates for Quadrant B Data is divided into 100 sec bins |
 |
 |
| Module-wise count rates for Quadrant C Data is divided into 100 sec bins |
 |
 |
| Module-wise count rates for Quadrant D Data is divided into 100 sec bins |
 |
 |
| Parameter | Plot |
|---|---|
| CZT HV Monitor | 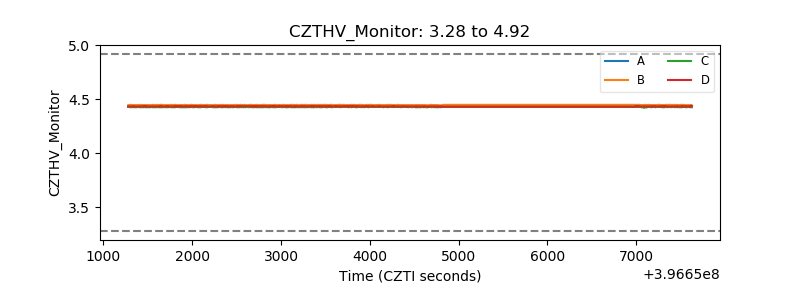 |
| D_VDD | 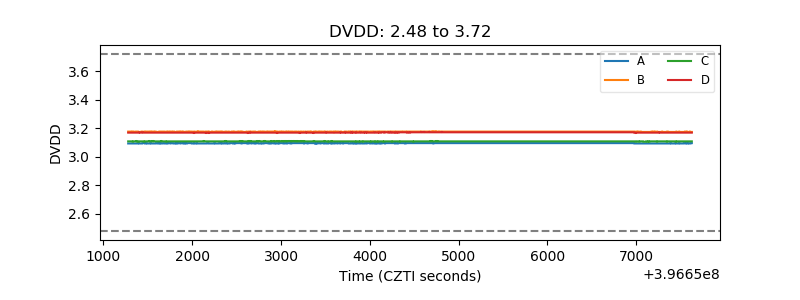 |
| Temperature 1 | 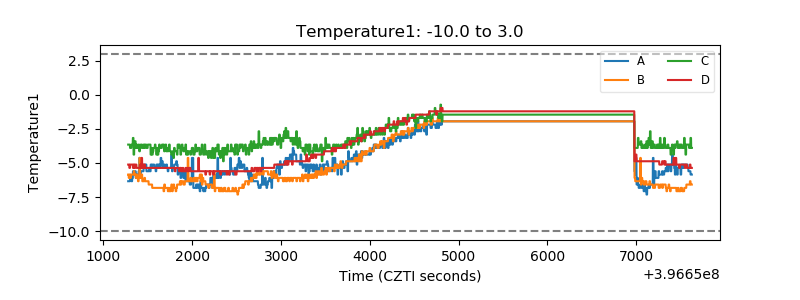 |
| Veto HV Monitor | 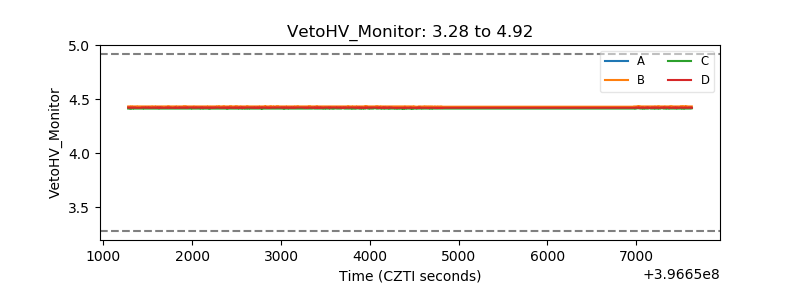 |
| Veto LLD | 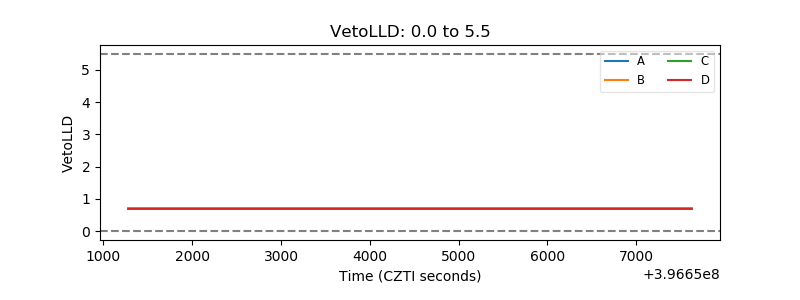 |
| Alpha Counter | 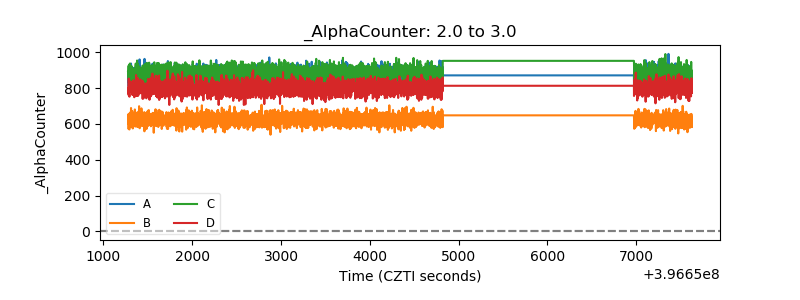 |
| _CPM_Rate | 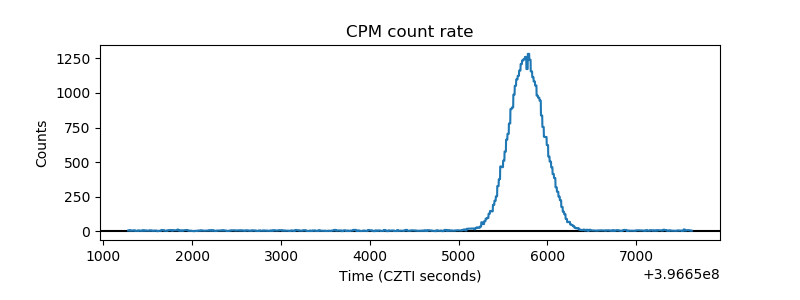 |
| CZT Counter | 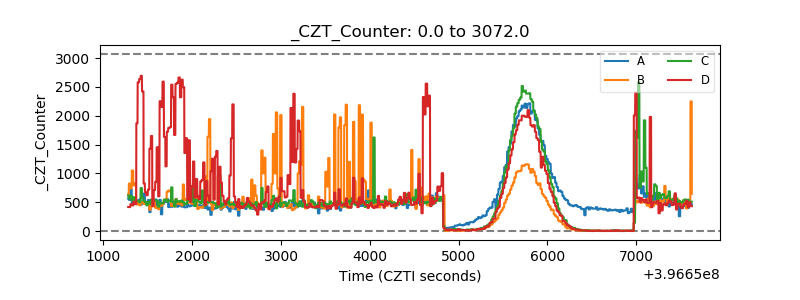 |
| +2.5 Volts monitor |  |
| +5 Volts monitor |  |
| _ROLL_ROT | 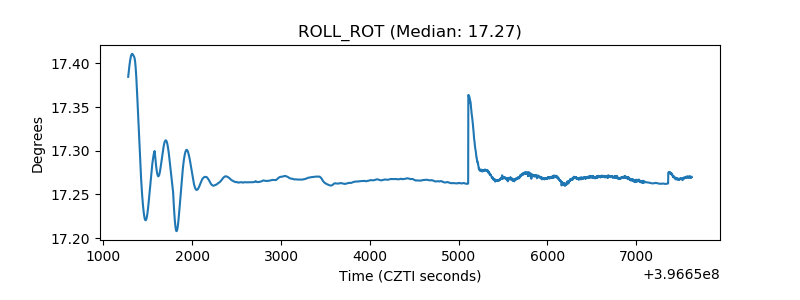 |
| _Roll_DEC |  |
| _Roll_RA | 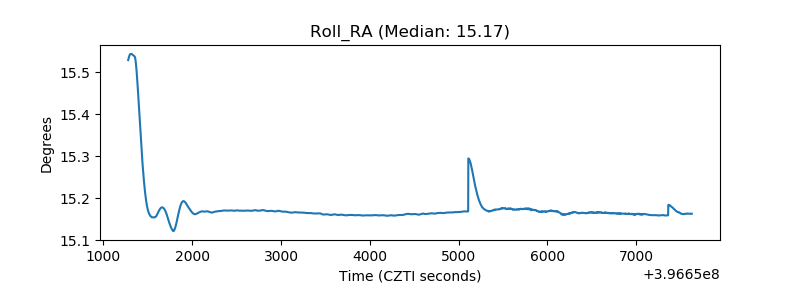 |
| Veto Counter | 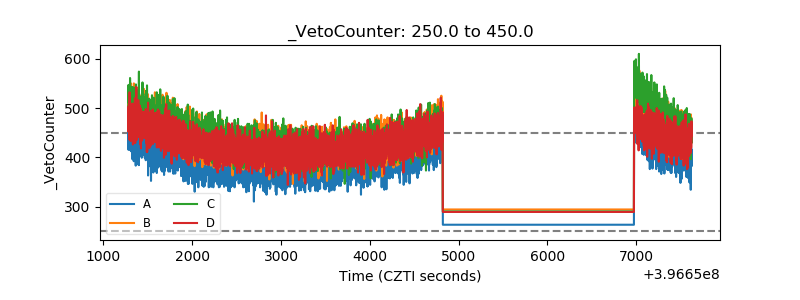 |