| Param | Original file | Final file |
|---|---|---|
| Filename | modeM0/AS1A11_087T05_9000005248_36930cztM0_level2.evt | modeM0/AS1A11_087T05_9000005248_36930cztM0_level2_quad_clean.evt |
| Size (bytes) | 370,085,760 | 67,616,640 |
| Size | 352.9 MB | 64.5 MB |
| Events in quadrant A | 2,540,823 | 419,810 |
| Events in quadrant B | 2,710,014 | 429,641 |
| Events in quadrant C | 2,898,421 | 422,033 |
| Events in quadrant D | 2,700,523 | 407,345 |
| Mode M0 | |||
|---|---|---|---|
| Quadrant | BADHDUFLAG | Total packets | Discarded packets |
| A | 0 | 11001 | 3 |
| B | 0 | 11635 | 2 |
| C | 0 | 11822 | 2 |
| D | 0 | 11877 | 2 |
| Mode SS | |||
|---|---|---|---|
| Quadrant | BADHDUFLAG | Total packets | Discarded packets |
| A | 0 | 108 | 0 |
| B | 0 | 108 | 0 |
| C | 0 | 108 | 0 |
| D | 0 | 108 | 0 |
| Mode M9 | |||
|---|---|---|---|
| Quadrant | BADHDUFLAG | Total packets | Discarded packets |
| A | 0 | 26 | 0 |
| B | 0 | 26 | 0 |
| C | 0 | 26 | 0 |
| D | 0 | 27 | 0 |
| Quadrant | Total seconds | Saturated seconds | Saturation percentage |
|---|---|---|---|
| A | 5260 | 16 | 0.304183% |
| B | 5260 | 34 | 0.646388% |
| C | 5260 | 94 | 1.787072% |
| D | 5260 | 70 | 1.330798% |
Noise dominated data is calculated using 1-second bins in cleaned event files. If a bin has >2000 counts, and if more than 50% of those come from <1% of pixels, then it is considered to be noise-dominated and hence unusable.
| Quadrant | # 1 sec bins | Bins with >0 counts | Bins with >2000 counts | High rate bins dominated by noise | Noise dominated (total time) | Noise dominated (detector-on time) | Marked lightcurve |
|---|---|---|---|---|---|---|---|
| A | 7083 | 5261 | 4 | 4 | 0.06% | 0.08% | 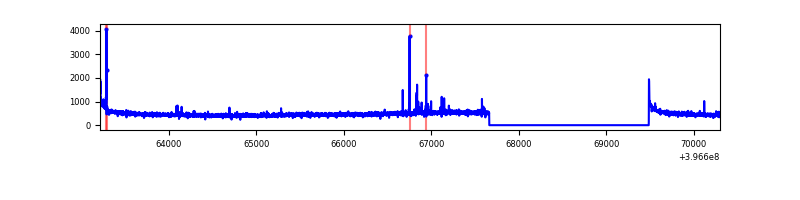 |
| B | 7083 | 5261 | 15 | 15 | 0.21% | 0.29% | 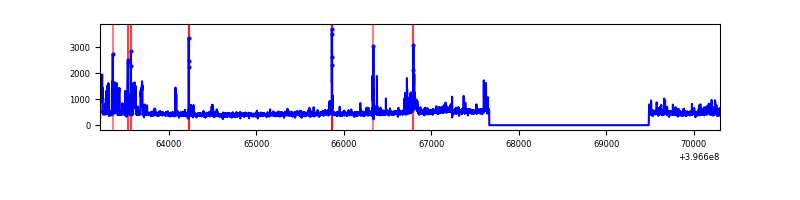 |
| C | 7083 | 5261 | 77 | 77 | 1.09% | 1.46% | 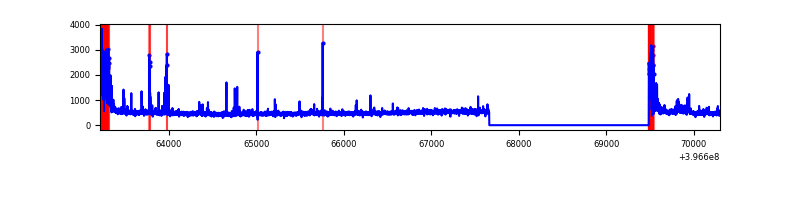 |
| D | 7083 | 5261 | 56 | 56 | 0.79% | 1.06% | 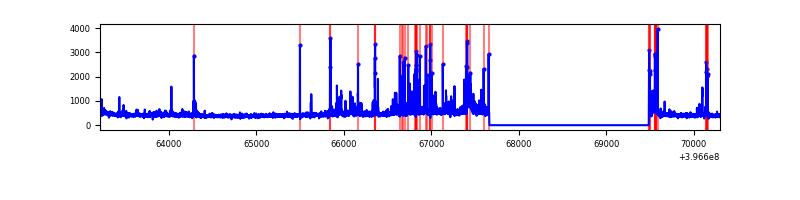 |
Top three noisy pixels from each quadrant. If the there are fewer than three noisy pixels in the level2.evt file, extra rows are filled as -1
| Pixel properties | Quadrant properties | ||||||
|---|---|---|---|---|---|---|---|
| Quadrant | DetID | PixID | Counts | Sigma | Mean | Median | Sigma |
| A | 10 | 83 | 224454 | 1879.8 | 586 | 573 | 119.1 |
| A | 15 | 174 | 27478 | 225.91 | 586 | 573 | 119.1 |
| A | 9 | 143 | 14128 | 113.81 | 586 | 573 | 119.1 |
| B | 0 | 182 | 143506 | 1264.56 | 585 | 569 | 113.0 |
| B | 5 | 172 | 60761 | 532.52 | 585 | 569 | 113.0 |
| B | 5 | 255 | 47087 | 411.55 | 585 | 569 | 113.0 |
| C | 0 | 10 | 313272 | 2306.13 | 577 | 582 | 135.6 |
| C | 15 | 214 | 228342 | 1679.76 | 577 | 582 | 135.6 |
| C | 0 | 207 | 85974 | 629.78 | 577 | 582 | 135.6 |
| D | 12 | 233 | 137184 | 948.96 | 578 | 562 | 144.0 |
| D | 2 | 250 | 92897 | 641.35 | 578 | 562 | 144.0 |
| D | 10 | 118 | 64666 | 445.26 | 578 | 562 | 144.0 |
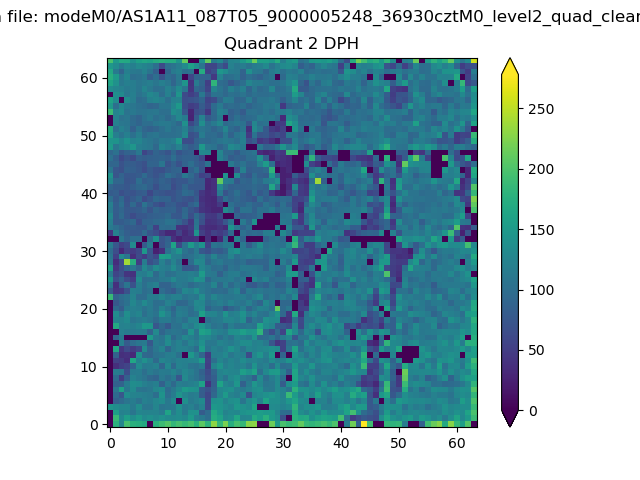
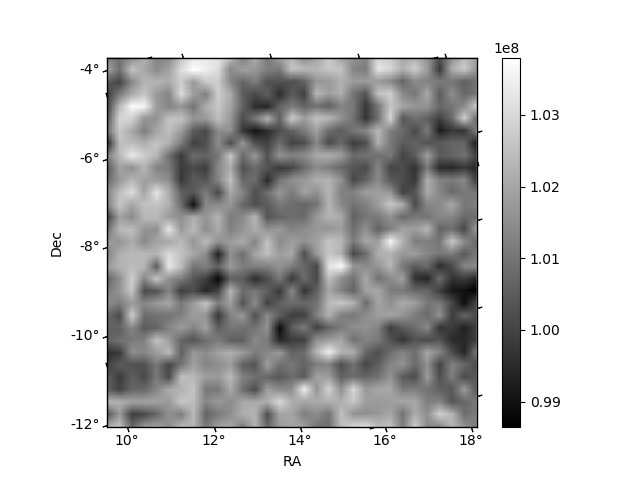
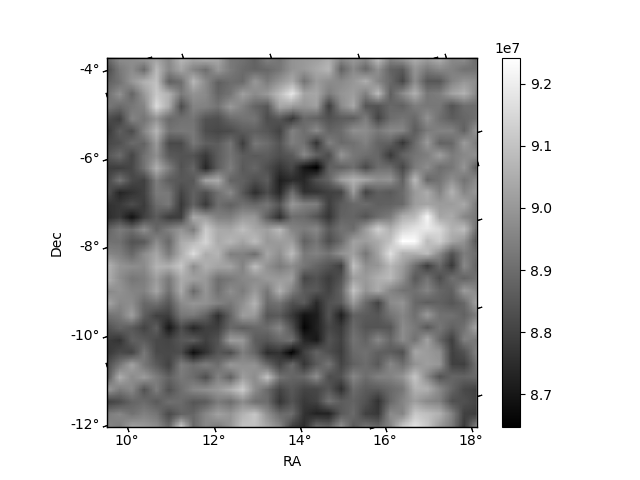
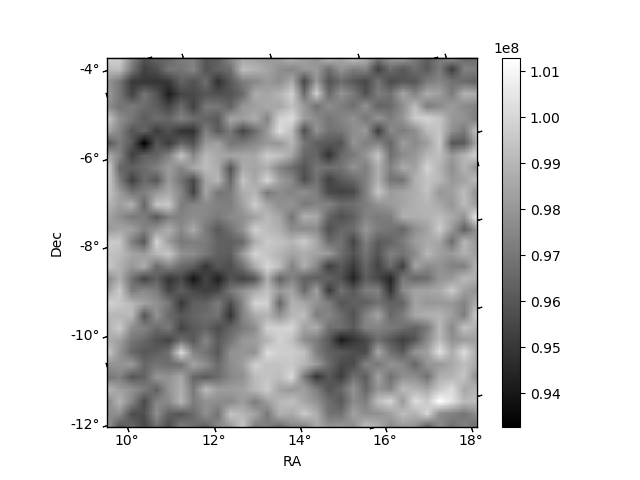
Histogram calculated using DETX and DETY for each event in the final _common_clean file
| Quadrant A | 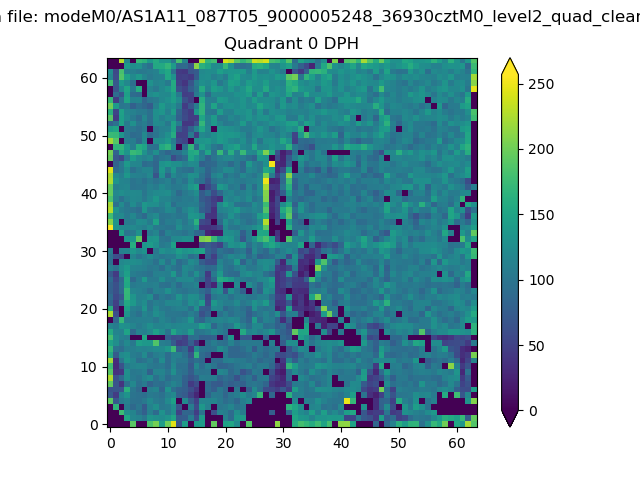 |
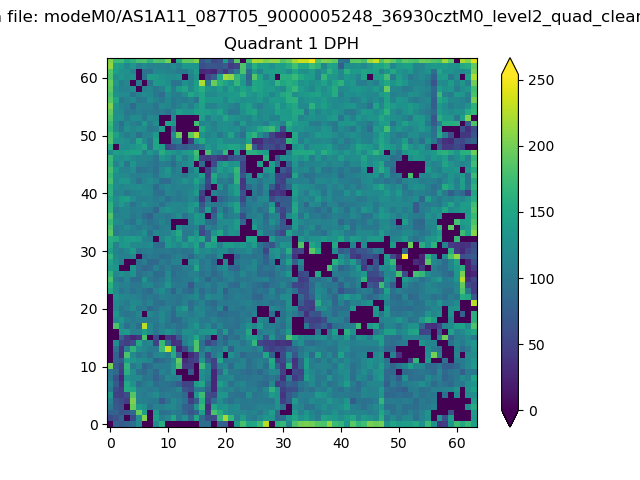 |
Quadrant B |
|---|---|---|---|
| Quadrant D | 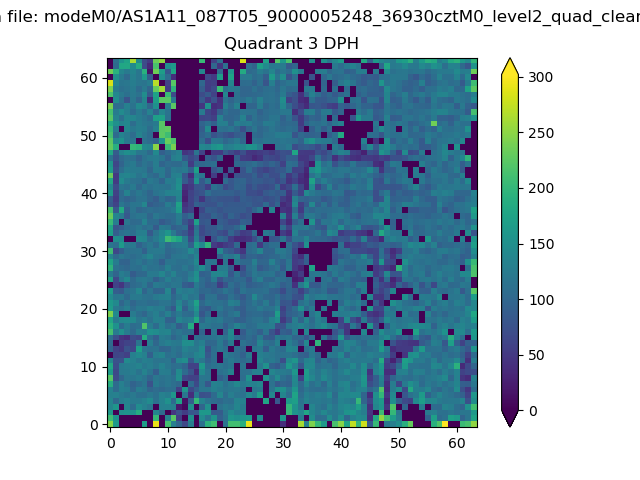 |
 |
Quadrant C |
| Plot type | Count rate plots | Images |
|---|---|---|
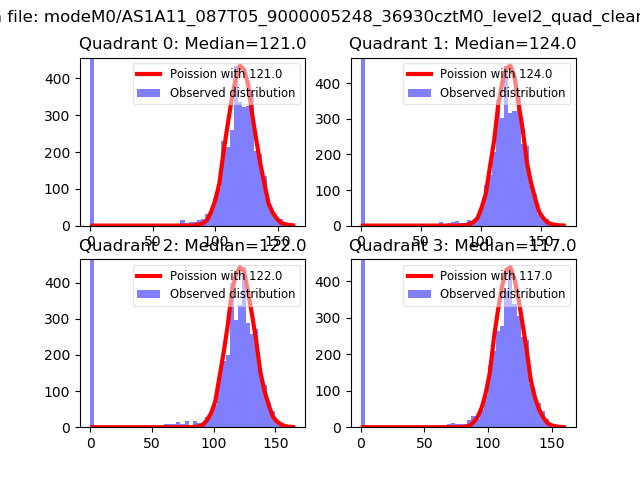
| Comparison with Poisson distribution Blue bars denote a histogram of data divided into 1 sec bins. Red curve is a Poisson curve with rate = median count rate of data. |
 |
 |
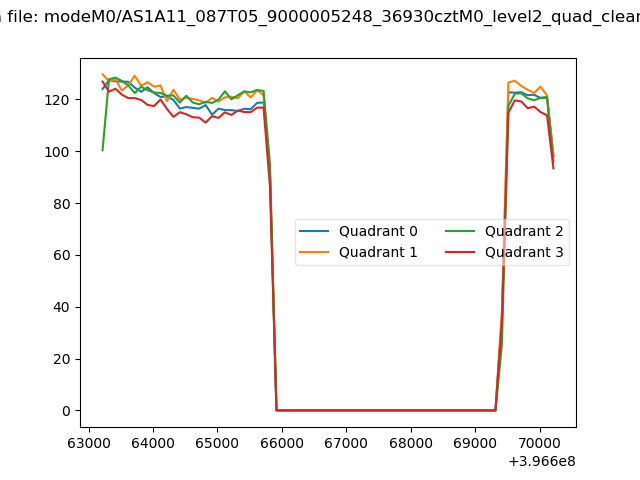
| Quadrant-wise count rates Data is divided into 100 sec bins |
 |
|
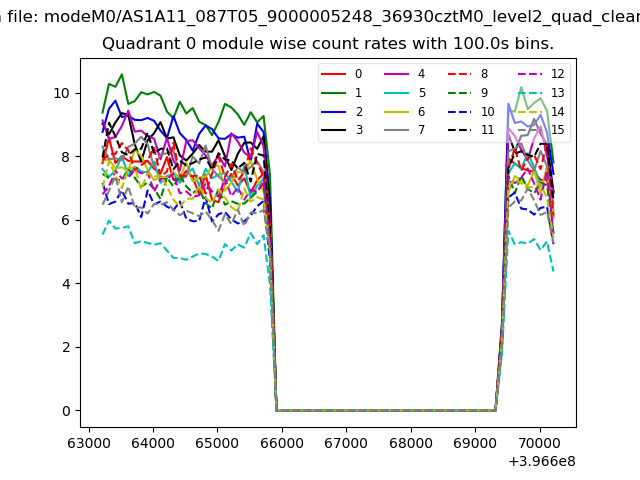
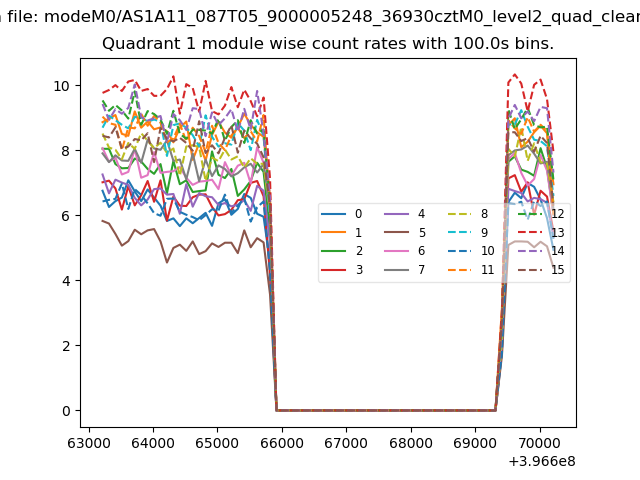
| Module-wise count rates for Quadrant A Data is divided into 100 sec bins |
 |
 |
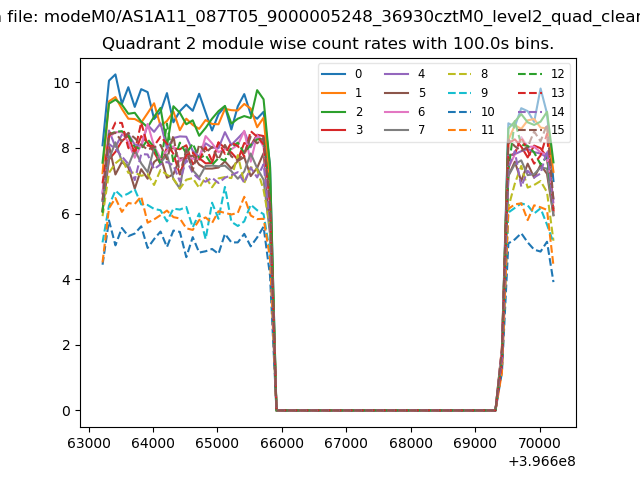
| Module-wise count rates for Quadrant B Data is divided into 100 sec bins |
 |
 |
| Module-wise count rates for Quadrant C Data is divided into 100 sec bins |
 |
 |
| Module-wise count rates for Quadrant D Data is divided into 100 sec bins |
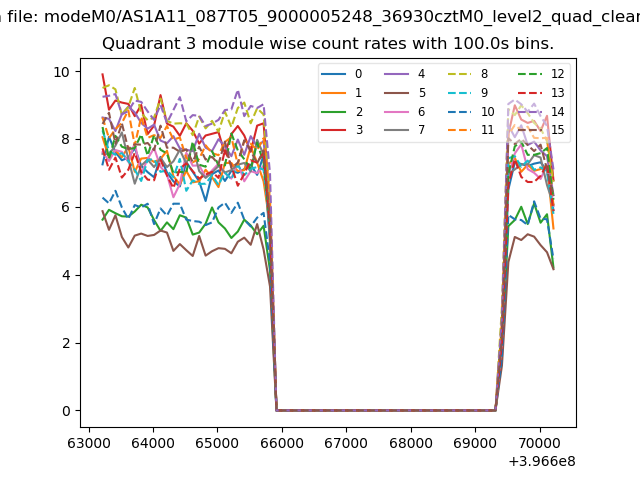 |
 |
| Parameter | Plot |
|---|---|
| CZT HV Monitor | 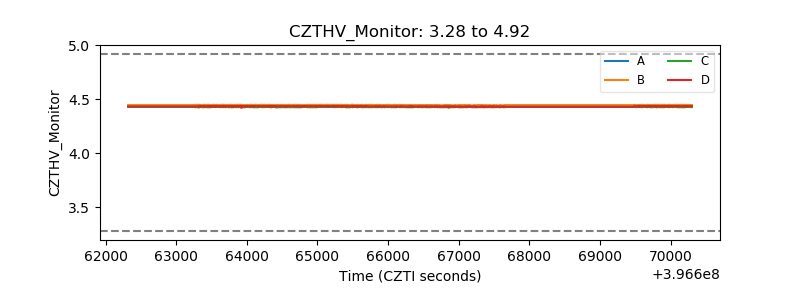 |
| D_VDD |  |
| Temperature 1 |  |
| Veto HV Monitor | 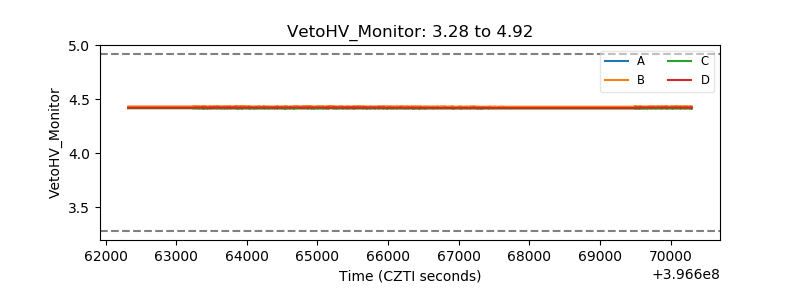 |
| Veto LLD | 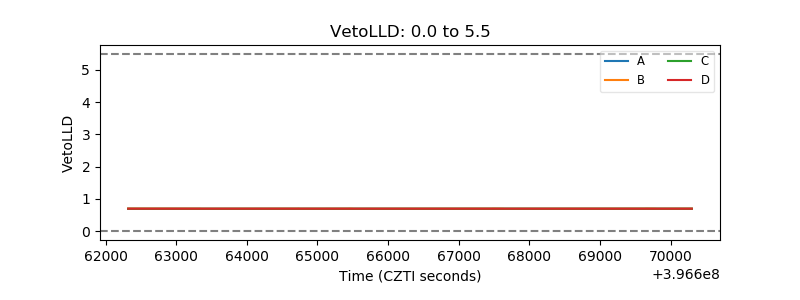 |
| Alpha Counter | 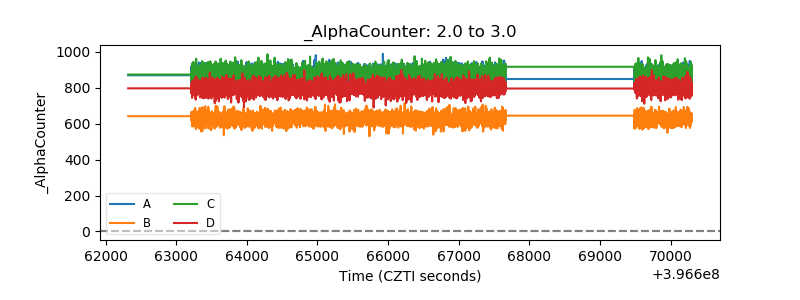 |
| _CPM_Rate | 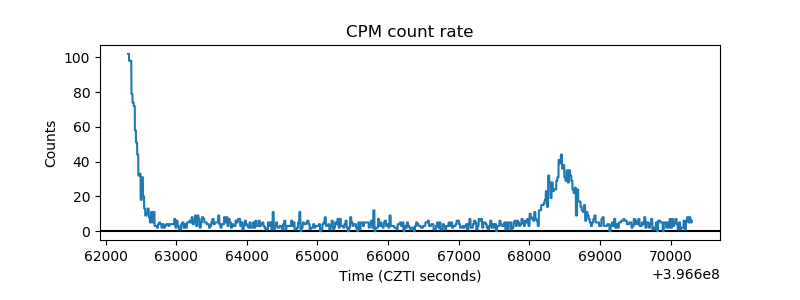 |
| CZT Counter | 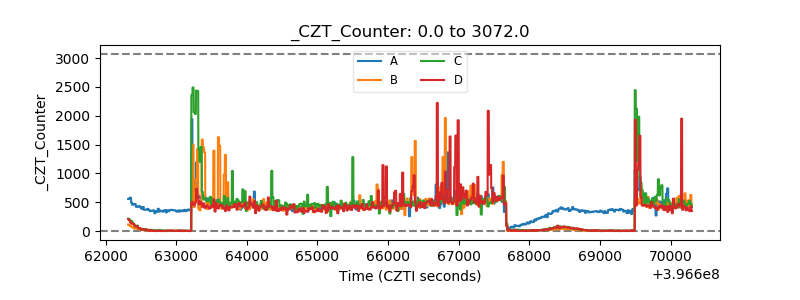 |
| +2.5 Volts monitor |  |
| +5 Volts monitor |  |
| _ROLL_ROT | 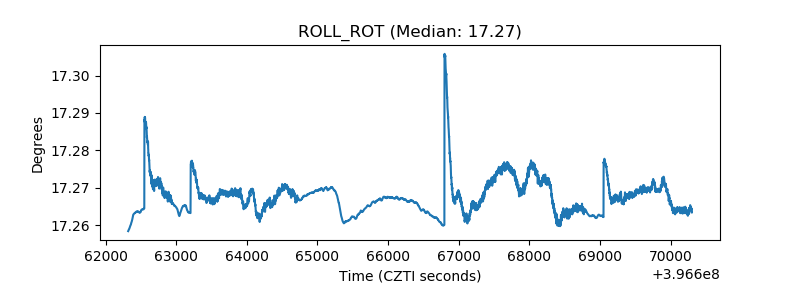 |
| _Roll_DEC | 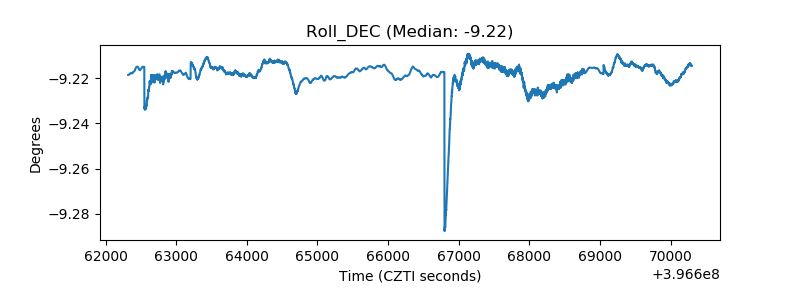 |
| _Roll_RA | 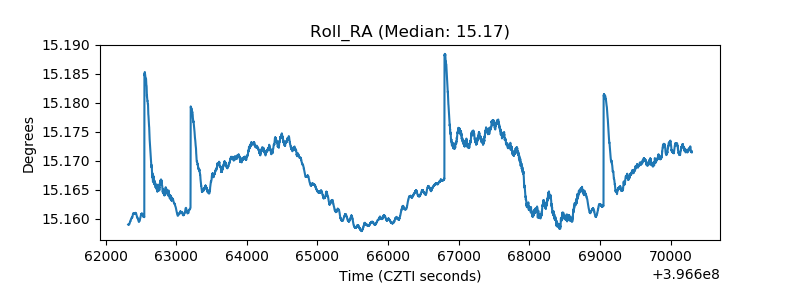 |
| Veto Counter | 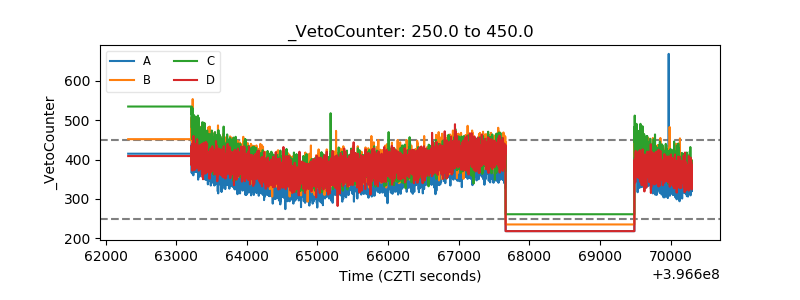 |