| Param | Original file | Final file |
|---|---|---|
| Filename | modeM0/AS1A11_087T05_9000005248_36931cztM0_level2.evt | modeM0/AS1A11_087T05_9000005248_36931cztM0_level2_quad_clean.evt |
| Size (bytes) | 427,089,600 | 66,767,040 |
| Size | 407.3 MB | 63.7 MB |
| Events in quadrant A | 2,890,247 | 402,426 |
| Events in quadrant B | 3,015,092 | 411,062 |
| Events in quadrant C | 3,155,830 | 402,725 |
| Events in quadrant D | 3,465,027 | 385,774 |
| Mode M0 | |||
|---|---|---|---|
| Quadrant | BADHDUFLAG | Total packets | Discarded packets |
| A | 0 | 12424 | 3 |
| B | 0 | 12949 | 2 |
| C | 0 | 12905 | 2 |
| D | 0 | 14632 | 2 |
| Mode SS | |||
|---|---|---|---|
| Quadrant | BADHDUFLAG | Total packets | Discarded packets |
| A | 0 | 124 | 0 |
| B | 0 | 124 | 0 |
| C | 0 | 124 | 0 |
| D | 0 | 124 | 0 |
| Mode M9 | |||
|---|---|---|---|
| Quadrant | BADHDUFLAG | Total packets | Discarded packets |
| A | 0 | 33 | 0 |
| B | 0 | 33 | 0 |
| C | 0 | 33 | 0 |
| D | 0 | 33 | 0 |
| Quadrant | Total seconds | Saturated seconds | Saturation percentage |
|---|---|---|---|
| A | 6005 | 15 | 0.249792% |
| B | 6005 | 25 | 0.416320% |
| C | 6005 | 51 | 0.849292% |
| D | 6005 | 192 | 3.197336% |
Noise dominated data is calculated using 1-second bins in cleaned event files. If a bin has >2000 counts, and if more than 50% of those come from <1% of pixels, then it is considered to be noise-dominated and hence unusable.
| Quadrant | # 1 sec bins | Bins with >0 counts | Bins with >2000 counts | High rate bins dominated by noise | Noise dominated (total time) | Noise dominated (detector-on time) | Marked lightcurve |
|---|---|---|---|---|---|---|---|
| A | 9291 | 6007 | 1 | 1 | 0.01% | 0.02% | 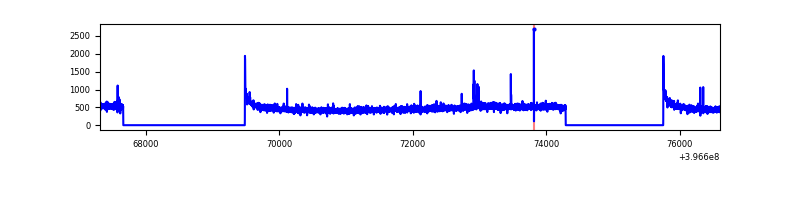 |
| B | 9291 | 6007 | 11 | 11 | 0.12% | 0.18% | 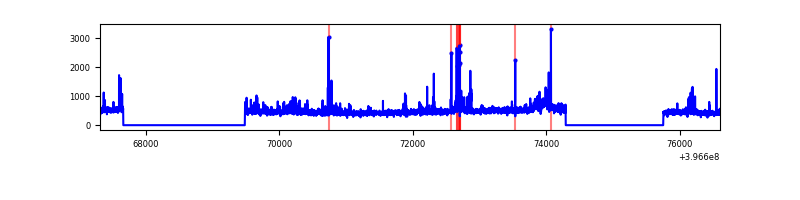 |
| C | 9291 | 6007 | 40 | 40 | 0.43% | 0.67% | 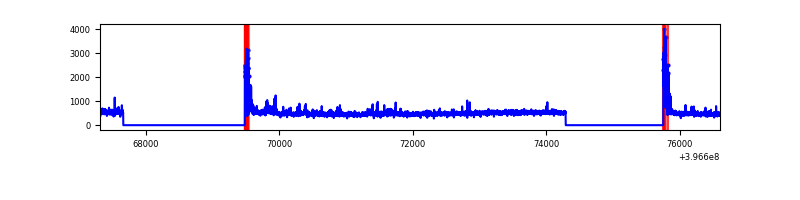 |
| D | 9291 | 6007 | 166 | 166 | 1.79% | 2.76% | 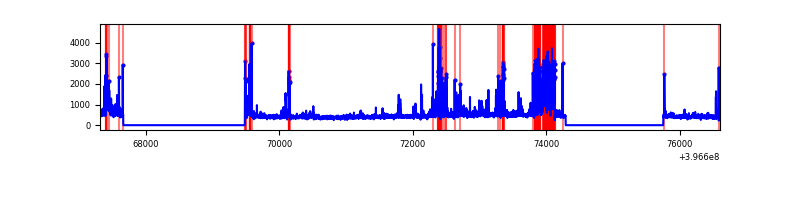 |
Top three noisy pixels from each quadrant. If the there are fewer than three noisy pixels in the level2.evt file, extra rows are filled as -1
| Pixel properties | Quadrant properties | ||||||
|---|---|---|---|---|---|---|---|
| Quadrant | DetID | PixID | Counts | Sigma | Mean | Median | Sigma |
| A | 10 | 83 | 239528 | 1717.32 | 679 | 665 | 139.1 |
| A | 15 | 174 | 20295 | 141.13 | 679 | 665 | 139.1 |
| A | 13 | 254 | 8182 | 54.04 | 679 | 665 | 139.1 |
| B | 0 | 229 | 102985 | 783.4 | 674 | 658 | 130.6 |
| B | 0 | 213 | 84482 | 641.74 | 674 | 658 | 130.6 |
| B | 5 | 255 | 51729 | 390.99 | 674 | 658 | 130.6 |
| C | 0 | 10 | 264675 | 1691.67 | 662 | 666 | 156.1 |
| C | 15 | 214 | 257650 | 1646.66 | 662 | 666 | 156.1 |
| C | 0 | 207 | 46330 | 292.6 | 662 | 666 | 156.1 |
| D | 12 | 233 | 511869 | 3165.63 | 658 | 641 | 161.5 |
| D | 13 | 171 | 172186 | 1062.24 | 658 | 641 | 161.5 |
| D | 2 | 153 | 50617 | 309.46 | 658 | 641 | 161.5 |
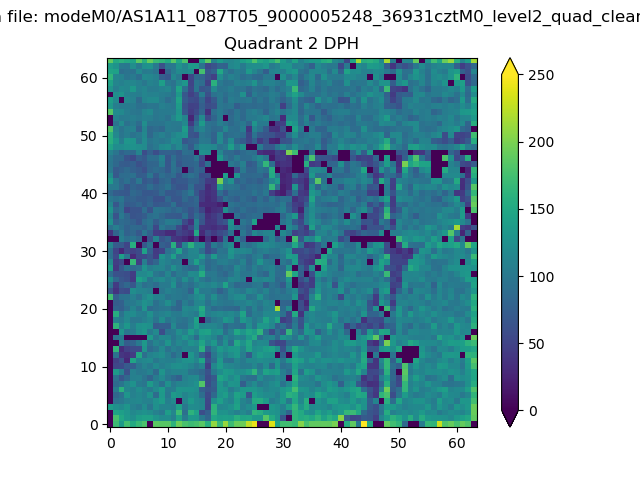
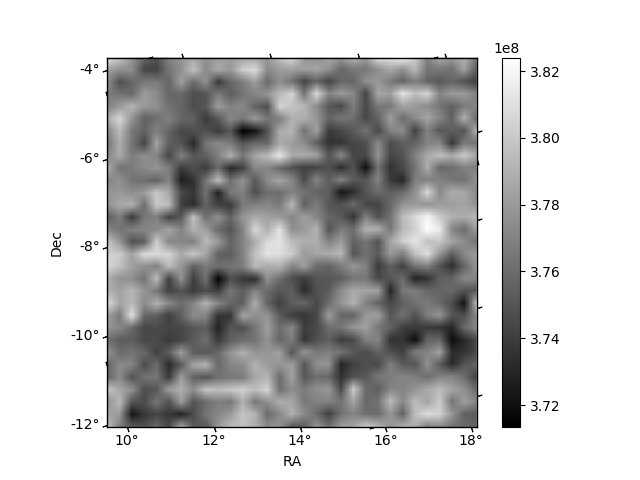
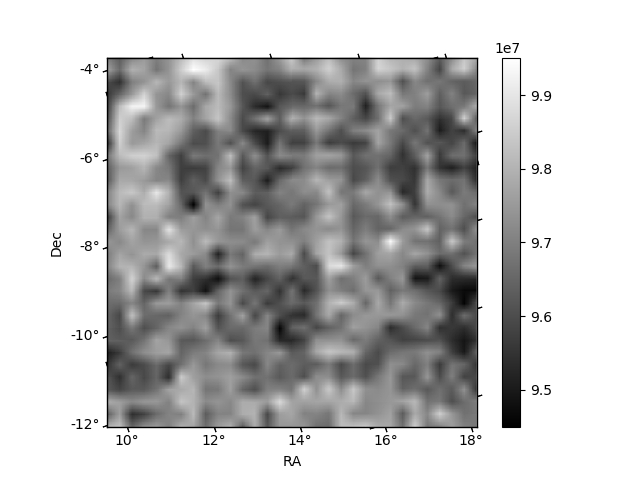
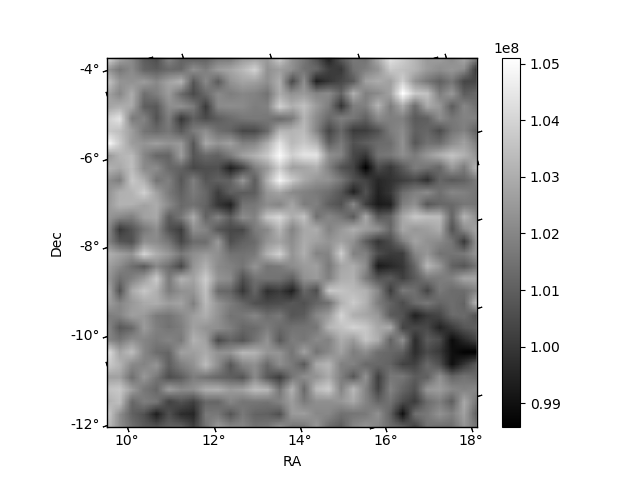
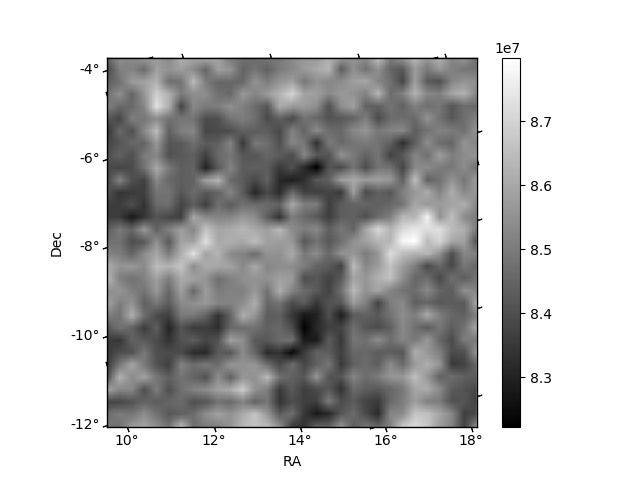
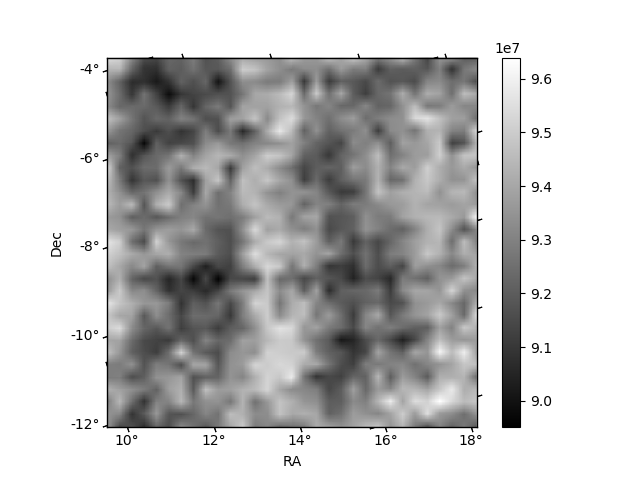
Histogram calculated using DETX and DETY for each event in the final _common_clean file
| Quadrant A | 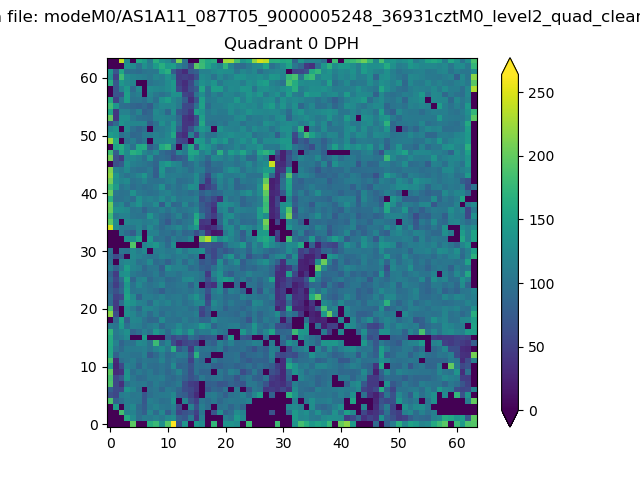 |
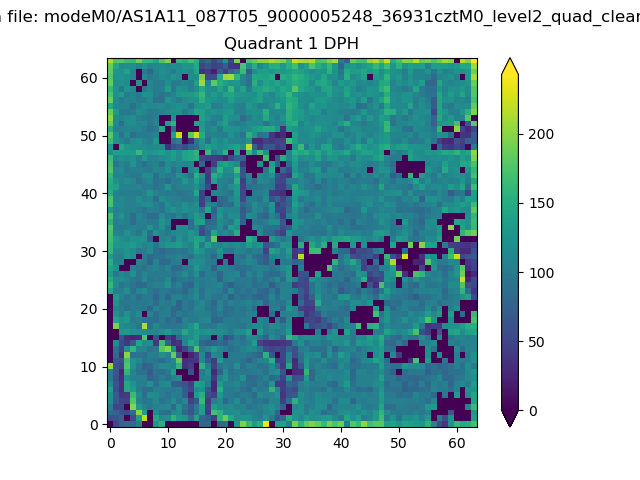 |
Quadrant B |
|---|---|---|---|
| Quadrant D | 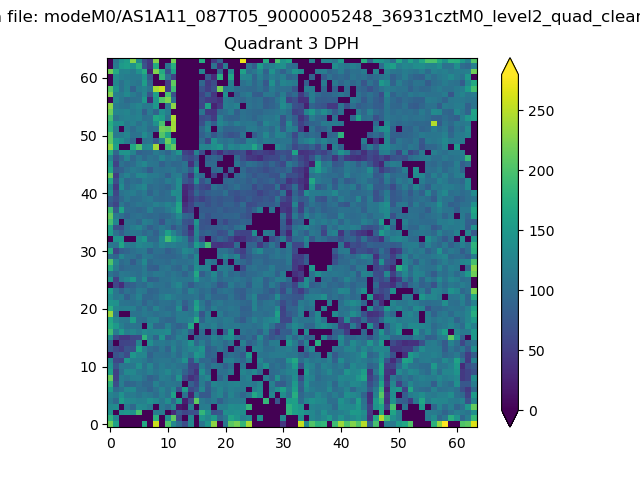 |
 |
Quadrant C |
| Plot type | Count rate plots | Images |
|---|---|---|
| Comparison with Poisson distribution Blue bars denote a histogram of data divided into 1 sec bins. Red curve is a Poisson curve with rate = median count rate of data. |
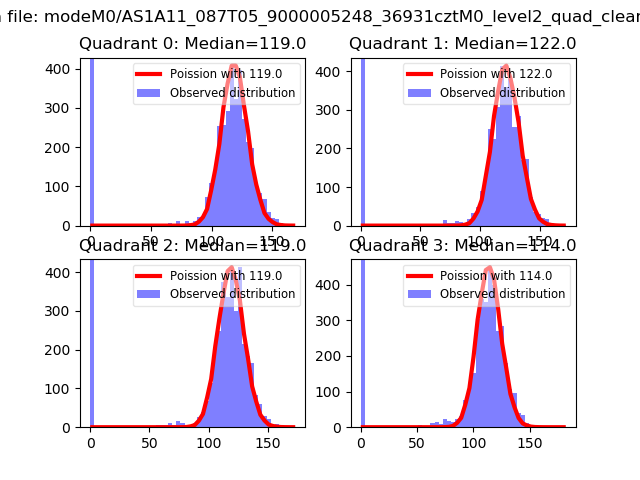 |
 |
| Quadrant-wise count rates Data is divided into 100 sec bins |
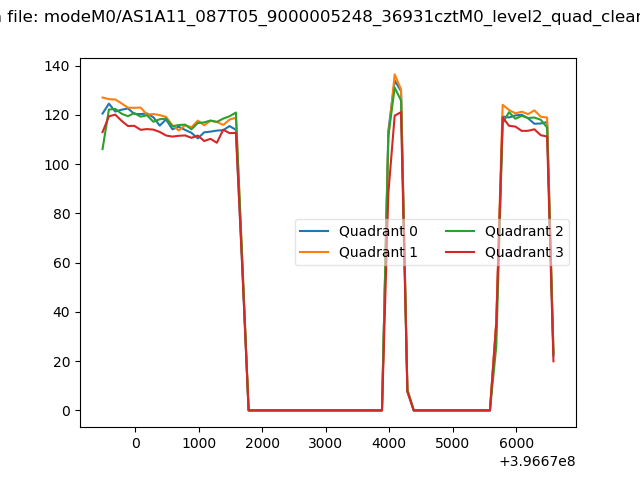 |
|
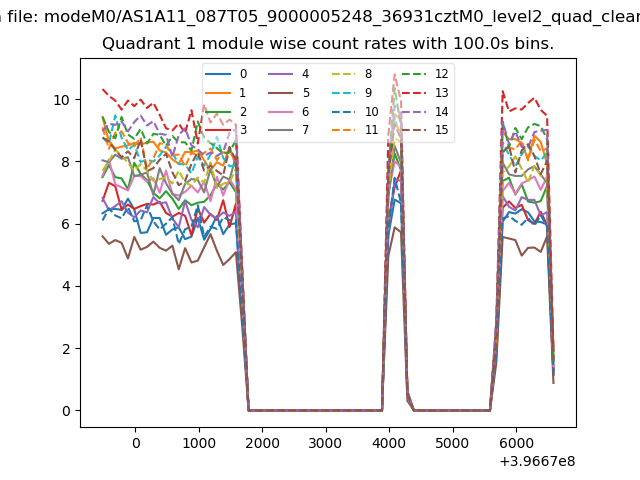
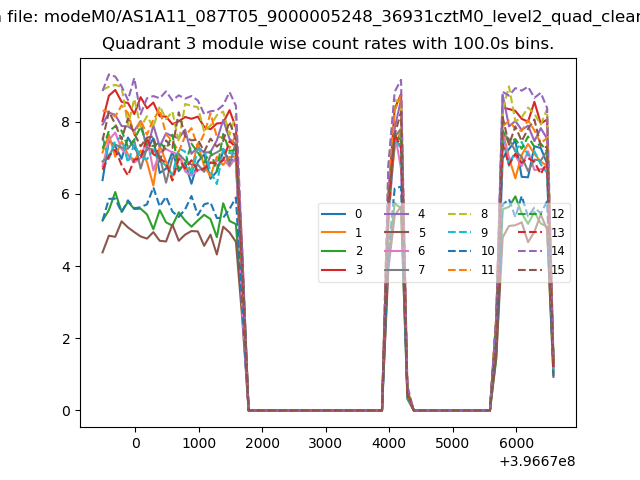
| Module-wise count rates for Quadrant A Data is divided into 100 sec bins |
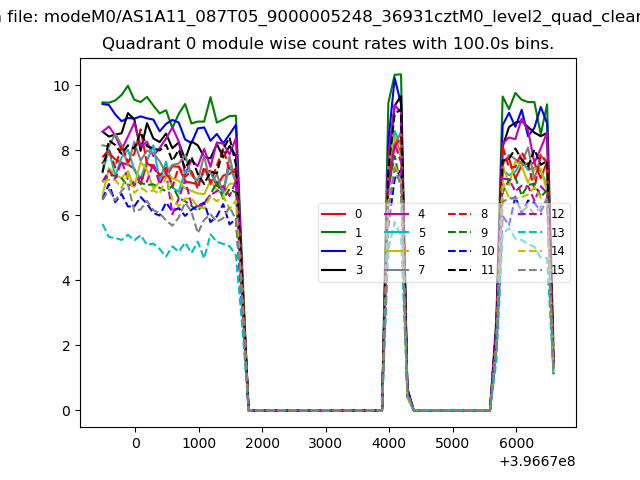 |
 |
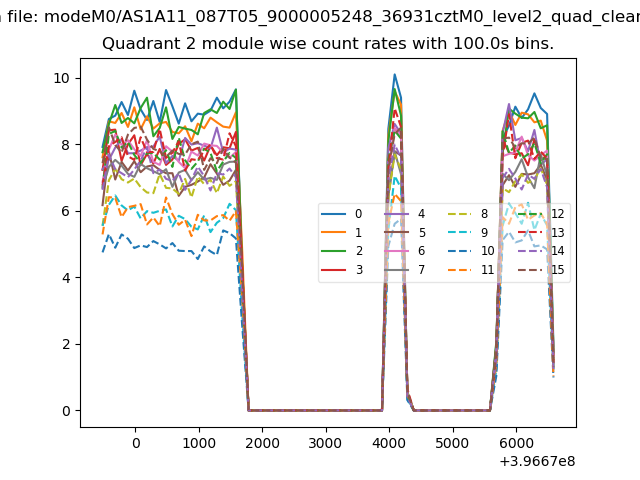
| Module-wise count rates for Quadrant B Data is divided into 100 sec bins |
 |
 |
| Module-wise count rates for Quadrant C Data is divided into 100 sec bins |
 |
 |
| Module-wise count rates for Quadrant D Data is divided into 100 sec bins |
 |
 |
| Parameter | Plot |
|---|---|
| CZT HV Monitor | 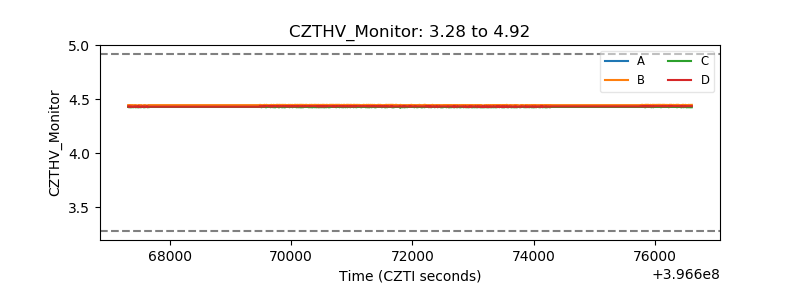 |
| D_VDD | 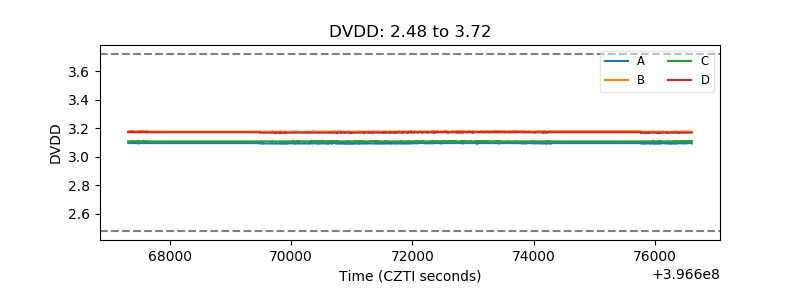 |
| Temperature 1 | 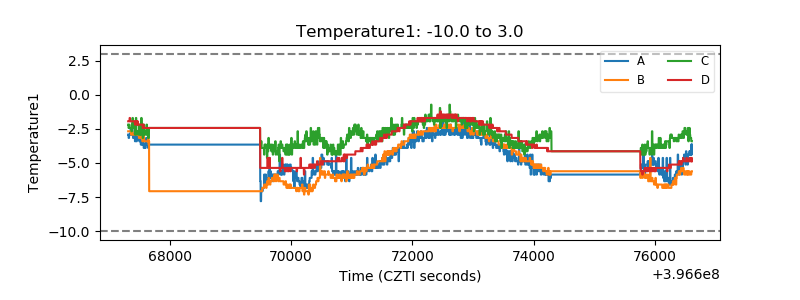 |
| Veto HV Monitor | 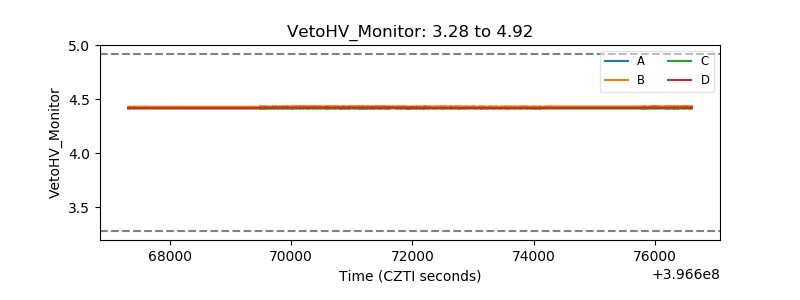 |
| Veto LLD | 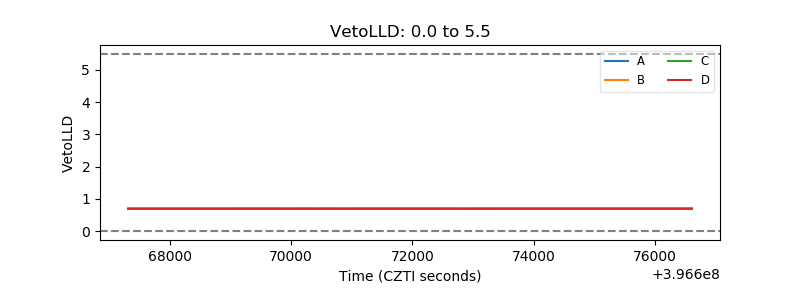 |
| Alpha Counter | 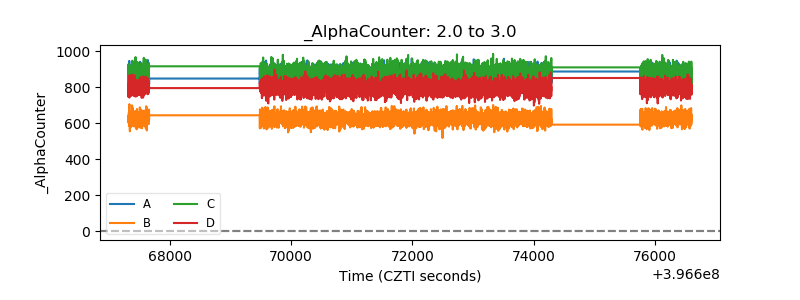 |
| _CPM_Rate | 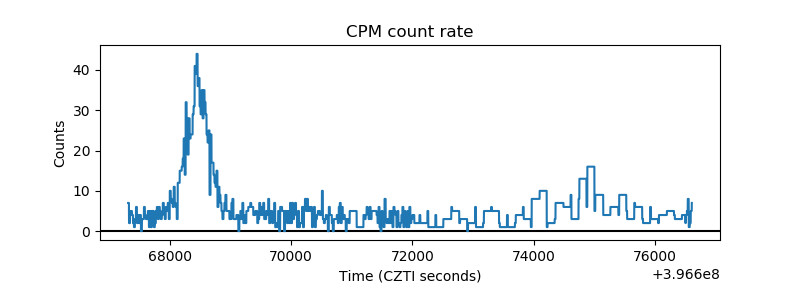 |
| CZT Counter | 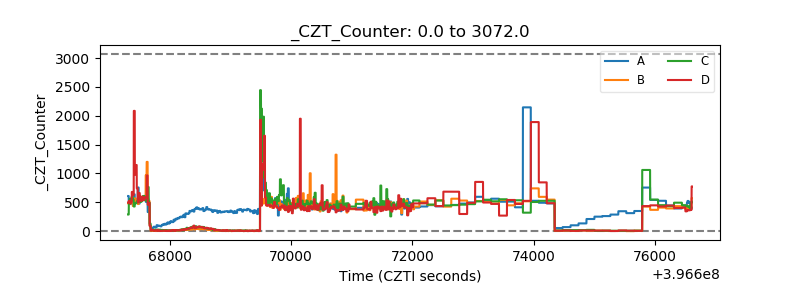 |
| +2.5 Volts monitor | 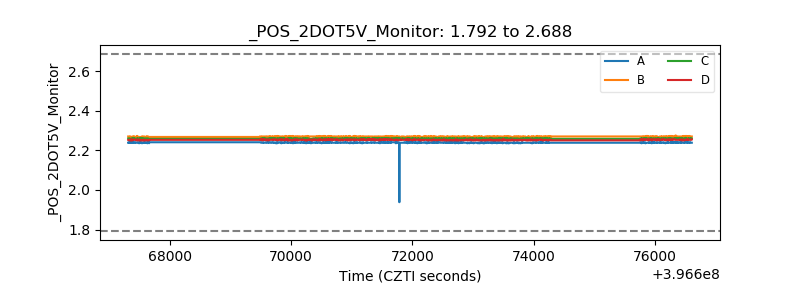 |
| +5 Volts monitor |  |
| _ROLL_ROT | 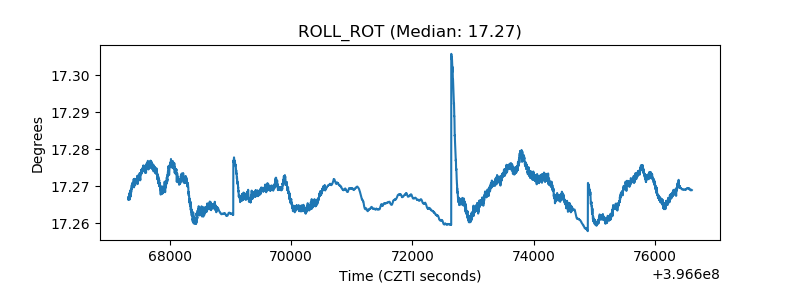 |
| _Roll_DEC | 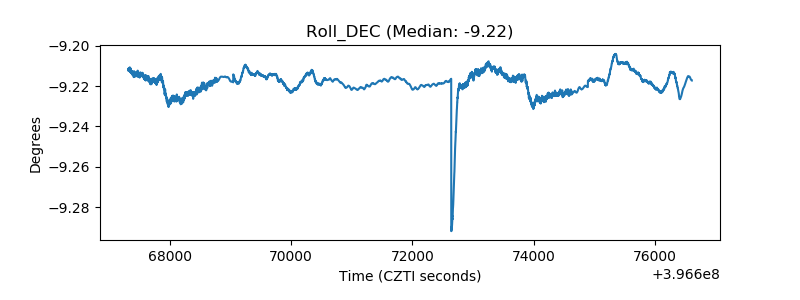 |
| _Roll_RA | 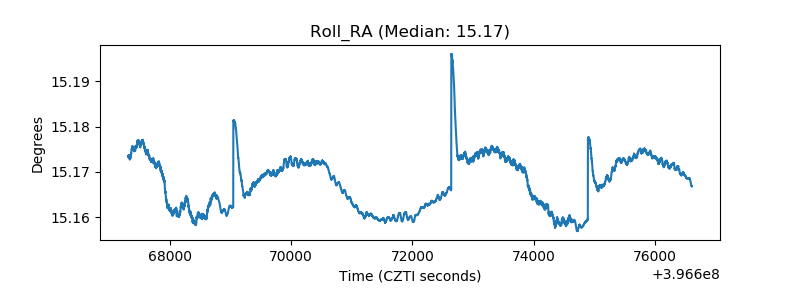 |
| Veto Counter | 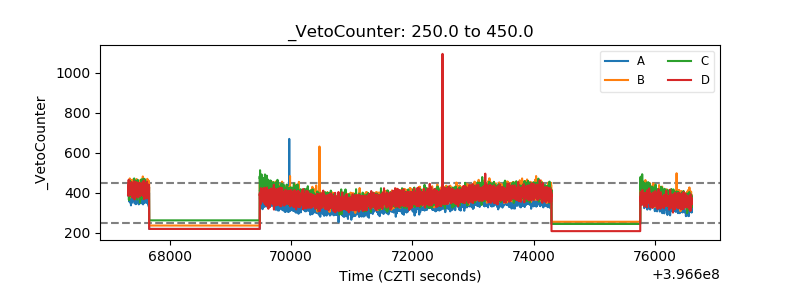 |