| Param | Original file | Final file |
|---|---|---|
| Filename | modeM0/AS1A11_087T05_9000005248_36937cztM0_level2.evt | modeM0/AS1A11_087T05_9000005248_36937cztM0_level2_quad_clean.evt |
| Size (bytes) | 1,928,185,920 | 273,484,800 |
| Size | 1.8 GB | 260.8 MB |
| Events in quadrant A | 12,712,450 | 1,628,416 |
| Events in quadrant B | 13,818,606 | 1,646,172 |
| Events in quadrant C | 13,553,296 | 1,622,594 |
| Events in quadrant D | 16,512,726 | 1,553,758 |
| Mode M0 | |||
|---|---|---|---|
| Quadrant | BADHDUFLAG | Total packets | Discarded packets |
| A | 0 | 54653 | 5 |
| B | 0 | 58371 | 5 |
| C | 0 | 56318 | 5 |
| D | 0 | 67331 | 5 |
| Mode SS | |||
|---|---|---|---|
| Quadrant | BADHDUFLAG | Total packets | Discarded packets |
| A | 0 | 542 | 0 |
| B | 0 | 542 | 0 |
| C | 0 | 542 | 0 |
| D | 0 | 542 | 0 |
| Mode M9 | |||
|---|---|---|---|
| Quadrant | BADHDUFLAG | Total packets | Discarded packets |
| A | 0 | 71 | 0 |
| B | 0 | 71 | 0 |
| C | 0 | 71 | 0 |
| D | 0 | 71 | 0 |
| Quadrant | Total seconds | Saturated seconds | Saturation percentage |
|---|---|---|---|
| A | 26639 | 54 | 0.202710% |
| B | 26639 | 284 | 1.066106% |
| C | 26639 | 154 | 0.578100% |
| D | 26639 | 1151 | 4.320733% |
Noise dominated data is calculated using 1-second bins in cleaned event files. If a bin has >2000 counts, and if more than 50% of those come from <1% of pixels, then it is considered to be noise-dominated and hence unusable.
| Quadrant | # 1 sec bins | Bins with >0 counts | Bins with >2000 counts | High rate bins dominated by noise | Noise dominated (total time) | Noise dominated (detector-on time) | Marked lightcurve |
|---|---|---|---|---|---|---|---|
| A | 33684 | 26644 | 15 | 15 | 0.04% | 0.06% | 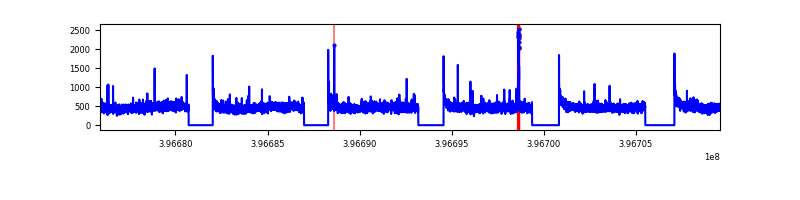 |
| B | 33684 | 26644 | 160 | 160 | 0.48% | 0.60% | 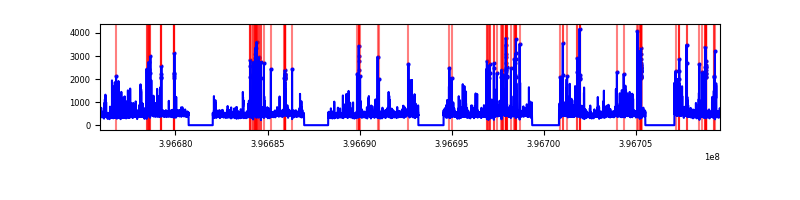 |
| C | 33684 | 26644 | 122 | 122 | 0.36% | 0.46% | 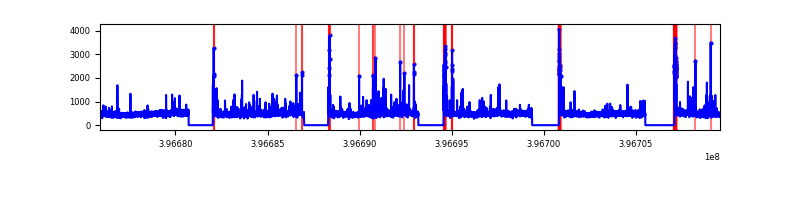 |
| D | 33684 | 26644 | 1040 | 1040 | 3.09% | 3.90% | 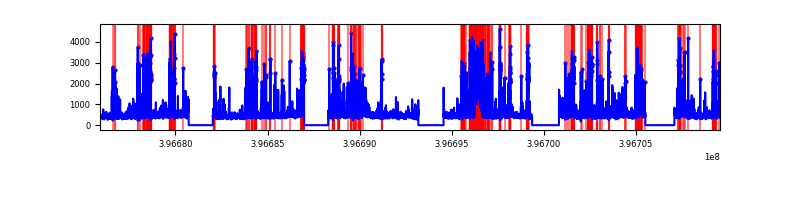 |
Top three noisy pixels from each quadrant. If the there are fewer than three noisy pixels in the level2.evt file, extra rows are filled as -1
| Pixel properties | Quadrant properties | ||||||
|---|---|---|---|---|---|---|---|
| Quadrant | DetID | PixID | Counts | Sigma | Mean | Median | Sigma |
| A | 10 | 83 | 876140 | 1442.11 | 3021 | 2959 | 605.5 |
| A | 15 | 174 | 100146 | 160.51 | 3021 | 2959 | 605.5 |
| A | 13 | 6 | 45853 | 70.84 | 3021 | 2959 | 605.5 |
| B | 0 | 229 | 608258 | 1057.08 | 2992 | 2907 | 572.7 |
| B | 5 | 172 | 434928 | 754.4 | 2992 | 2907 | 572.7 |
| B | 0 | 182 | 209705 | 361.12 | 2992 | 2907 | 572.7 |
| C | 15 | 214 | 1123575 | 1648.29 | 2935 | 2957 | 679.9 |
| C | 0 | 10 | 671457 | 983.28 | 2935 | 2957 | 679.9 |
| C | 15 | 159 | 152707 | 220.26 | 2935 | 2957 | 679.9 |
| D | 12 | 233 | 2322162 | 3260.12 | 2907 | 2825 | 711.4 |
| D | 12 | 17 | 1155476 | 1620.2 | 2907 | 2825 | 711.4 |
| D | 2 | 153 | 376843 | 525.73 | 2907 | 2825 | 711.4 |
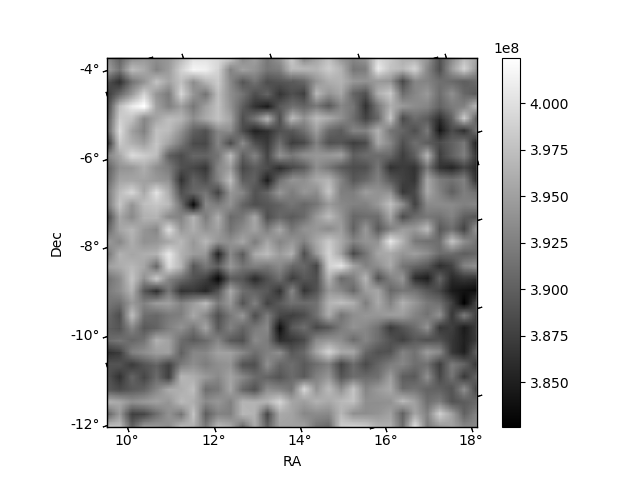
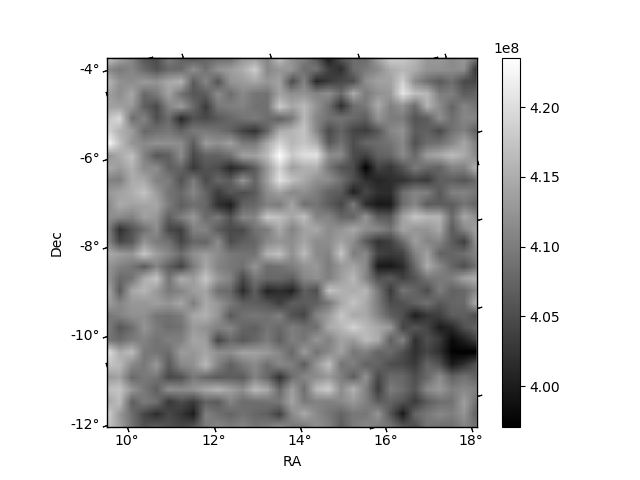
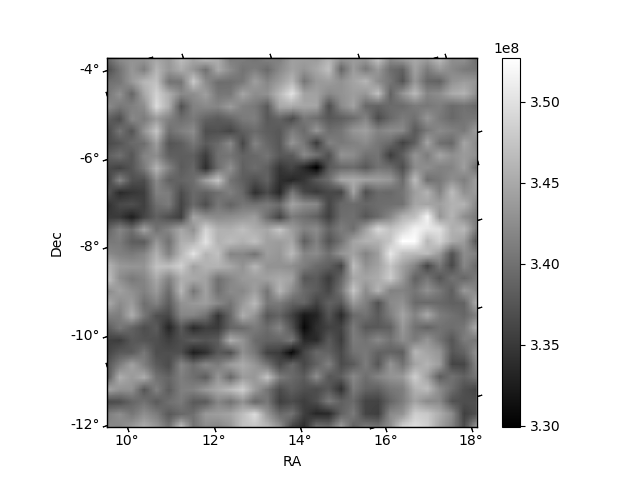
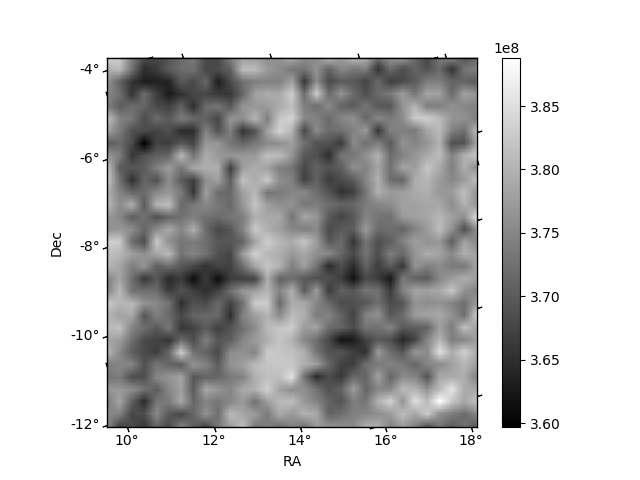
Histogram calculated using DETX and DETY for each event in the final _common_clean file
| Quadrant A |  |
 |
Quadrant B |
|---|---|---|---|
| Quadrant D | 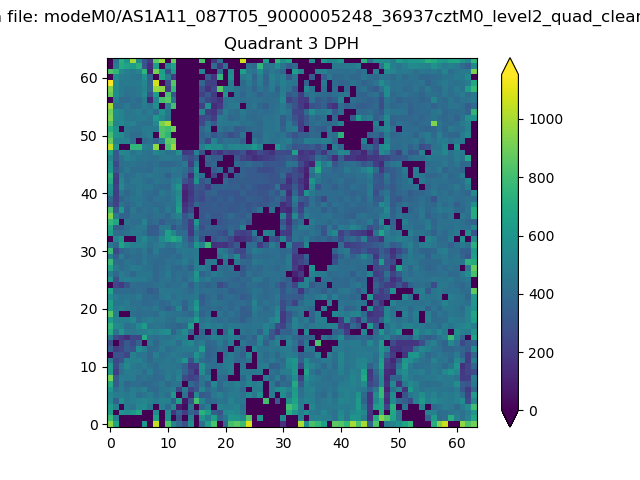 |
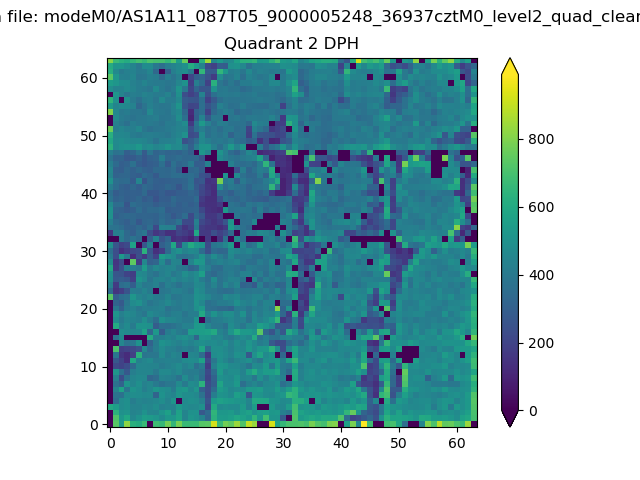 |
Quadrant C |
| Plot type | Count rate plots | Images |
|---|---|---|
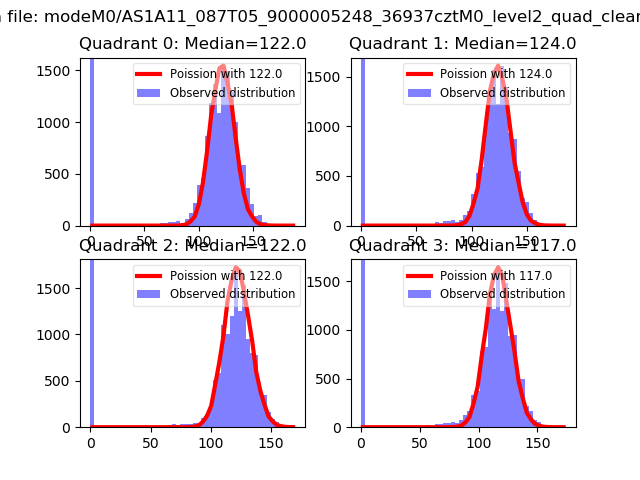
| Comparison with Poisson distribution Blue bars denote a histogram of data divided into 1 sec bins. Red curve is a Poisson curve with rate = median count rate of data. |
 |
 |
| Quadrant-wise count rates Data is divided into 100 sec bins |
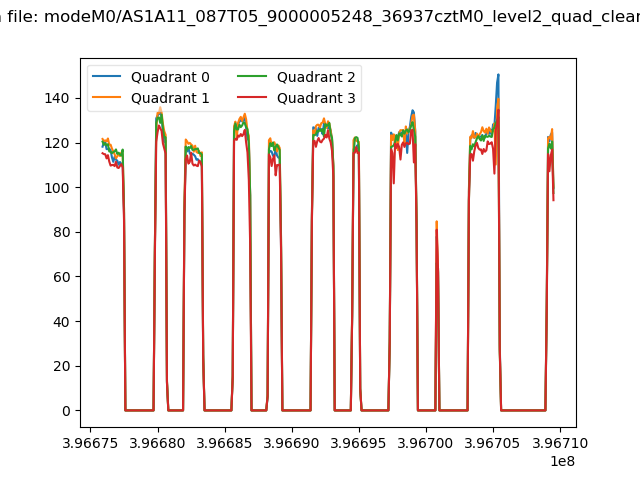 |
|
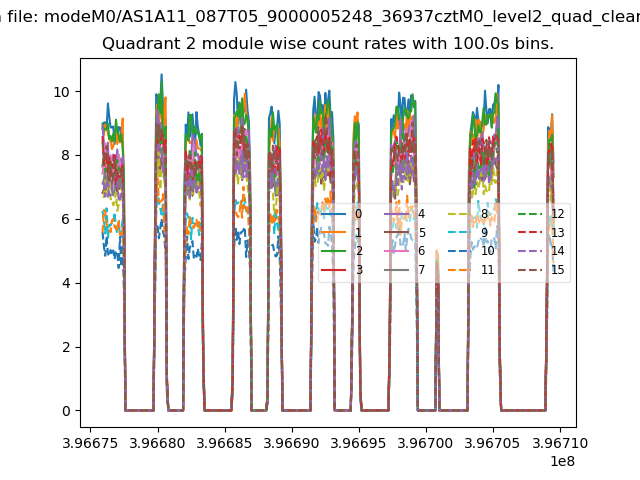
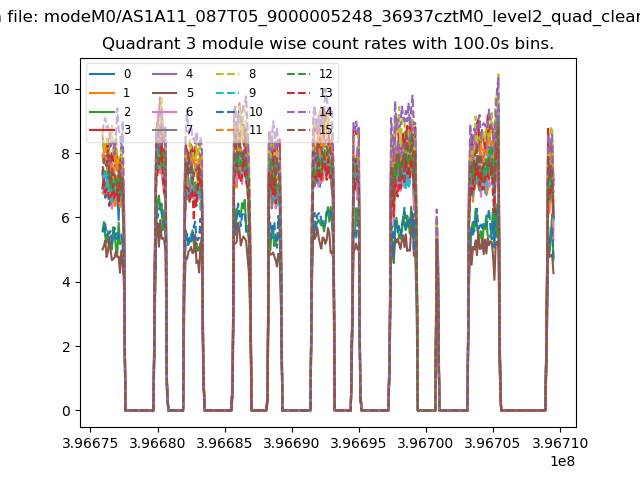
| Module-wise count rates for Quadrant A Data is divided into 100 sec bins |
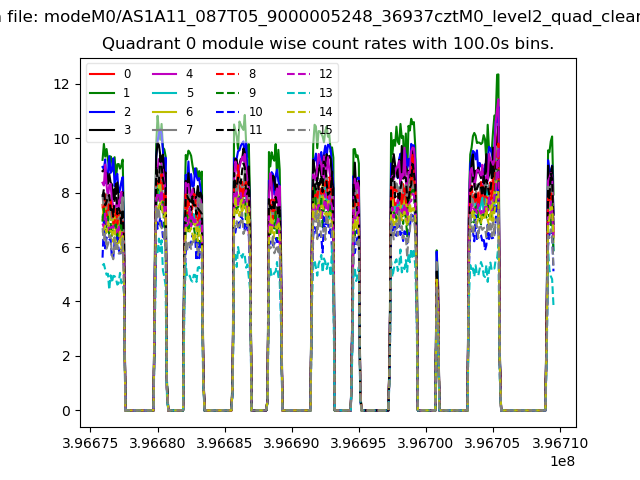 |
 |
| Module-wise count rates for Quadrant B Data is divided into 100 sec bins |
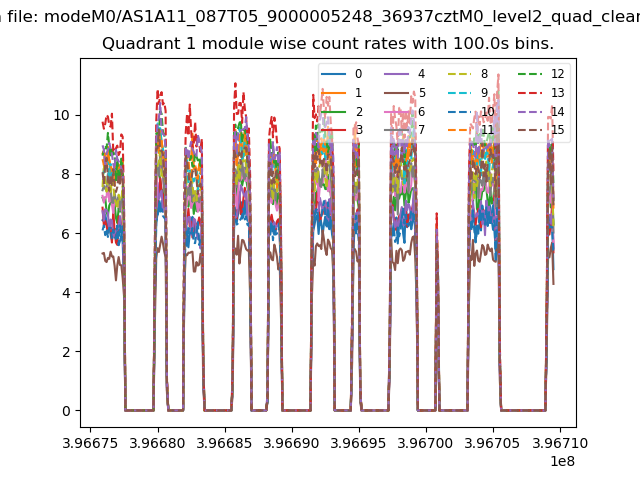 |
 |
| Module-wise count rates for Quadrant C Data is divided into 100 sec bins |
 |
 |
| Module-wise count rates for Quadrant D Data is divided into 100 sec bins |
 |
 |
| Parameter | Plot |
|---|---|
| CZT HV Monitor | 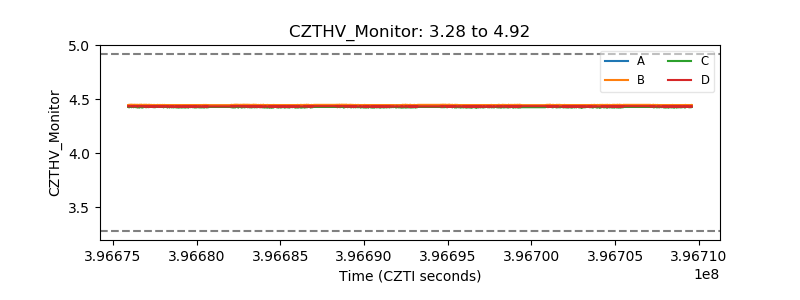 |
| D_VDD | 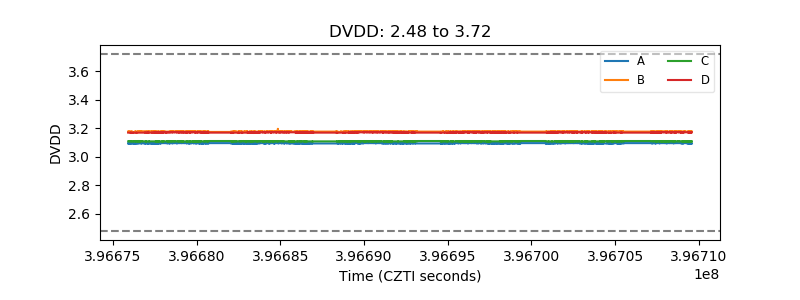 |
| Temperature 1 | 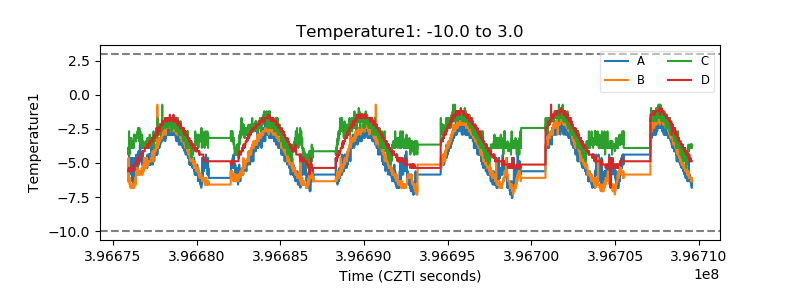 |
| Veto HV Monitor | 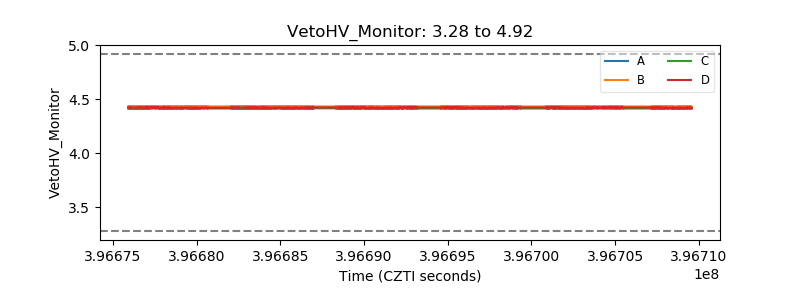 |
| Veto LLD | 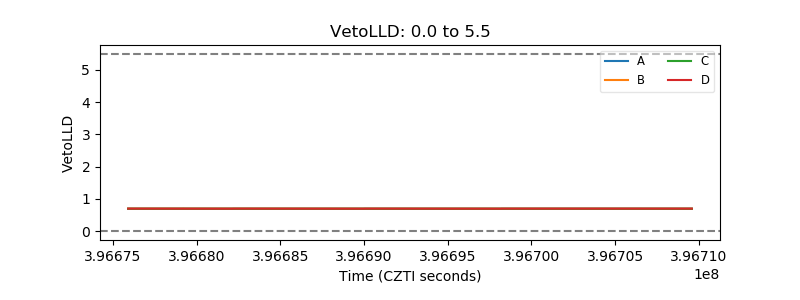 |
| Alpha Counter | 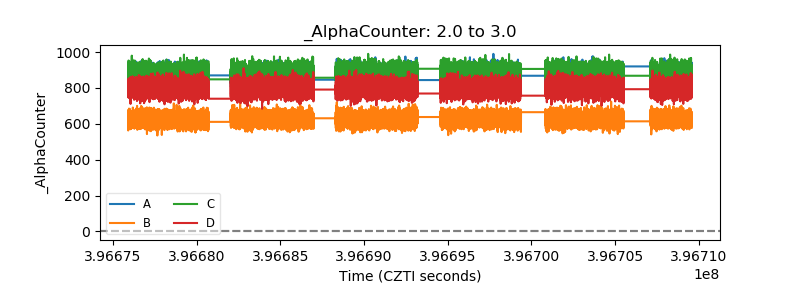 |
| _CPM_Rate | 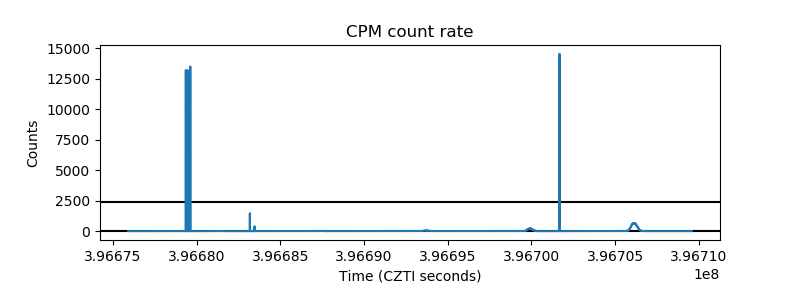 |
| CZT Counter | 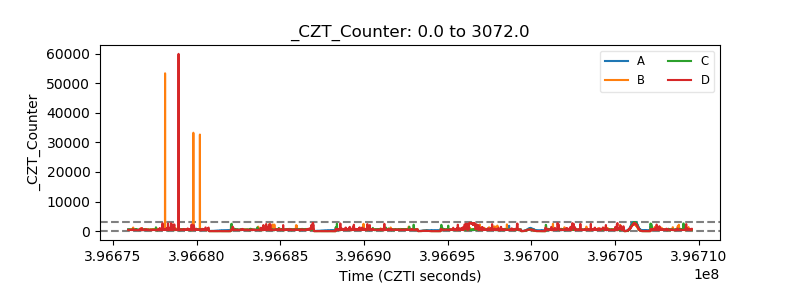 |
| +2.5 Volts monitor | 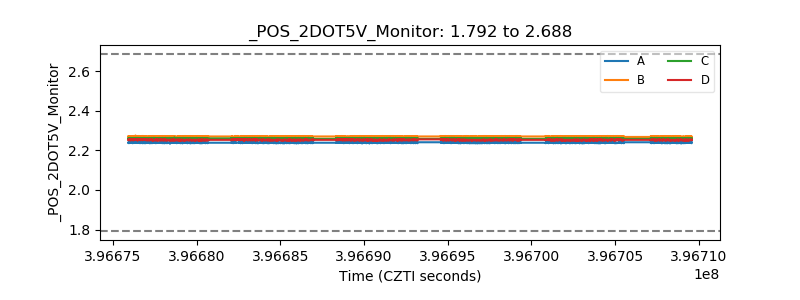 |
| +5 Volts monitor | 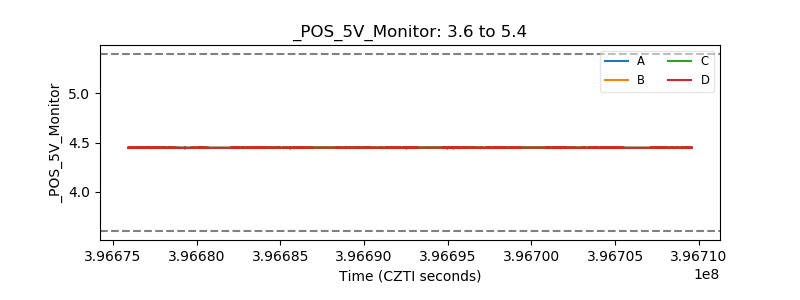 |
| _ROLL_ROT | 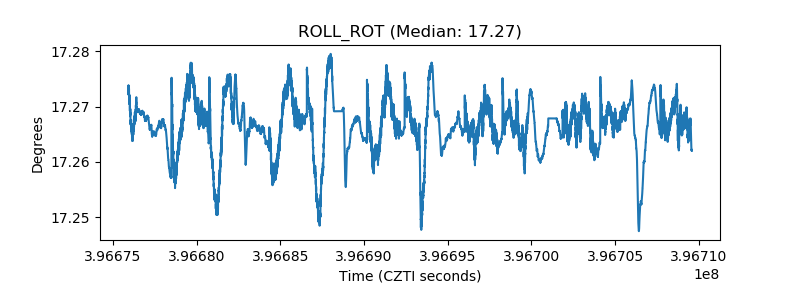 |
| _Roll_DEC | 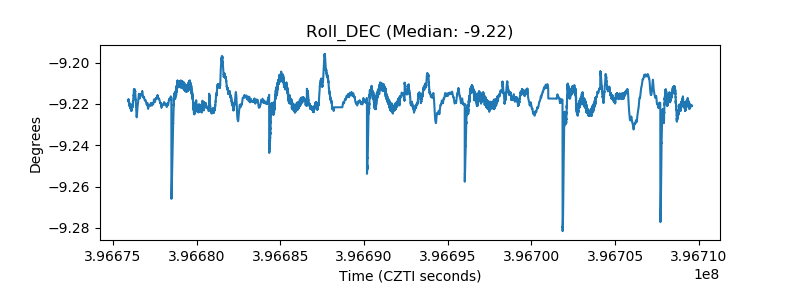 |
| _Roll_RA | 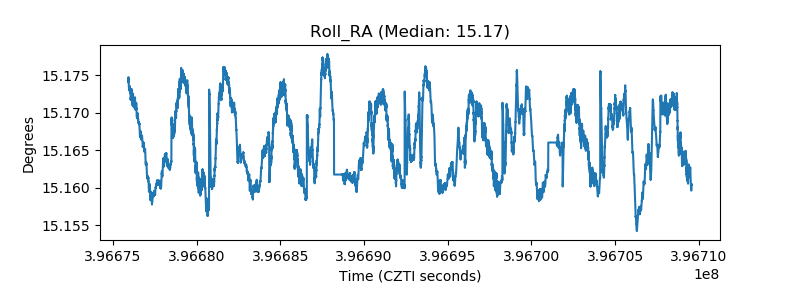 |
| Veto Counter | 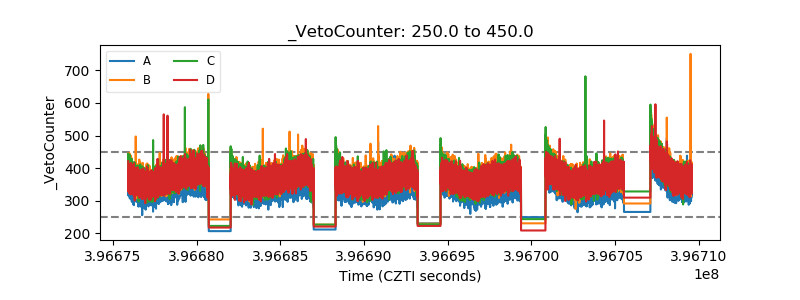 |