| Param | Original file | Final file |
|---|---|---|
| Filename | modeM0/AS1A11_024T01_9000005250cztM0_level2.fits | modeM0/AS1A11_024T01_9000005250cztM0_level2_quad_clean.evt |
| Size (bytes) | 585,043,200 | 557,280,000 |
| Size | 557.9 MB | 531.5 MB |
| Events in quadrant A | 3,593,816 | 3,319,958 |
| Events in quadrant B | 3,368,702 | 3,229,756 |
| Events in quadrant C | 3,472,465 | 3,136,752 |
| Events in quadrant D | 2,959,326 | 2,869,006 |
| Mode M9 | |||
|---|---|---|---|
| Quadrant | BADHDUFLAG | Total packets | Discarded packets |
| A | 0 | 255 | 0 |
| B | 0 | 254 | 0 |
| C | 0 | 254 | 0 |
| D | 0 | 255 | 0 |
| Mode SS | |||
|---|---|---|---|
| Quadrant | BADHDUFLAG | Total packets | Discarded packets |
| A | 0 | 1295 | 0 |
| B | 0 | 1295 | 0 |
| C | 0 | 1295 | 0 |
| D | 0 | 1300 | 0 |
| Mode M0 | |||
|---|---|---|---|
| Quadrant | BADHDUFLAG | Total packets | Discarded packets |
| A | 0 | 131925 | 0 |
| B | 0 | 159893 | 0 |
| C | 0 | 149559 | 0 |
| D | 0 | 174376 | 0 |
| Quadrant | Total seconds | Saturated seconds | Saturation percentage |
|---|---|---|---|
| A | 63015 | 135 | 0.214235% |
| B | 62977 | 2263 | 3.593375% |
| C | 62946 | 1523 | 2.419534% |
| D | 62942 | 3382 | 5.373201% |
Noise dominated data is calculated using 1-second bins in cleaned event files. If a bin has >2000 counts, and if more than 50% of those come from <1% of pixels, then it is considered to be noise-dominated and hence unusable.
| Quadrant | # 1 sec bins | Bins with >0 counts | Bins with >2000 counts | High rate bins dominated by noise | Noise dominated (total time) | Noise dominated (detector-on time) | Marked lightcurve |
|---|---|---|---|---|---|---|---|
| A | 90402 | 63458 | 0 | 0 | 0.00% | 0.00% | 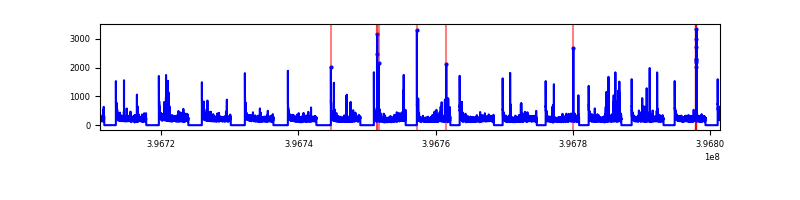 |
| B | 90402 | 63337 | 0 | 0 | 0.00% | 0.00% |  |
| C | 90402 | 63368 | 0 | 0 | 0.00% | 0.00% |  |
| D | 90402 | 63321 | 0 | 0 | 0.00% | 0.00% |  |
Top three noisy pixels from each quadrant. If the there are fewer than three noisy pixels in the level2.evt file, extra rows are filled as -1
| Pixel properties | Quadrant properties | ||||||
|---|---|---|---|---|---|---|---|
| Quadrant | DetID | PixID | Counts | Sigma | Mean | Median | Sigma |
| A | 7 | 110 | 2935 | 8.78 | 940 | 884 | 233.5 |
| A | 9 | 19 | 2919 | 8.71 | 940 | 884 | 233.5 |
| A | 0 | 29 | 2790 | 8.16 | 940 | 884 | 233.5 |
| B | 2 | 9 | 2859 | 11.54 | 891 | 853 | 173.9 |
| B | 3 | 80 | 2540 | 9.7 | 891 | 853 | 173.9 |
| B | 5 | 128 | 2414 | 8.98 | 891 | 853 | 173.9 |
| C | 1 | 81 | 2881 | 8.54 | 917 | 858 | 236.8 |
| C | 1 | 80 | 2726 | 7.89 | 917 | 858 | 236.8 |
| C | 3 | 203 | 2713 | 7.83 | 917 | 858 | 236.8 |
| D | 4 | 160 | 2211 | 6.32 | 847 | 772 | 227.5 |
| D | 10 | 113 | 2189 | 6.23 | 847 | 772 | 227.5 |
| D | 7 | 3 | 2184 | 6.2 | 847 | 772 | 227.5 |
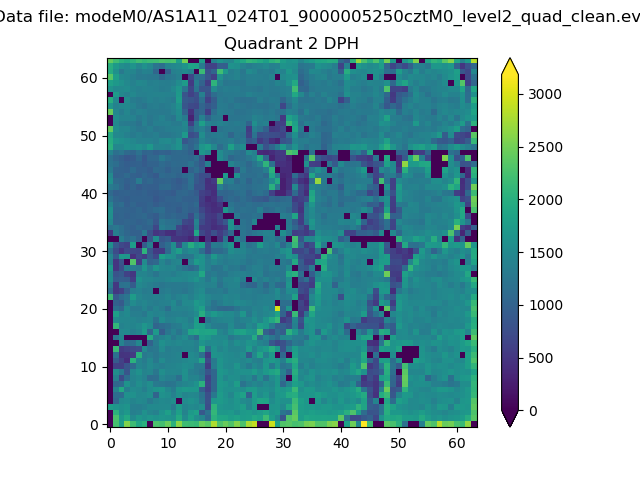
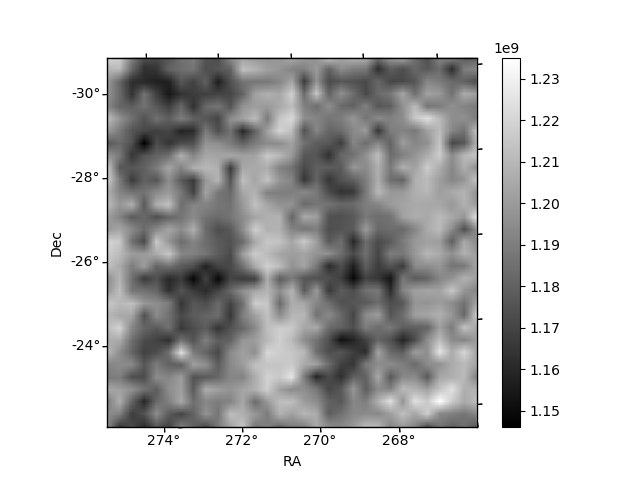
Histogram calculated using DETX and DETY for each event in the final _common_clean file
| Quadrant A |  |
 |
Quadrant B |
|---|---|---|---|
| Quadrant D |  |
 |
Quadrant C |
| Plot type | Count rate plots | Images |
|---|---|---|
| Comparison with Poisson distribution Blue bars denote a histogram of data divided into 1 sec bins. Red curve is a Poisson curve with rate = median count rate of data. |
 |
 |
| Quadrant-wise count rates Data is divided into 100 sec bins |
 |
|
| Module-wise count rates for Quadrant A Data is divided into 100 sec bins |
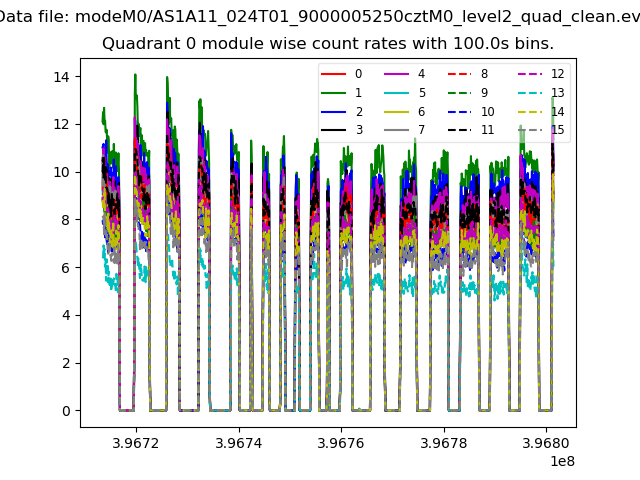 |
 |
| Module-wise count rates for Quadrant B Data is divided into 100 sec bins |
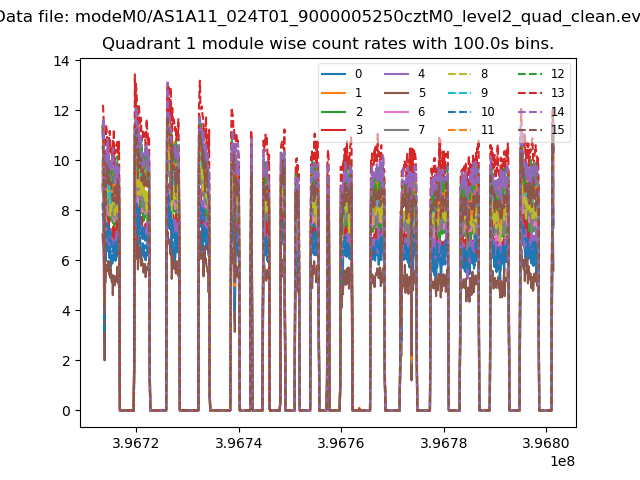 |
 |
| Module-wise count rates for Quadrant C Data is divided into 100 sec bins |
 |
 |
| Module-wise count rates for Quadrant D Data is divided into 100 sec bins |
 |
 |
| Parameter | Plot |
|---|---|
| CZT HV Monitor |  |
| D_VDD |  |
| Temperature 1 |  |
| Veto HV Monitor |  |
| Veto LLD |  |
| Alpha Counter |  |
| _CPM_Rate |  |
| CZT Counter | 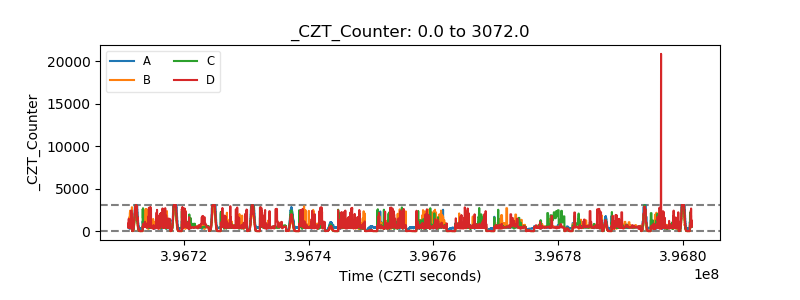 |
| +2.5 Volts monitor | 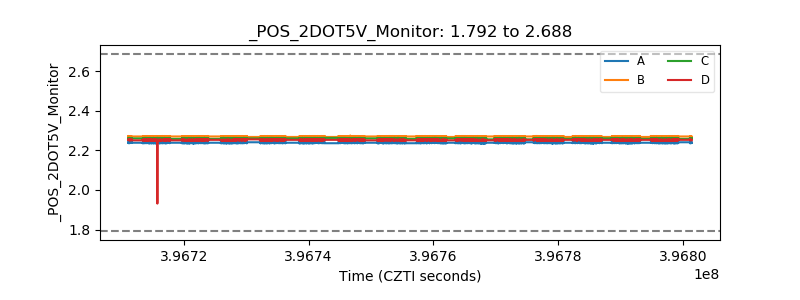 |
| +5 Volts monitor |  |
| _ROLL_ROT |  |
| _Roll_DEC |  |
| _Roll_RA |  |
| Veto Counter |  |