| Param | Original file | Final file |
|---|---|---|
| Filename | modeM0/AS1A11_024T01_9000005250_36937cztM0_level2.evt | modeM0/AS1A11_024T01_9000005250_36937cztM0_level2_quad_clean.evt |
| Size (bytes) | 137,082,240 | 17,781,120 |
| Size | 130.7 MB | 17.0 MB |
| Events in quadrant A | 792,287 | 115,898 |
| Events in quadrant B | 1,410,011 | 100,153 |
| Events in quadrant C | 875,134 | 109,068 |
| Events in quadrant D | 977,101 | 109,134 |
| Mode M9 | |||
|---|---|---|---|
| Quadrant | BADHDUFLAG | Total packets | Discarded packets |
| A | 0 | 17 | 0 |
| B | 0 | 17 | 0 |
| C | 0 | 17 | 0 |
| D | 0 | 17 | 0 |
| Mode SS | |||
|---|---|---|---|
| Quadrant | BADHDUFLAG | Total packets | Discarded packets |
| A | 0 | 30 | 0 |
| B | 0 | 30 | 0 |
| C | 0 | 30 | 0 |
| D | 0 | 30 | 0 |
| Mode M0 | |||
|---|---|---|---|
| Quadrant | BADHDUFLAG | Total packets | Discarded packets |
| A | 0 | 3231 | 2 |
| B | 0 | 5068 | 1 |
| C | 0 | 3393 | 1 |
| D | 0 | 3818 | 1 |
| Quadrant | Total seconds | Saturated seconds | Saturation percentage |
|---|---|---|---|
| A | 1387 | 5 | 0.360490% |
| B | 1387 | 354 | 25.522711% |
| C | 1387 | 65 | 4.686373% |
| D | 1387 | 44 | 3.172314% |
Noise dominated data is calculated using 1-second bins in cleaned event files. If a bin has >2000 counts, and if more than 50% of those come from <1% of pixels, then it is considered to be noise-dominated and hence unusable.
| Quadrant | # 1 sec bins | Bins with >0 counts | Bins with >2000 counts | High rate bins dominated by noise | Noise dominated (total time) | Noise dominated (detector-on time) | Marked lightcurve |
|---|---|---|---|---|---|---|---|
| A | 3090 | 1388 | 0 | 0 | 0.00% | 0.00% | 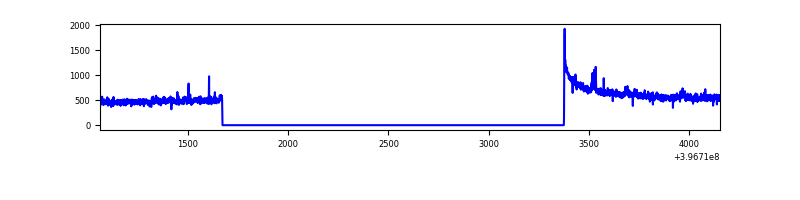 |
| B | 3090 | 1387 | 261 | 261 | 8.45% | 18.82% | 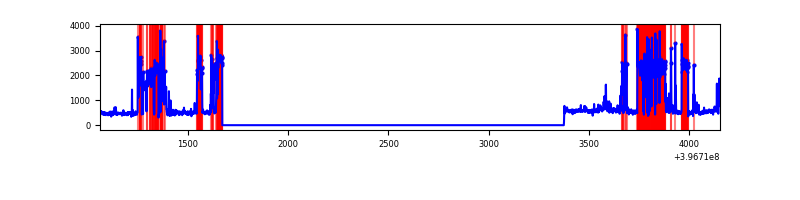 |
| C | 3090 | 1388 | 52 | 52 | 1.68% | 3.75% | 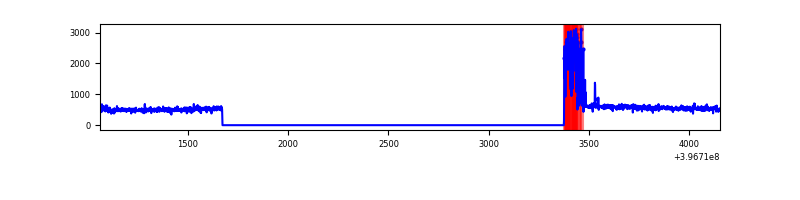 |
| D | 3090 | 1388 | 36 | 36 | 1.17% | 2.59% | 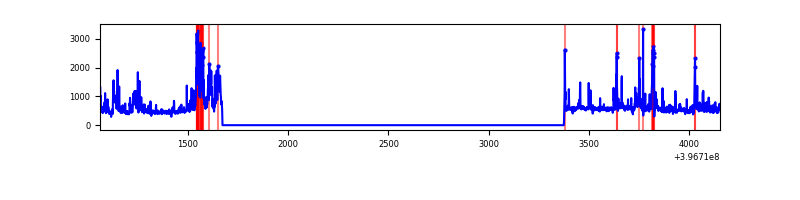 |
Top three noisy pixels from each quadrant. If the there are fewer than three noisy pixels in the level2.evt file, extra rows are filled as -1
| Pixel properties | Quadrant properties | ||||||
|---|---|---|---|---|---|---|---|
| Quadrant | DetID | PixID | Counts | Sigma | Mean | Median | Sigma |
| A | 10 | 83 | 86462 | 2237.41 | 179 | 175 | 38.6 |
| A | 15 | 174 | 6096 | 153.53 | 179 | 175 | 38.6 |
| A | 13 | 6 | 2164 | 51.57 | 179 | 175 | 38.6 |
| B | 0 | 229 | 441158 | 14524.54 | 149 | 145 | 30.4 |
| B | 5 | 172 | 360034 | 11852.76 | 149 | 145 | 30.4 |
| B | 0 | 190 | 5085 | 162.7 | 149 | 145 | 30.4 |
| C | 0 | 10 | 151892 | 3705.67 | 169 | 171 | 40.9 |
| C | 15 | 214 | 61228 | 1491.27 | 169 | 171 | 40.9 |
| C | 15 | 159 | 2380 | 53.95 | 169 | 171 | 40.9 |
| D | 12 | 17 | 161694 | 3625.04 | 172 | 167 | 44.6 |
| D | 12 | 218 | 41964 | 938.02 | 172 | 167 | 44.6 |
| D | 13 | 249 | 28490 | 635.63 | 172 | 167 | 44.6 |
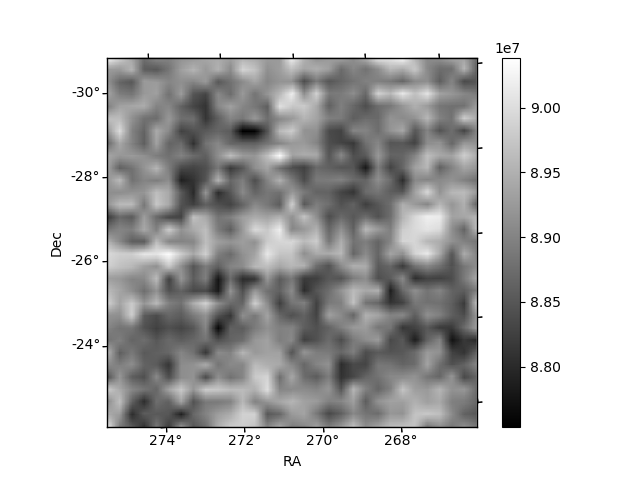
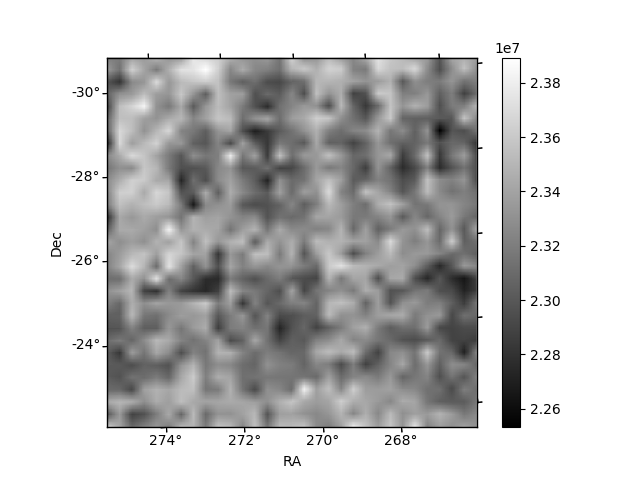
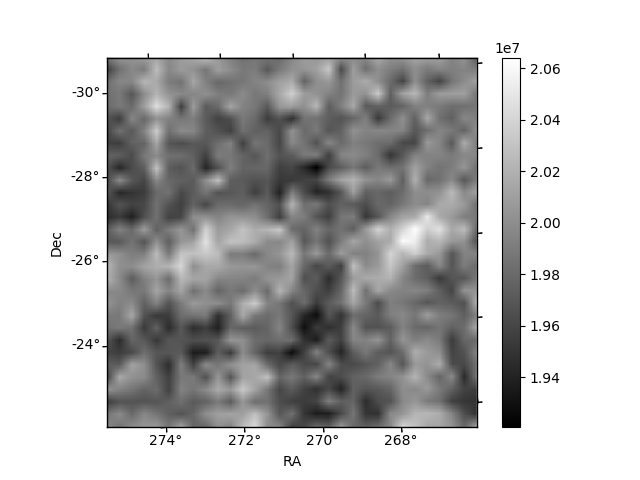
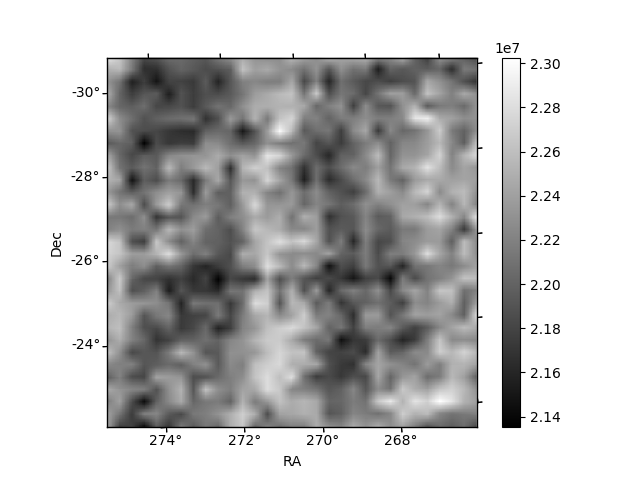
Histogram calculated using DETX and DETY for each event in the final _common_clean file
| Quadrant A | 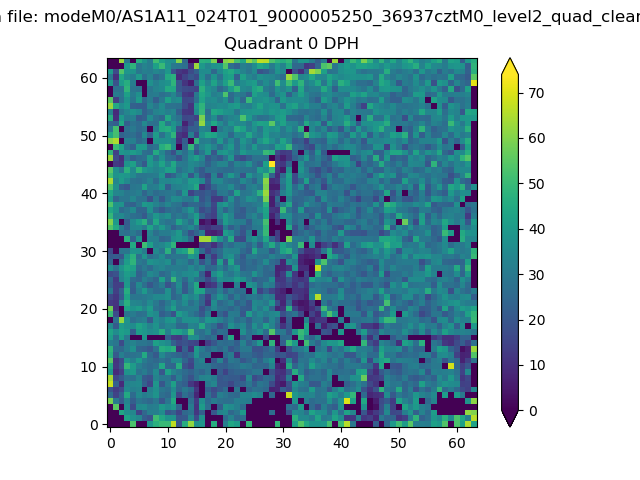 |
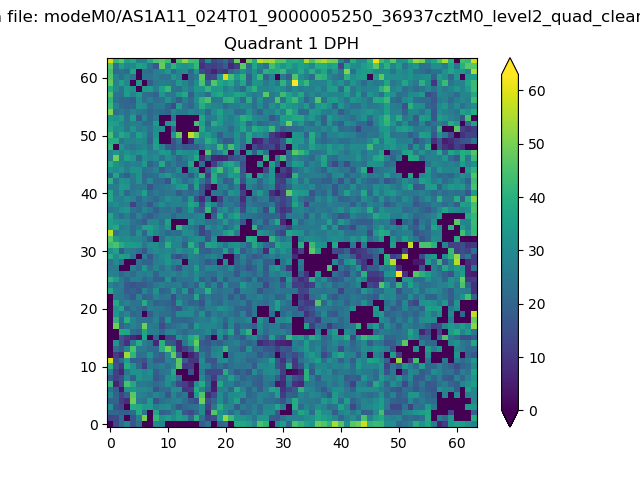 |
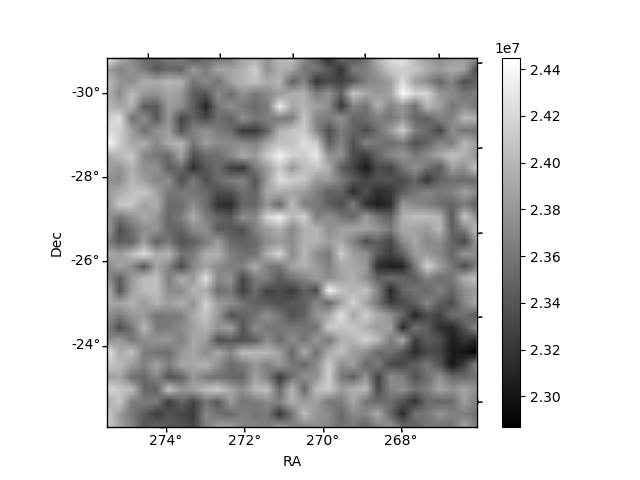
Quadrant B |
|---|---|---|---|
| Quadrant D | 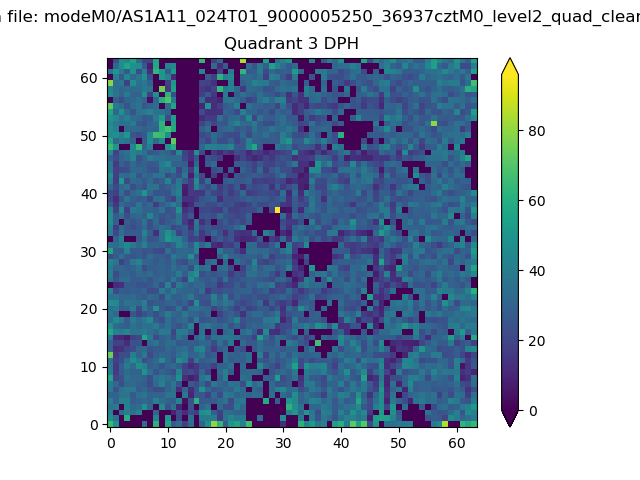 |
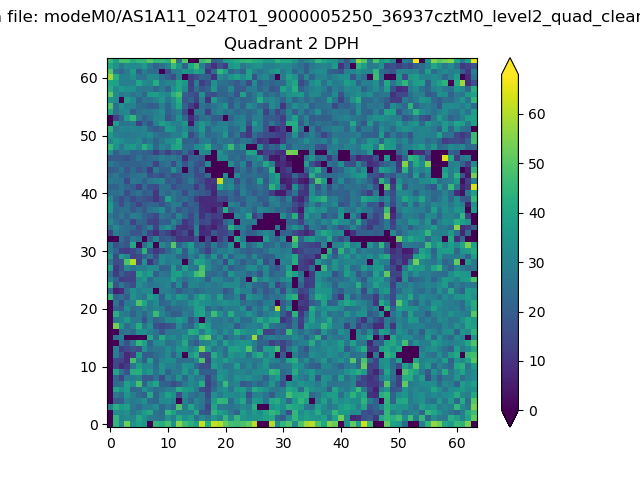 |
Quadrant C |
| Plot type | Count rate plots | Images |
|---|---|---|
| Comparison with Poisson distribution Blue bars denote a histogram of data divided into 1 sec bins. Red curve is a Poisson curve with rate = median count rate of data. |
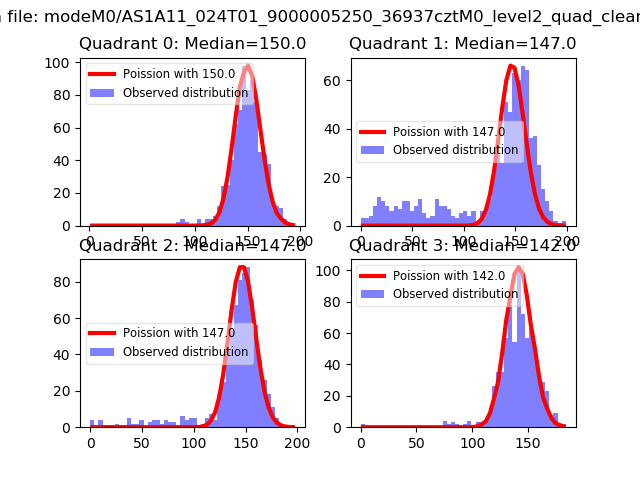 |
 |
| Quadrant-wise count rates Data is divided into 100 sec bins |
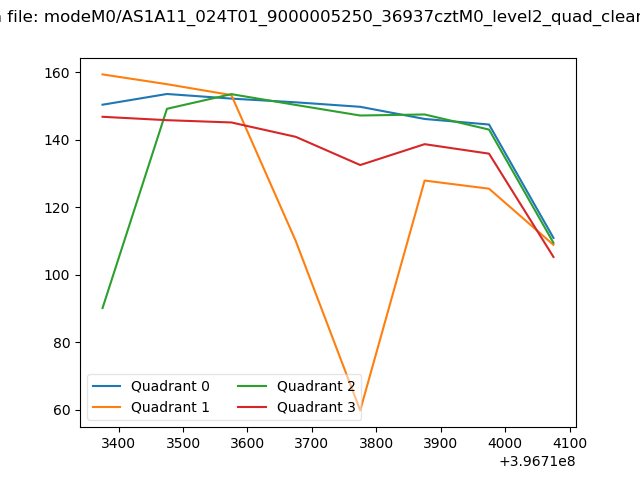 |
|
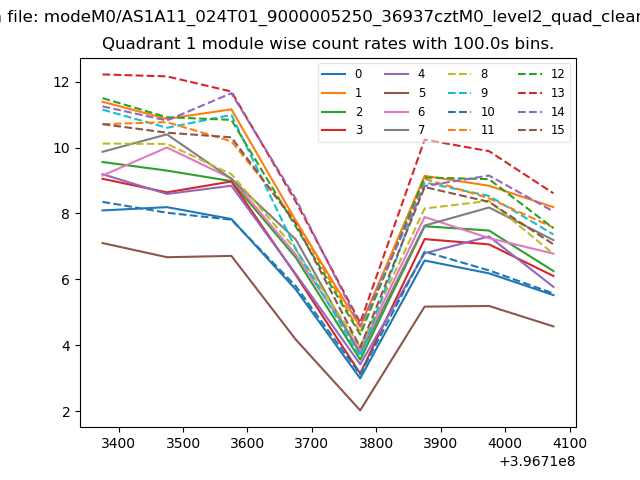
| Module-wise count rates for Quadrant A Data is divided into 100 sec bins |
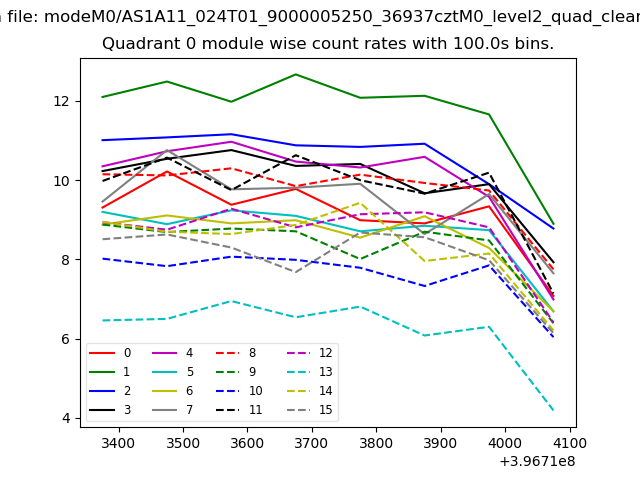 |
 |
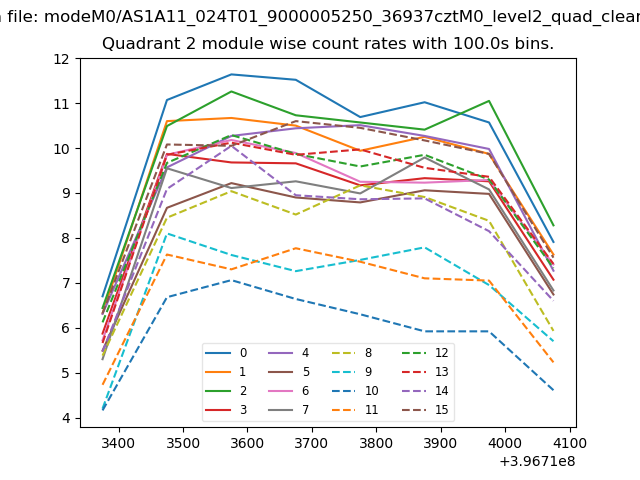
| Module-wise count rates for Quadrant B Data is divided into 100 sec bins |
 |
 |
| Module-wise count rates for Quadrant C Data is divided into 100 sec bins |
 |
 |
| Module-wise count rates for Quadrant D Data is divided into 100 sec bins |
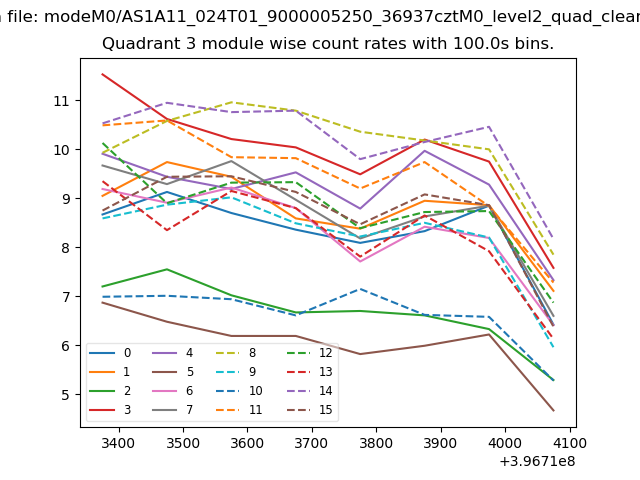 |
 |
| Parameter | Plot |
|---|---|
| CZT HV Monitor | 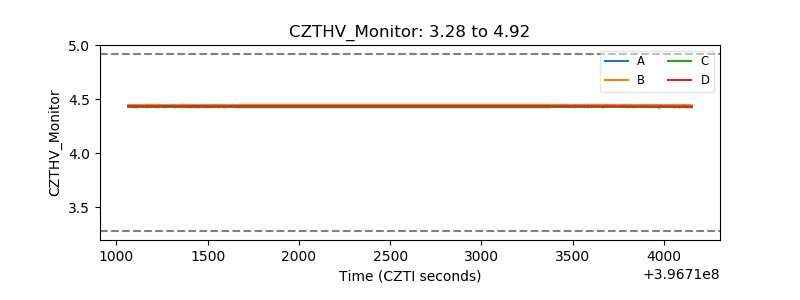 |
| D_VDD | 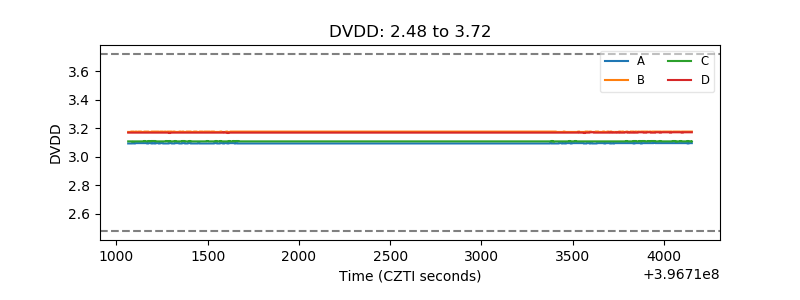 |
| Temperature 1 | 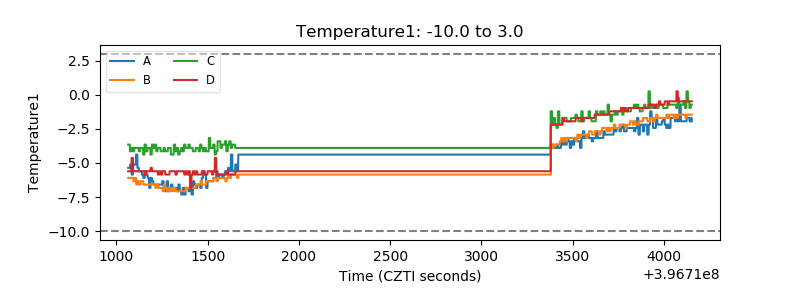 |
| Veto HV Monitor | 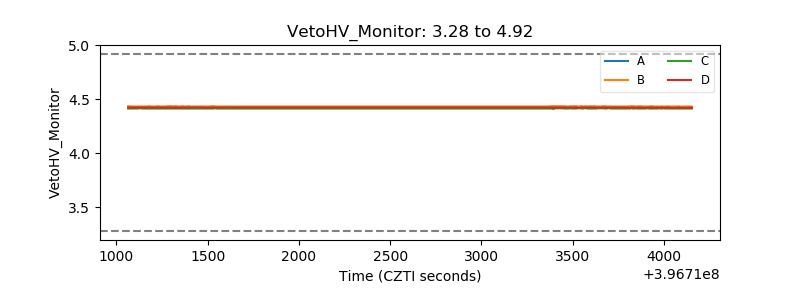 |
| Veto LLD | 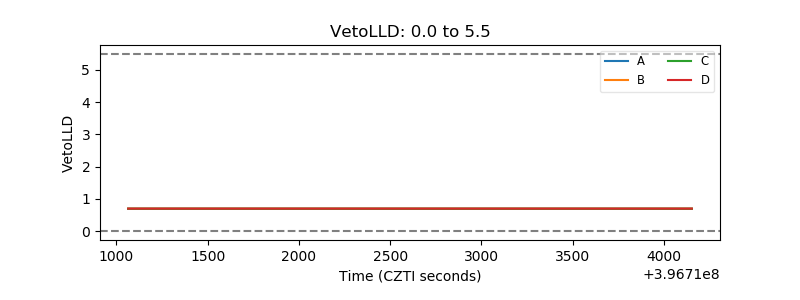 |
| Alpha Counter | 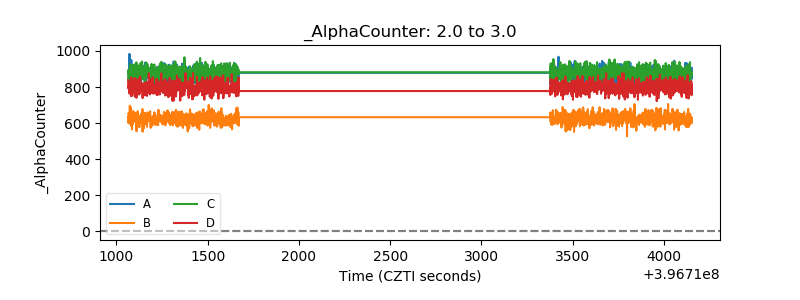 |
| _CPM_Rate | 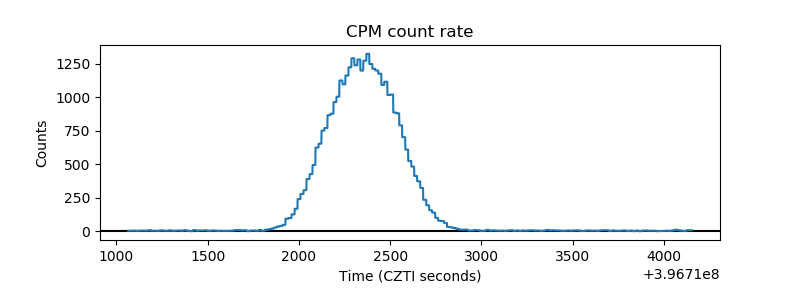 |
| CZT Counter | 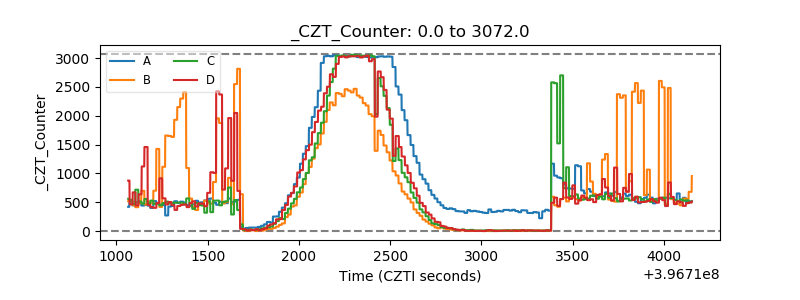 |
| +2.5 Volts monitor | 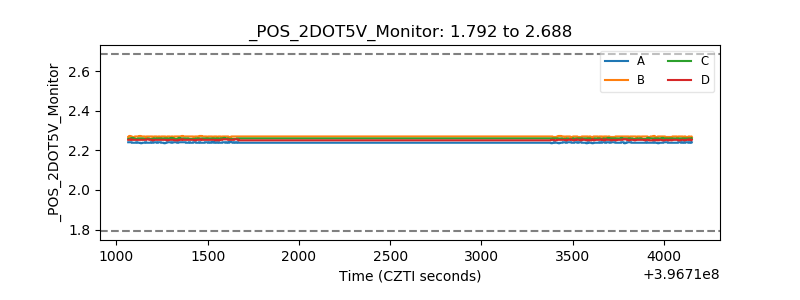 |
| +5 Volts monitor | 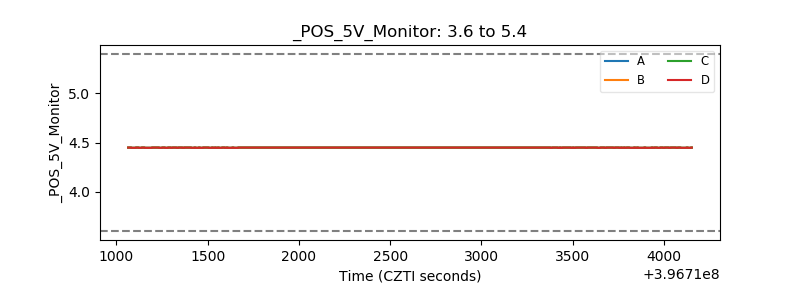 |
| _ROLL_ROT | 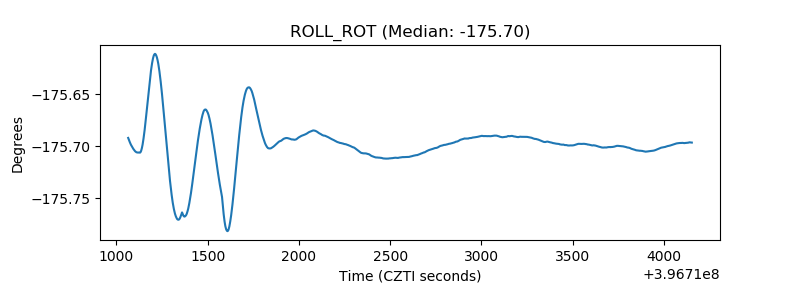 |
| _Roll_DEC | 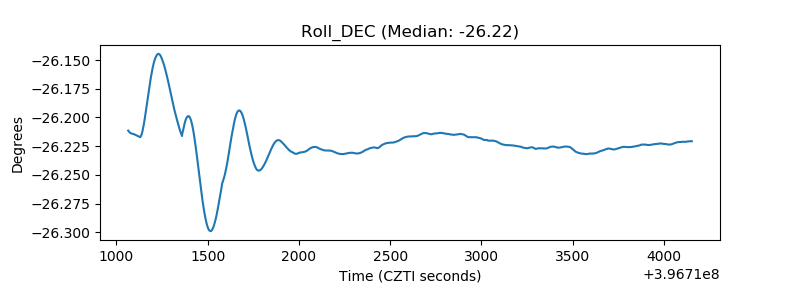 |
| _Roll_RA | 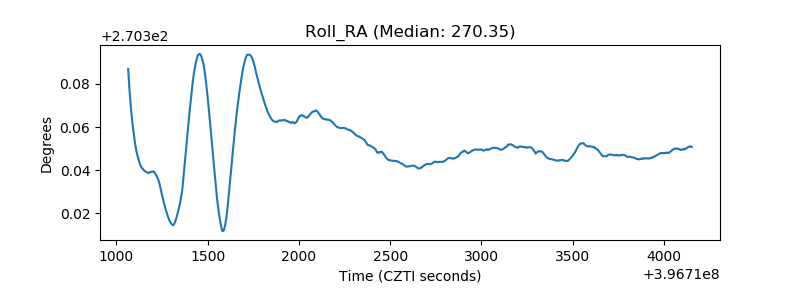 |
| Veto Counter | 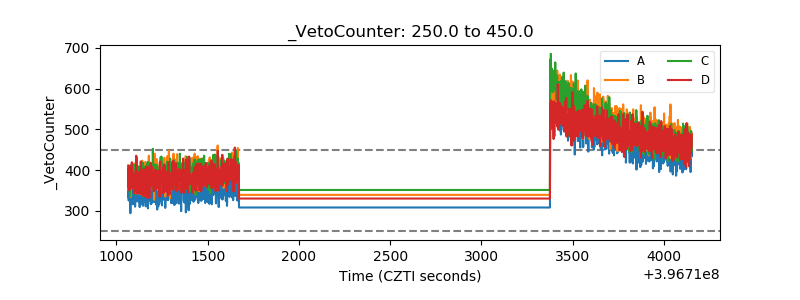 |