| Param | Original file | Final file |
|---|---|---|
| Filename | modeM0/AS1A11_024T01_9000005250_36939cztM0_level2.evt | modeM0/AS1A11_024T01_9000005250_36939cztM0_level2_quad_clean.evt |
| Size (bytes) | 511,640,640 | 92,813,760 |
| Size | 487.9 MB | 88.5 MB |
| Events in quadrant A | 2,953,394 | 634,138 |
| Events in quadrant B | 4,069,970 | 614,590 |
| Events in quadrant C | 3,123,538 | 617,978 |
| Events in quadrant D | 4,967,044 | 550,706 |
| Mode M9 | |||
|---|---|---|---|
| Quadrant | BADHDUFLAG | Total packets | Discarded packets |
| A | 0 | 36 | 0 |
| B | 0 | 36 | 0 |
| C | 0 | 36 | 0 |
| D | 0 | 36 | 0 |
| Mode SS | |||
|---|---|---|---|
| Quadrant | BADHDUFLAG | Total packets | Discarded packets |
| A | 0 | 116 | 0 |
| B | 0 | 116 | 0 |
| C | 0 | 116 | 0 |
| D | 0 | 116 | 0 |
| Mode M0 | |||
|---|---|---|---|
| Quadrant | BADHDUFLAG | Total packets | Discarded packets |
| A | 0 | 12387 | 3 |
| B | 0 | 15664 | 2 |
| C | 0 | 12677 | 2 |
| D | 0 | 18554 | 2 |
| Quadrant | Total seconds | Saturated seconds | Saturation percentage |
|---|---|---|---|
| A | 5620 | 20 | 0.355872% |
| B | 5620 | 469 | 8.345196% |
| C | 5620 | 117 | 2.081851% |
| D | 5620 | 660 | 11.743772% |
Noise dominated data is calculated using 1-second bins in cleaned event files. If a bin has >2000 counts, and if more than 50% of those come from <1% of pixels, then it is considered to be noise-dominated and hence unusable.
| Quadrant | # 1 sec bins | Bins with >0 counts | Bins with >2000 counts | High rate bins dominated by noise | Noise dominated (total time) | Noise dominated (detector-on time) | Marked lightcurve |
|---|---|---|---|---|---|---|---|
| A | 9176 | 5622 | 3 | 3 | 0.03% | 0.05% | 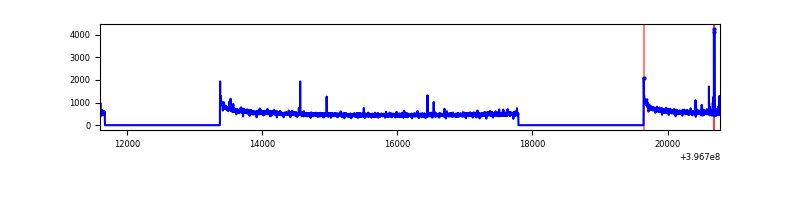 |
| B | 9176 | 5621 | 370 | 370 | 4.03% | 6.58% | 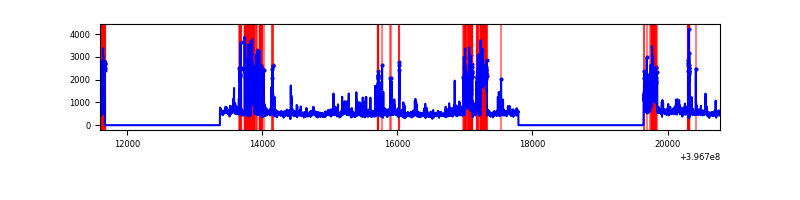 |
| C | 9176 | 5622 | 88 | 88 | 0.96% | 1.57% |  |
| D | 9176 | 5622 | 598 | 598 | 6.52% | 10.64% | 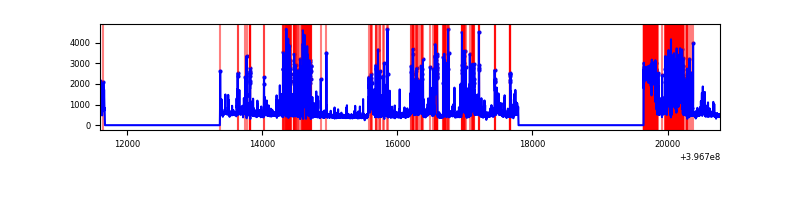 |
Top three noisy pixels from each quadrant. If the there are fewer than three noisy pixels in the level2.evt file, extra rows are filled as -1
| Pixel properties | Quadrant properties | ||||||
|---|---|---|---|---|---|---|---|
| Quadrant | DetID | PixID | Counts | Sigma | Mean | Median | Sigma |
| A | 10 | 83 | 250040 | 1819.93 | 683 | 673 | 137.0 |
| A | 13 | 248 | 17846 | 125.33 | 683 | 673 | 137.0 |
| A | 13 | 6 | 16753 | 117.36 | 683 | 673 | 137.0 |
| B | 5 | 184 | 534593 | 4318.58 | 645 | 631 | 123.6 |
| B | 5 | 172 | 406113 | 3279.46 | 645 | 631 | 123.6 |
| B | 0 | 229 | 327551 | 2644.06 | 645 | 631 | 123.6 |
| C | 0 | 10 | 344343 | 2297.25 | 645 | 653 | 149.6 |
| C | 15 | 214 | 241612 | 1610.59 | 645 | 653 | 149.6 |
| C | 3 | 233 | 9953 | 62.16 | 645 | 653 | 149.6 |
| D | 12 | 17 | 607929 | 3989.05 | 621 | 604 | 152.2 |
| D | 10 | 253 | 430365 | 2822.77 | 621 | 604 | 152.2 |
| D | 12 | 233 | 385596 | 2528.71 | 621 | 604 | 152.2 |
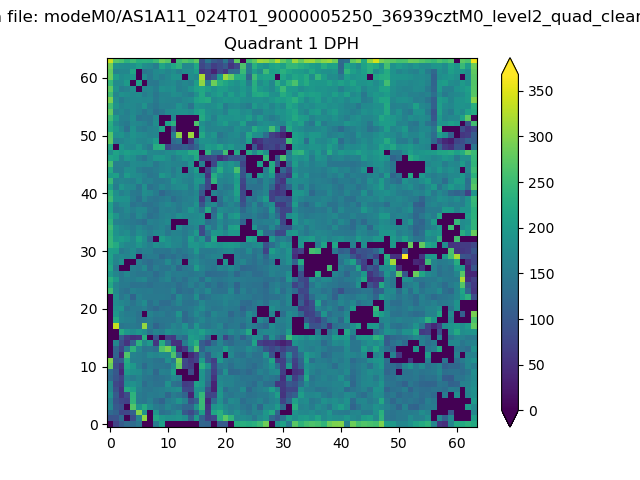
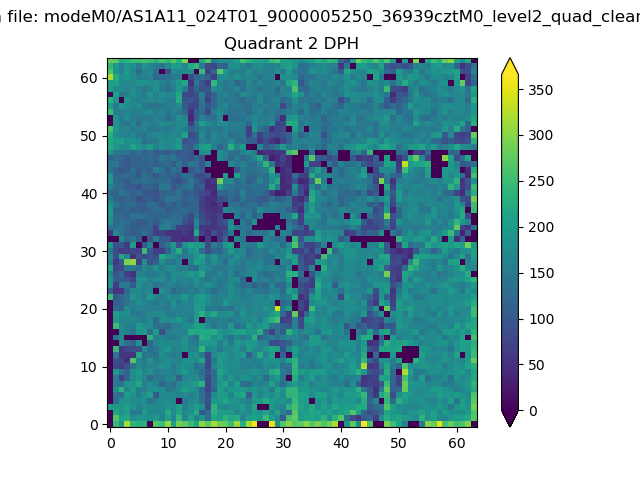
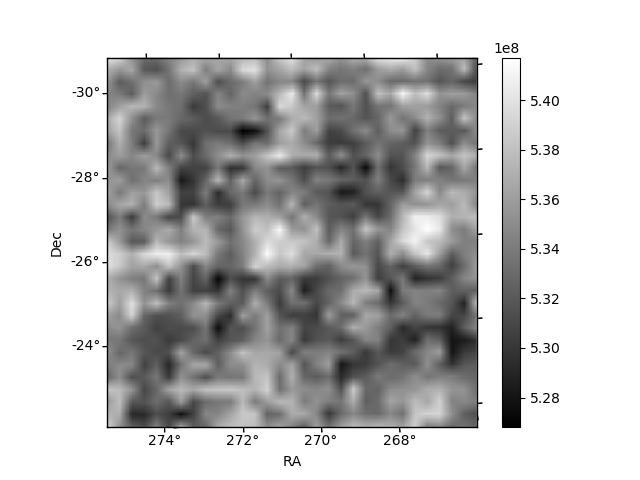
Histogram calculated using DETX and DETY for each event in the final _common_clean file
| Quadrant A | 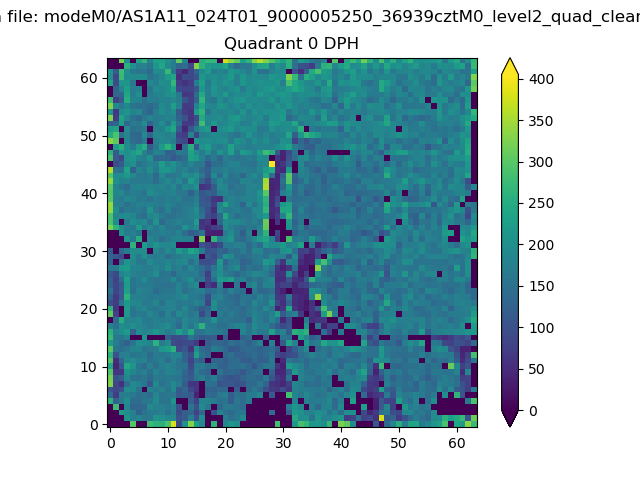 |
 |
Quadrant B |
|---|---|---|---|
| Quadrant D | 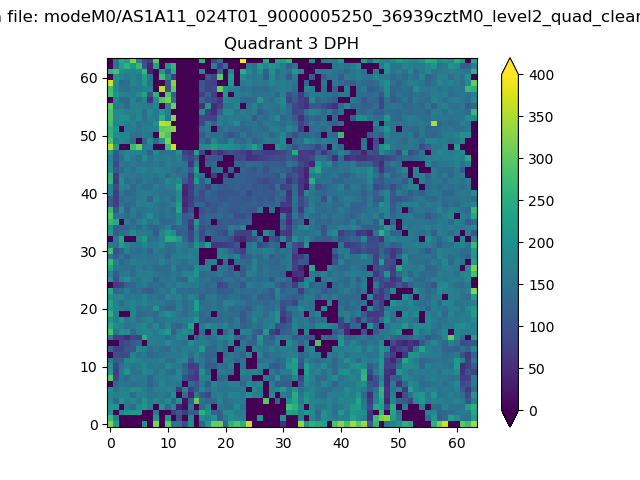 |
 |
Quadrant C |
| Plot type | Count rate plots | Images |
|---|---|---|
| Comparison with Poisson distribution Blue bars denote a histogram of data divided into 1 sec bins. Red curve is a Poisson curve with rate = median count rate of data. |
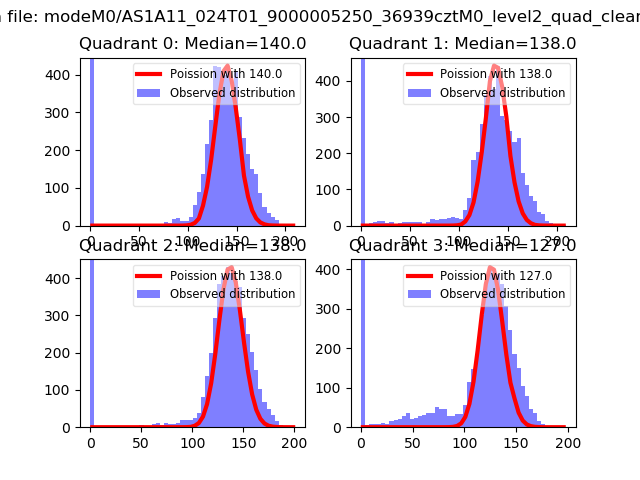 |
 |
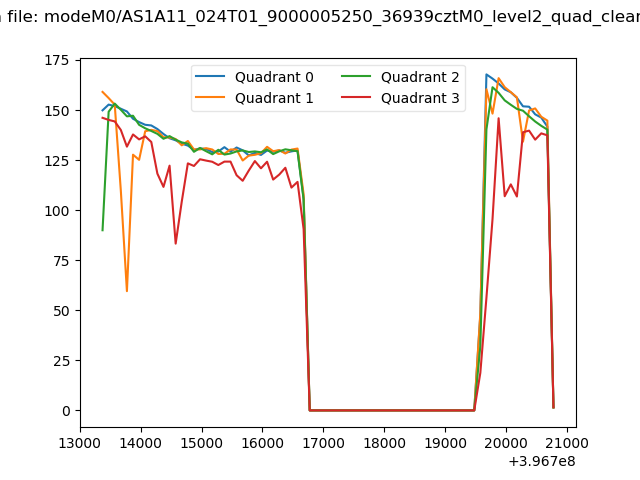
| Quadrant-wise count rates Data is divided into 100 sec bins |
 |
|
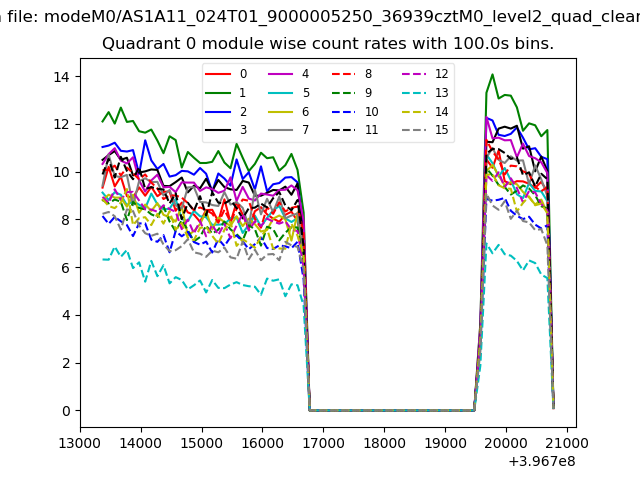
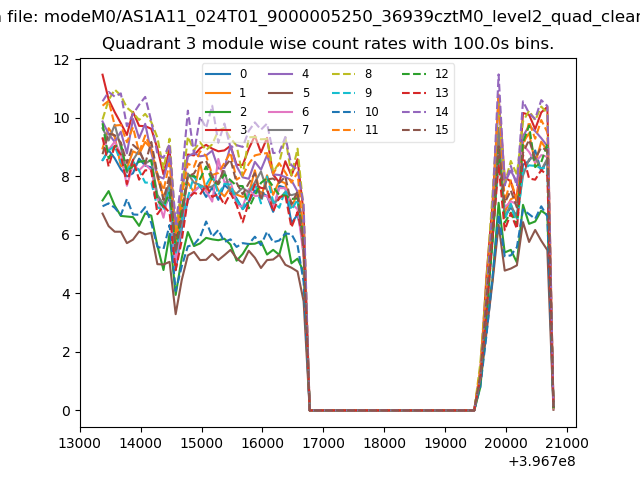
| Module-wise count rates for Quadrant A Data is divided into 100 sec bins |
 |
 |
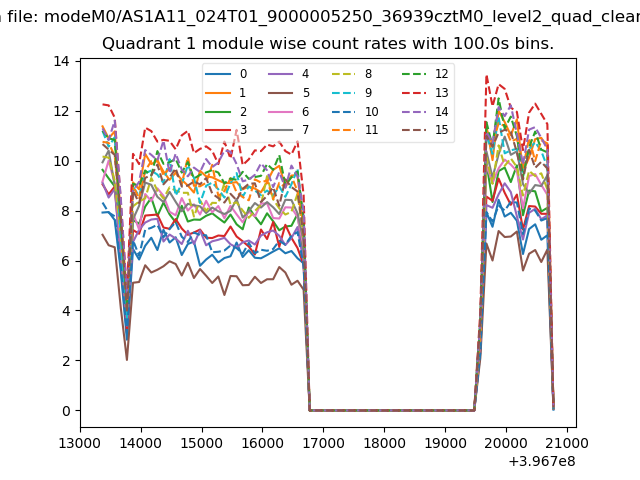
| Module-wise count rates for Quadrant B Data is divided into 100 sec bins |
 |
 |
| Module-wise count rates for Quadrant C Data is divided into 100 sec bins |
 |
 |
| Module-wise count rates for Quadrant D Data is divided into 100 sec bins |
 |
 |
| Parameter | Plot |
|---|---|
| CZT HV Monitor | 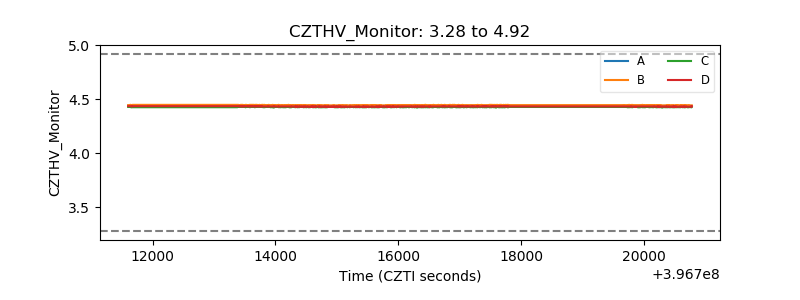 |
| D_VDD | 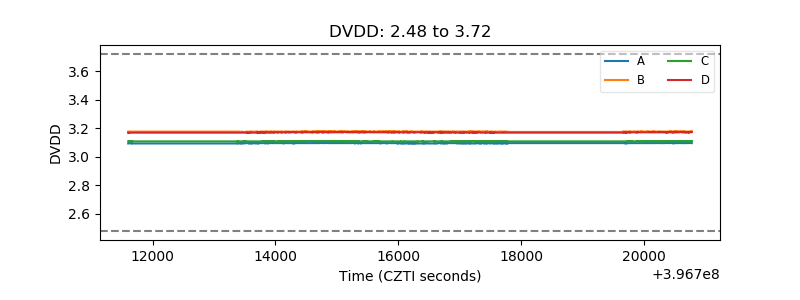 |
| Temperature 1 | 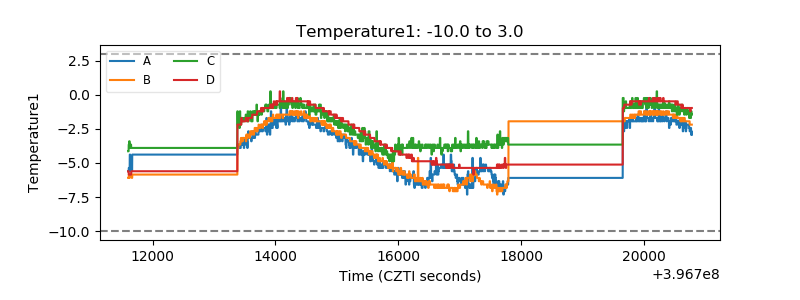 |
| Veto HV Monitor | 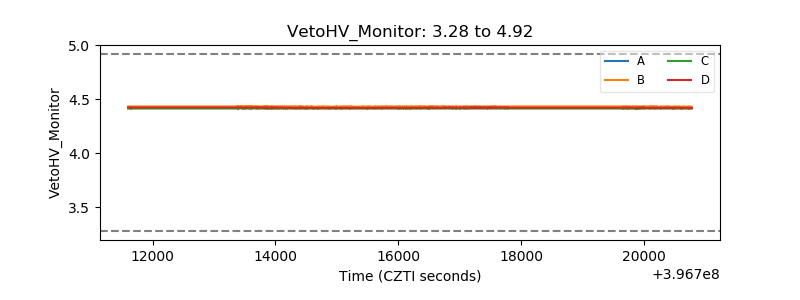 |
| Veto LLD | 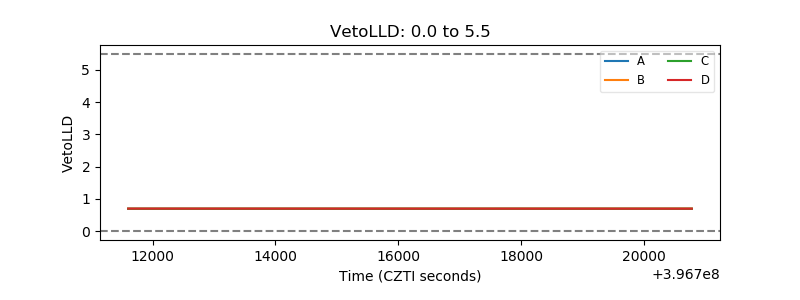 |
| Alpha Counter | 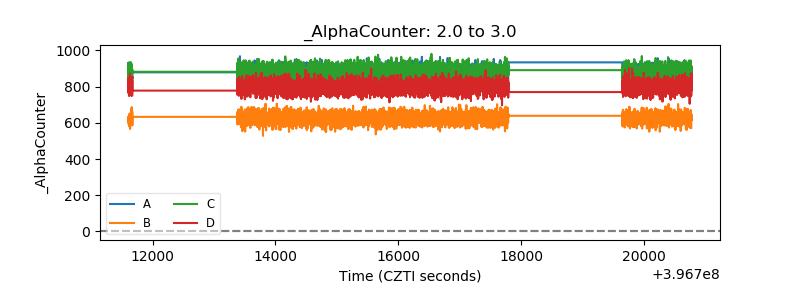 |
| _CPM_Rate | 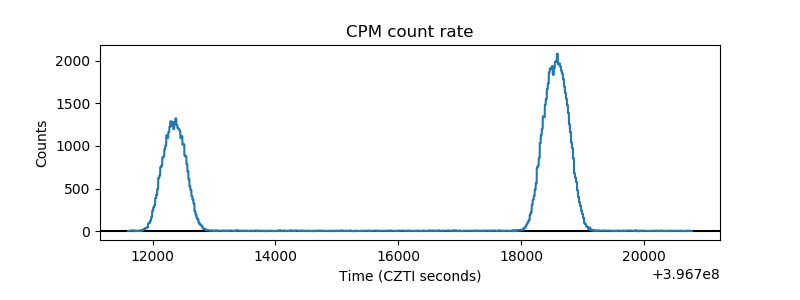 |
| CZT Counter | 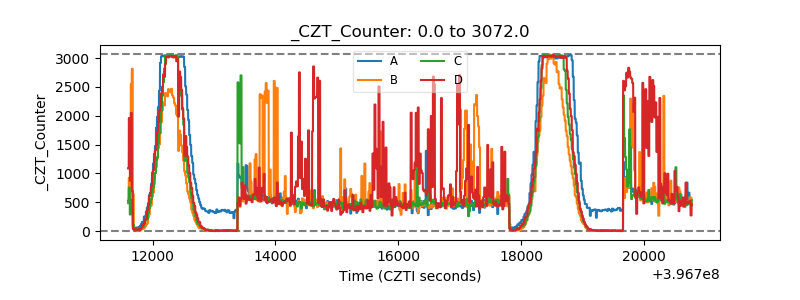 |
| +2.5 Volts monitor | 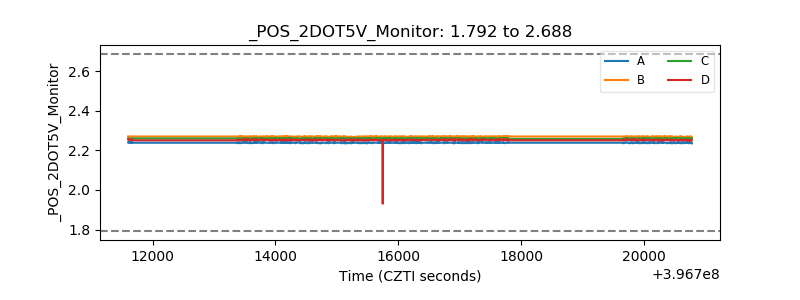 |
| +5 Volts monitor | 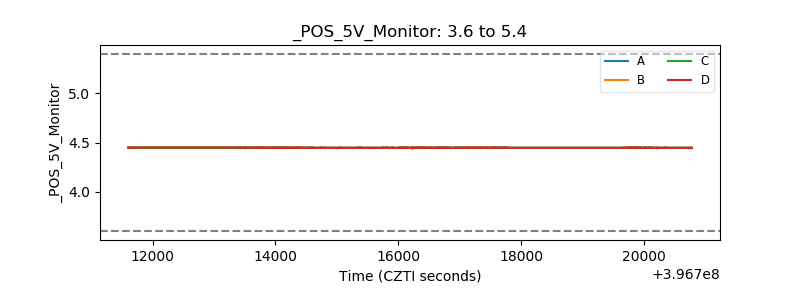 |
| _ROLL_ROT | 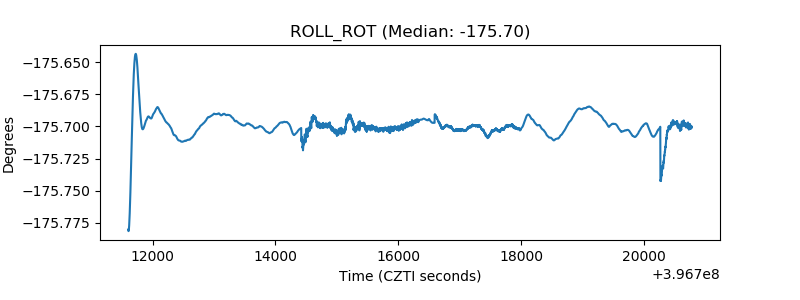 |
| _Roll_DEC | 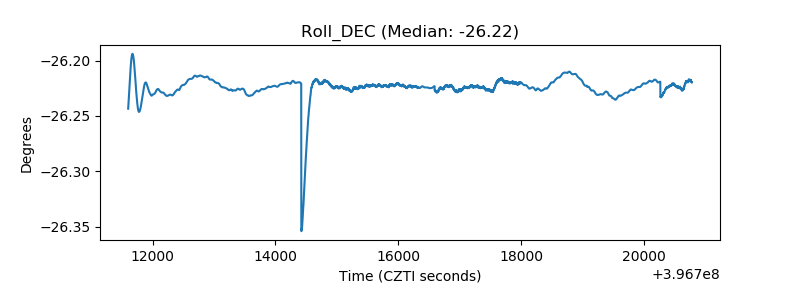 |
| _Roll_RA | 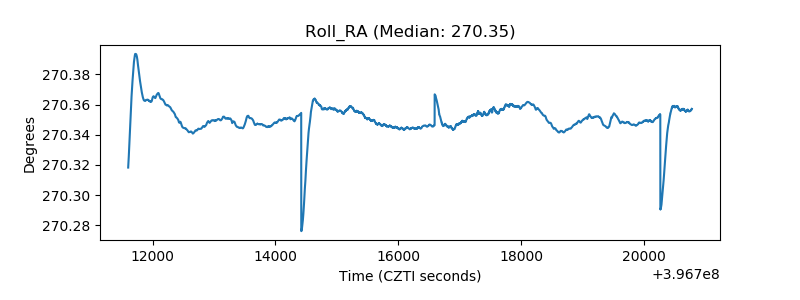 |
| Veto Counter | 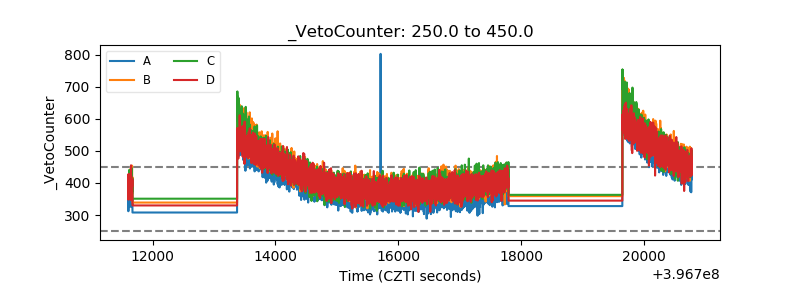 |