| Param | Original file | Final file |
|---|---|---|
| Filename | modeM0/AS1A11_024T01_9000005250_36940cztM0_level2.evt | modeM0/AS1A11_024T01_9000005250_36940cztM0_level2_quad_clean.evt |
| Size (bytes) | 479,393,280 | 87,399,360 |
| Size | 457.2 MB | 83.4 MB |
| Events in quadrant A | 2,894,394 | 592,578 |
| Events in quadrant B | 3,410,326 | 584,492 |
| Events in quadrant C | 3,031,290 | 572,569 |
| Events in quadrant D | 4,819,452 | 522,368 |
| Mode M9 | |||
|---|---|---|---|
| Quadrant | BADHDUFLAG | Total packets | Discarded packets |
| A | 0 | 23 | 0 |
| B | 0 | 23 | 0 |
| C | 0 | 23 | 0 |
| D | 0 | 24 | 0 |
| Mode SS | |||
|---|---|---|---|
| Quadrant | BADHDUFLAG | Total packets | Discarded packets |
| A | 0 | 110 | 0 |
| B | 0 | 110 | 0 |
| C | 0 | 110 | 0 |
| D | 0 | 110 | 0 |
| Mode M0 | |||
|---|---|---|---|
| Quadrant | BADHDUFLAG | Total packets | Discarded packets |
| A | 0 | 11963 | 3 |
| B | 0 | 13644 | 2 |
| C | 0 | 12181 | 2 |
| D | 0 | 17928 | 2 |
| Quadrant | Total seconds | Saturated seconds | Saturation percentage |
|---|---|---|---|
| A | 5347 | 30 | 0.561062% |
| B | 5347 | 137 | 2.562184% |
| C | 5347 | 80 | 1.496166% |
| D | 5347 | 693 | 12.960539% |
Noise dominated data is calculated using 1-second bins in cleaned event files. If a bin has >2000 counts, and if more than 50% of those come from <1% of pixels, then it is considered to be noise-dominated and hence unusable.
| Quadrant | # 1 sec bins | Bins with >0 counts | Bins with >2000 counts | High rate bins dominated by noise | Noise dominated (total time) | Noise dominated (detector-on time) | Marked lightcurve |
|---|---|---|---|---|---|---|---|
| A | 7321 | 5348 | 8 | 8 | 0.11% | 0.15% | 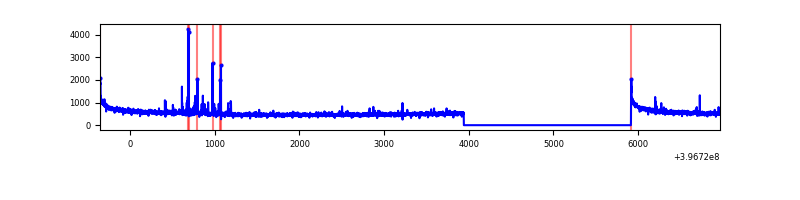 |
| B | 7321 | 5348 | 88 | 88 | 1.20% | 1.65% | 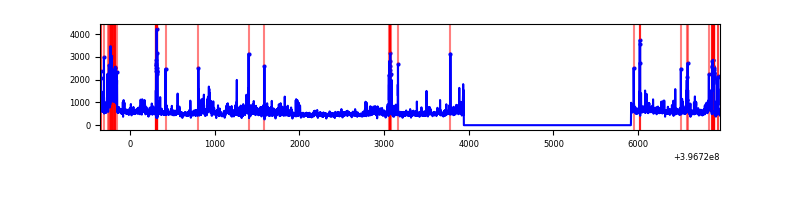 |
| C | 7321 | 5348 | 59 | 59 | 0.81% | 1.10% | 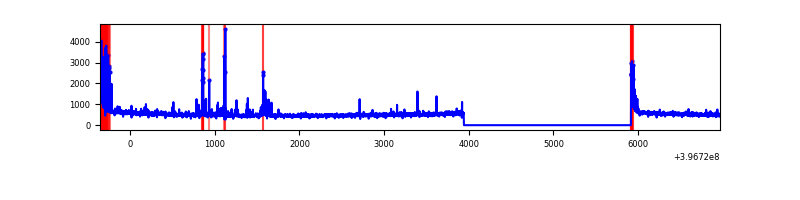 |
| D | 7321 | 5348 | 640 | 640 | 8.74% | 11.97% | 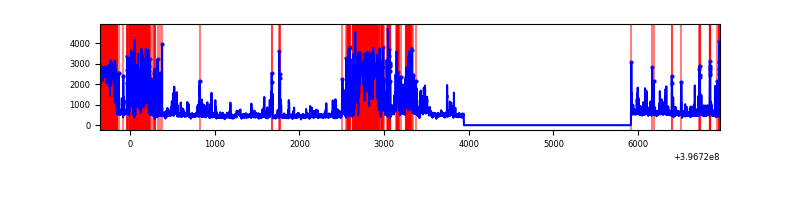 |
Top three noisy pixels from each quadrant. If the there are fewer than three noisy pixels in the level2.evt file, extra rows are filled as -1
| Pixel properties | Quadrant properties | ||||||
|---|---|---|---|---|---|---|---|
| Quadrant | DetID | PixID | Counts | Sigma | Mean | Median | Sigma |
| A | 10 | 83 | 250648 | 1877.78 | 662 | 653 | 133.1 |
| A | 13 | 248 | 46575 | 344.93 | 662 | 653 | 133.1 |
| A | 9 | 143 | 18045 | 130.64 | 662 | 653 | 133.1 |
| B | 0 | 190 | 135794 | 1098.86 | 646 | 632 | 123.0 |
| B | 5 | 184 | 135158 | 1093.69 | 646 | 632 | 123.0 |
| B | 0 | 219 | 112451 | 909.08 | 646 | 632 | 123.0 |
| C | 0 | 10 | 231815 | 1594.47 | 623 | 629 | 145.0 |
| C | 15 | 214 | 231635 | 1593.22 | 623 | 629 | 145.0 |
| C | 15 | 159 | 114164 | 783.04 | 623 | 629 | 145.0 |
| D | 12 | 17 | 1083182 | 7482.35 | 593 | 578 | 144.7 |
| D | 10 | 253 | 434111 | 2996.34 | 593 | 578 | 144.7 |
| D | 12 | 233 | 293112 | 2021.83 | 593 | 578 | 144.7 |
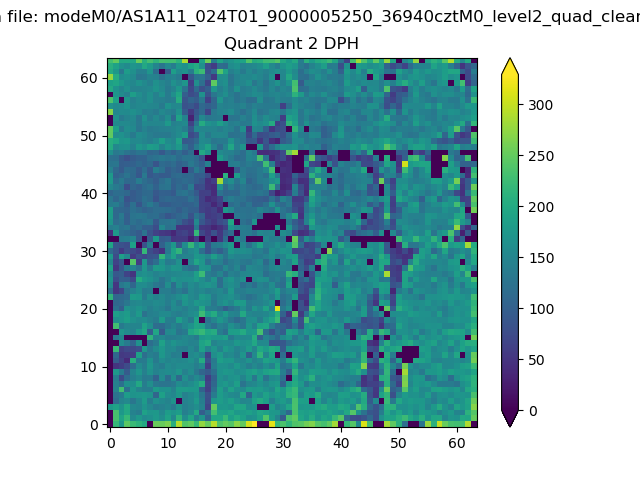
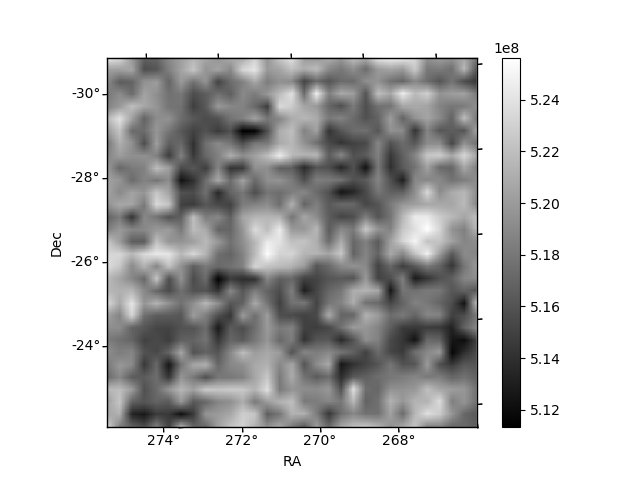
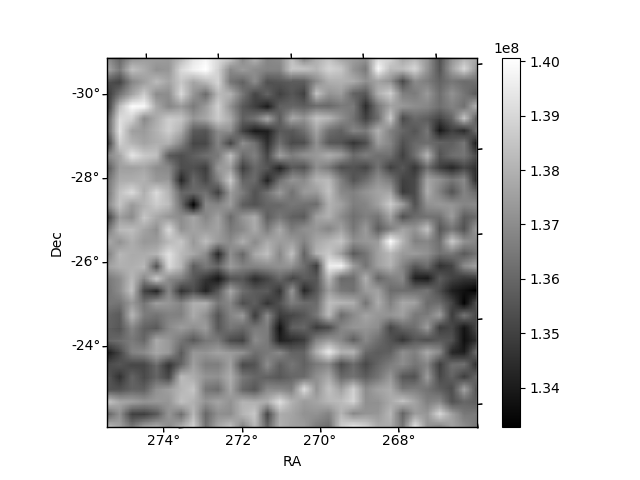
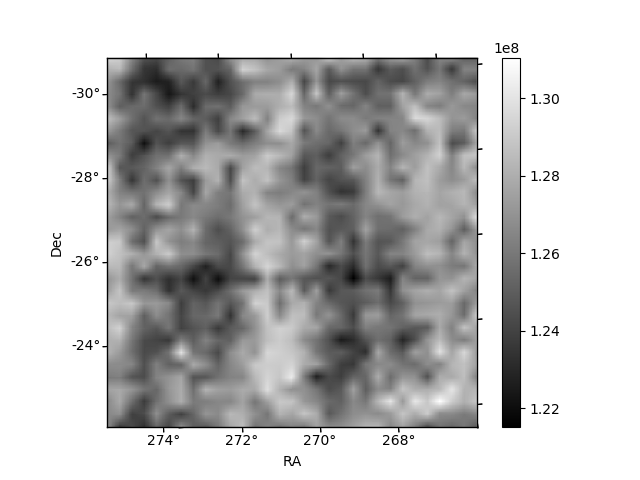
Histogram calculated using DETX and DETY for each event in the final _common_clean file
| Quadrant A | 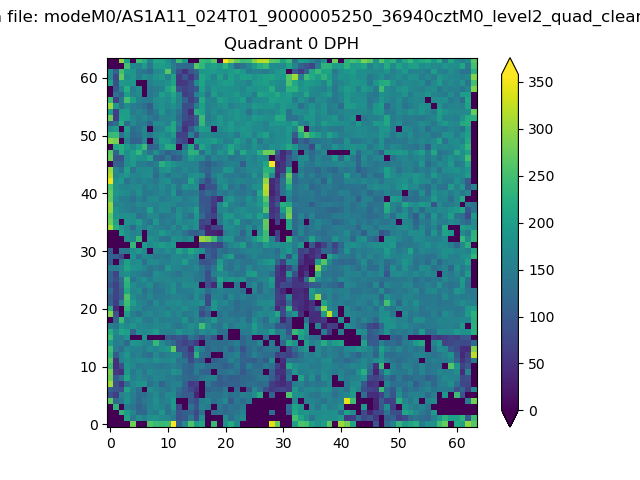 |
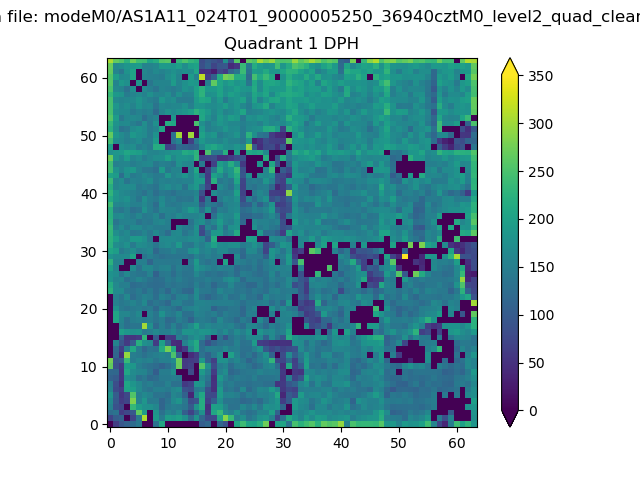 |
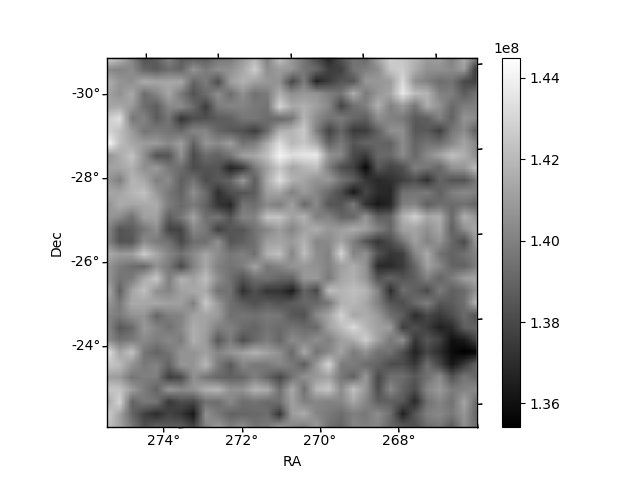
Quadrant B |
|---|---|---|---|
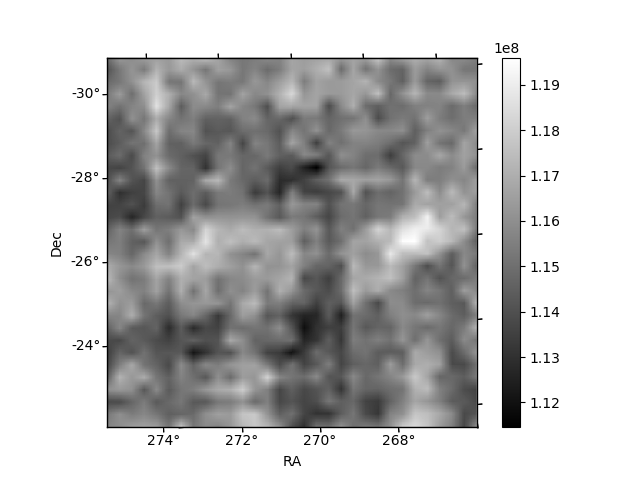
| Quadrant D | 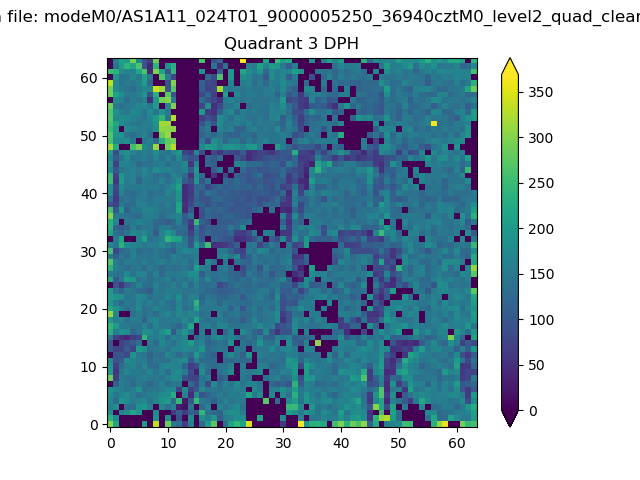 |
 |
Quadrant C |
| Plot type | Count rate plots | Images |
|---|---|---|
| Comparison with Poisson distribution Blue bars denote a histogram of data divided into 1 sec bins. Red curve is a Poisson curve with rate = median count rate of data. |
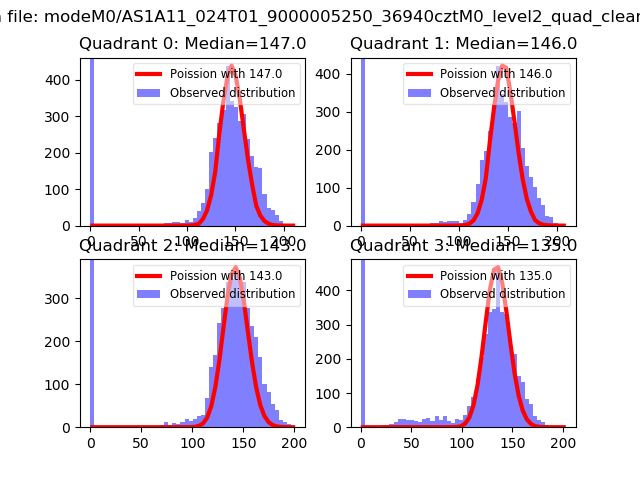 |
 |
| Quadrant-wise count rates Data is divided into 100 sec bins |
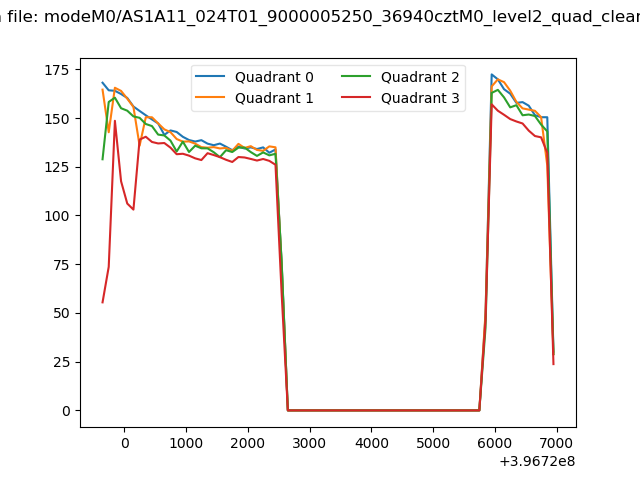 |
|
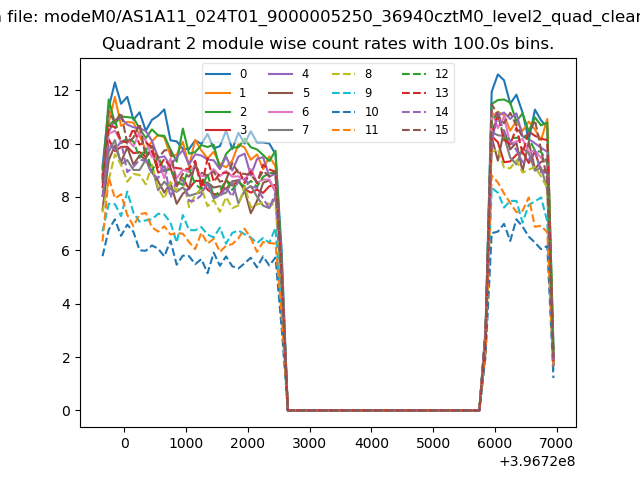
| Module-wise count rates for Quadrant A Data is divided into 100 sec bins |
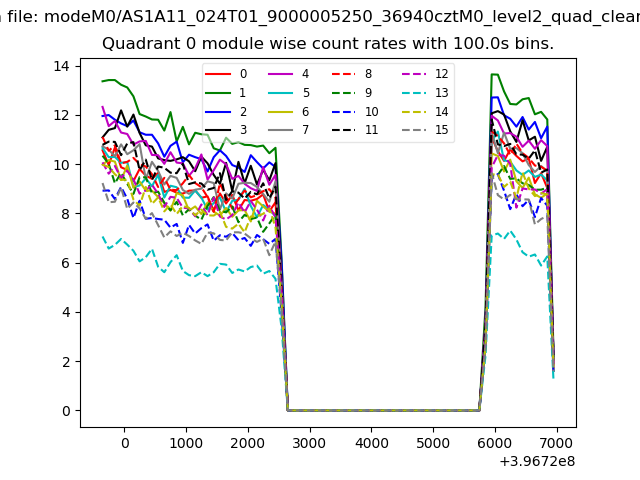 |
 |
| Module-wise count rates for Quadrant B Data is divided into 100 sec bins |
 |
 |
| Module-wise count rates for Quadrant C Data is divided into 100 sec bins |
 |
 |
| Module-wise count rates for Quadrant D Data is divided into 100 sec bins |
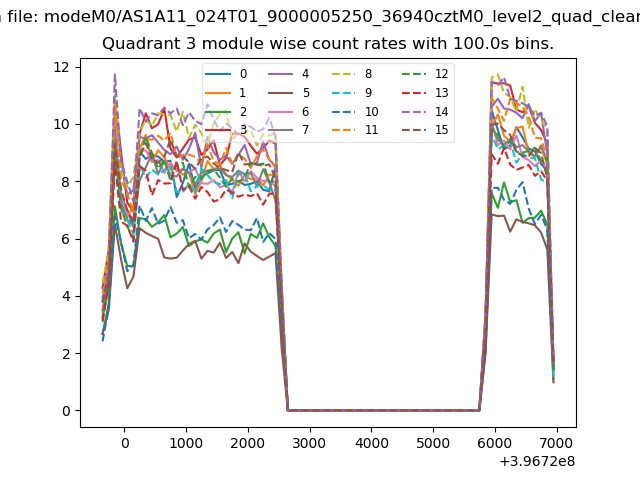 |
 |
| Parameter | Plot |
|---|---|
| CZT HV Monitor | 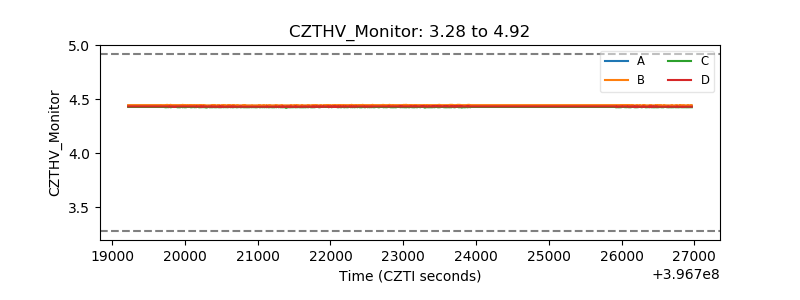 |
| D_VDD | 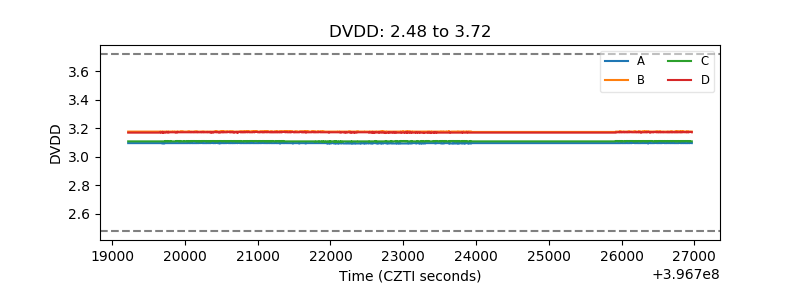 |
| Temperature 1 | 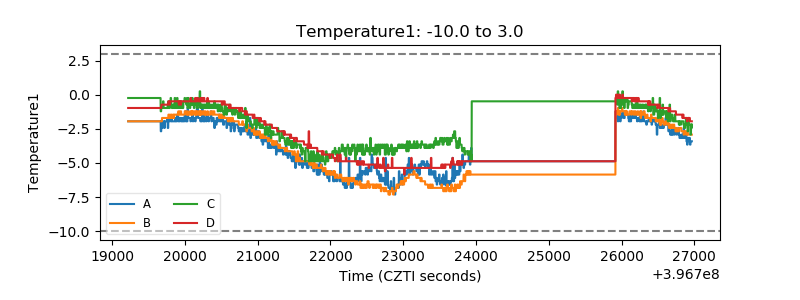 |
| Veto HV Monitor | 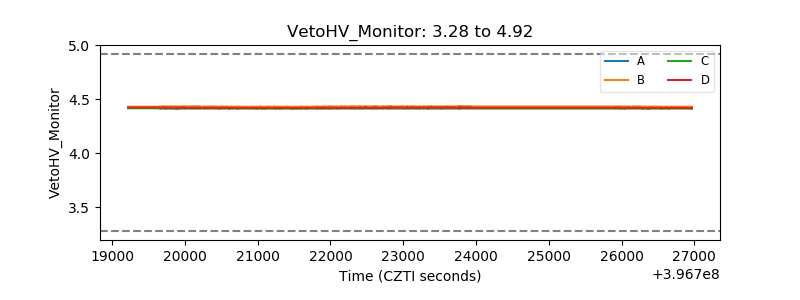 |
| Veto LLD | 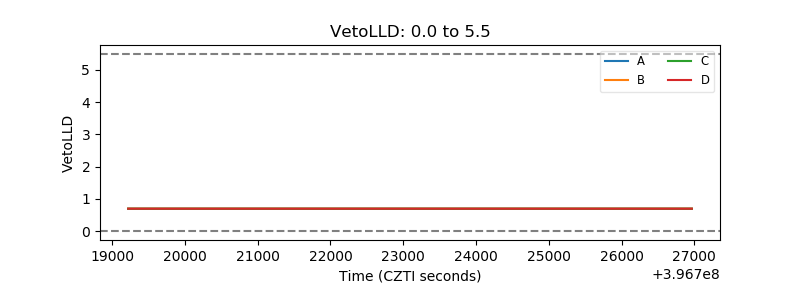 |
| Alpha Counter | 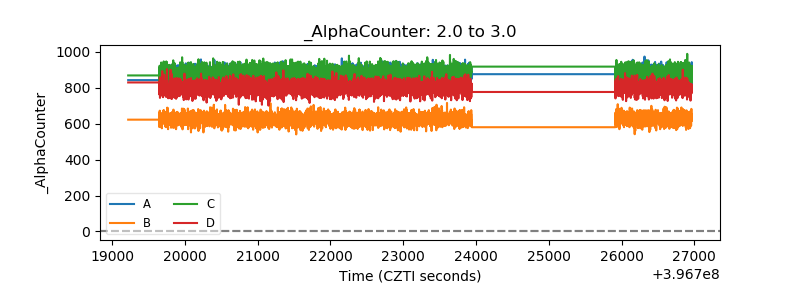 |
| _CPM_Rate | 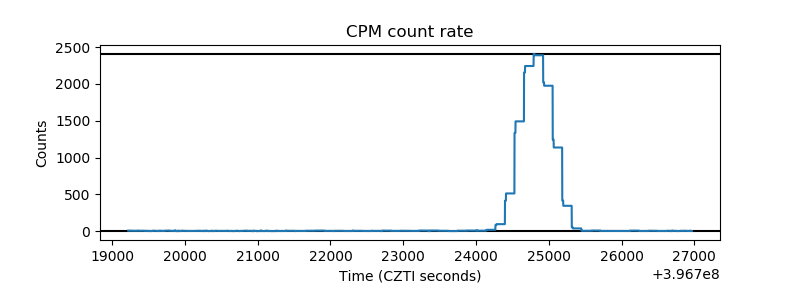 |
| CZT Counter | 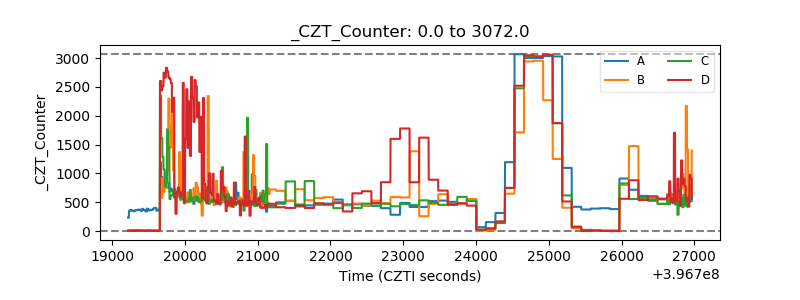 |
| +2.5 Volts monitor | 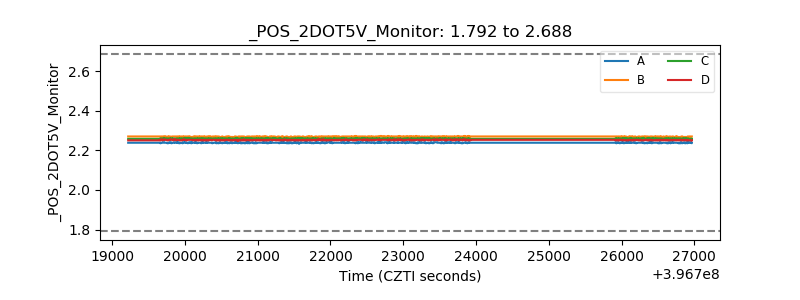 |
| +5 Volts monitor | 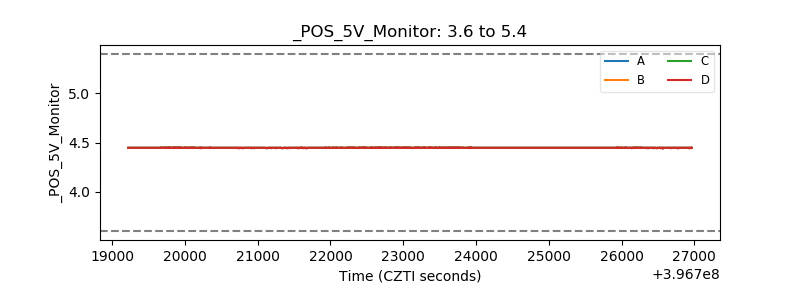 |
| _ROLL_ROT | 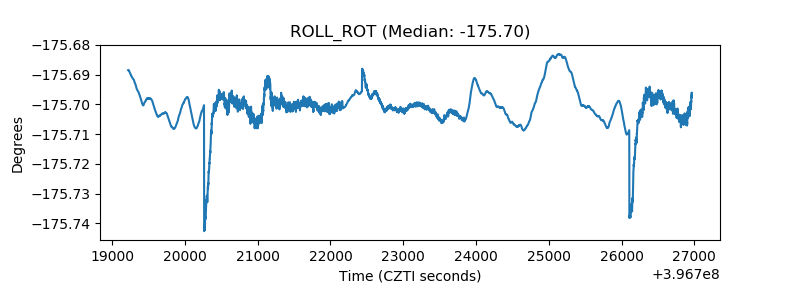 |
| _Roll_DEC | 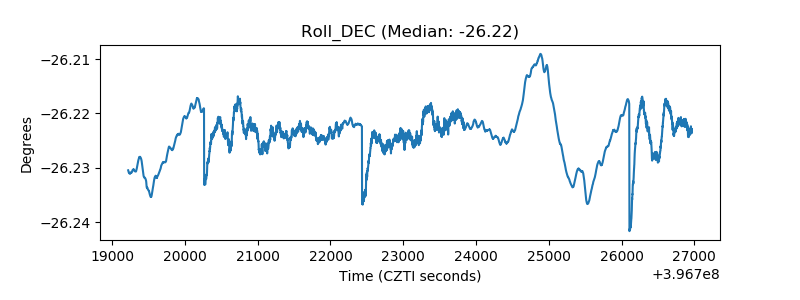 |
| _Roll_RA | 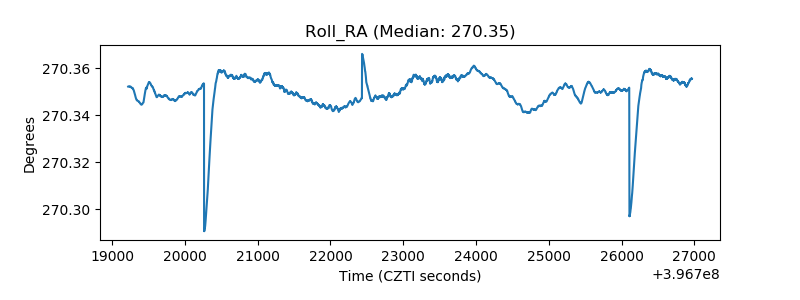 |
| Veto Counter | 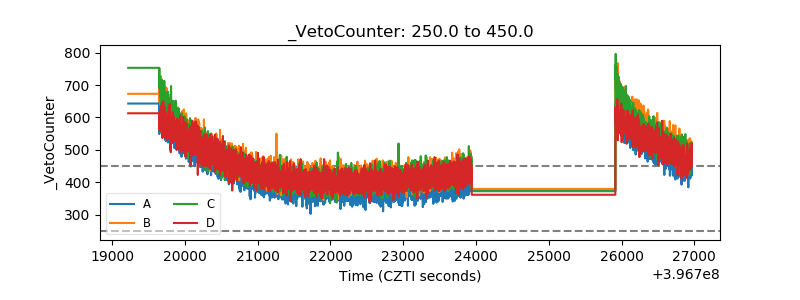 |